GBPNZD: We could see a rejection at resistance once moreGBPNZD is range bound currently, and this latest moves continues the narrative of it. Right now, it's approaching a major resistance, where each touch here has showed good rejection.
My target would be toward 2.25230, an achievable target.
Though a scenario for more upside is possible and can happen just as much. But, I would take the side for more downside in this particular case.
Let me know in the comments what you think:
Disclosure: I am part of Trade Nation's Influencer program and receive a monthly fee for using their TradingView charts in my analysis.
Forextrading

AUDCAD: Pullback From Resistance 🇦🇺🇨🇦
AUDCAD may retrace from the underlined blue resistance.
A breakout of a support line of a rising wedge pattern
after its test leaves a strong bearish clue.
We can expect a pullback to 0.8962 level.
❤️Please, support my work with like, thank you!❤️
I am part of Trade Nation's Influencer program and receive a monthly fee for using their TradingView charts in my analysis.

Market Analysis: AUD/USD Much Higher—Uptrend Shows StrengthMarket Analysis: AUD/USD Much Higher—Uptrend Shows Strength
AUD/USD started a decent increase above the 0.6480 and 0.6500 levels.
Important Takeaways for AUD/USD Analysis Today
- The Aussie Dollar started a decent increase above the 0.6450 level against the US Dollar.
- There is a connecting bearish trend line forming with resistance at 0.6530 on the hourly chart of AUD/USD.
AUD/USD Technical Analysis
On the hourly chart of AUD/USD, the pair started a fresh increase from the 0.6450 support. The Aussie Dollar was able to clear the 0.6470 resistance to move into a positive zone against the US Dollar.
There was a close above the 0.6500 resistance and the 50-hour simple moving average. Finally, the pair tested the 0.6540 zone. A high was formed near 0.6541 and the pair recently started a consolidation phase.
There was a move below the 23.6% Fib retracement level of the upward move from the 0.6449 swing low to the 0.6541 high. On the downside, initial support is near the 0.6510 level.
The next major support is near the 0.6495 zone or the 50% Fib retracement level. If there is a downside break below 0.6495, the pair could extend its decline toward the 0.6470 level. Any more losses might signal a move toward 0.6450.
On the upside, the AUD/USD chart indicates that the pair is now facing resistance near 0.6530. There is also a connecting bearish trend line forming with resistance at 0.6530.
The first major resistance might be 0.6540. An upside break above it might send the pair further higher. The next major resistance is near the 0.6580 level. Any more gains could clear the path for a move toward the 0.6600 resistance zone.
This article represents the opinion of the Companies operating under the FXOpen brand only. It is not to be construed as an offer, solicitation, or recommendation with respect to products and services provided by the Companies operating under the FXOpen brand, nor is it to be considered financial advice.

Market Analysis: NZD/USD Much Higher—Uptrend Shows StrengthMarket Analysis: NZD/USD Much Higher—Uptrend Shows Strength
NZD/USD is also rising and might aim for more gains above 0.5970.
Important Takeaways for NZD/USD Analysis Today
- NZD/USD is consolidating gains above the 0.5940 zone.
- There is a short-term declining channel forming with resistance at 0.5960 on the hourly chart of NZD/USD.
NZD/USD Technical Analysis
On the hourly chart of NZD/USD on FXOpen, the pair started a steady increase from the 0.5880 zone. The New Zealand Dollar broke the 0.5925 resistance to start the recent increase against the US Dollar.
The pair settled above 0.5940 and the 50-hour simple moving average. It tested the 0.5970 zone and is currently consolidating gains. There was a move below the 23.6% Fib retracement level of the upward move from the 0.5881 swing low to the 0.5971 high.
The NZD/USD chart suggests that the RSI is stable above 50. On the upside, the pair might struggle near 0.5960. There is also a short-term declining channel forming with resistance at 0.5960.
The next major resistance is near the 0.5970 level. A clear move above the 0.5970 level might even push the pair toward the 0.6000 level. Any more gains might clear the path for a move toward the 0.6020 resistance zone in the coming days.
On the downside, immediate support is near the 0.5940 level. The first key support is near the 0.5925 level. It is close to the 50% Fib retracement level of the upward move from the 0.5881 swing low to the 0.5971 high.
The next major support is near the 0.5900 level. If there is a downside break below it, the pair might slide toward 0.5880. Any more losses could lead NZD/USD to 0.5820.
This article represents the opinion of the Companies operating under the FXOpen brand only. It is not to be construed as an offer, solicitation, or recommendation with respect to products and services provided by the Companies operating under the FXOpen brand, nor is it to be considered financial advice.

Gold Technical & Fundamental Update | August 11–15, 2025XAUUSD closed last week near $3,400 after breaking above the resistance of the descending channel. Price action has been choppy, hinting at cautious buying ahead of major U.S. events this week, CPI, PPI, Retail Sales, and Fed commentary.
Key levels:
✅$3,380: Above = bullish bias continues; Below = look for selling setups
✅Support: Former channel resistance now acting as a retest zone
✅Trend guide: Ascending trendlines from the early August recovery
Watch how gold reacts to $3,380 early in the week. This will set the tone for either continuation toward recent highs or a deeper pullback.
#gold #xauusd #forex #technicalanalysis #marketupdate #tradingvie
I’ll update my thoughts in the comments as price action unfolds.
Disclaimer:
Based on experience and what I see on the charts, this is my take. It’s not financial advice—always do your research and consult a licensed advisor before trading.


EURUSDHello Traders! 👋
What are your thoughts on EURUSD?
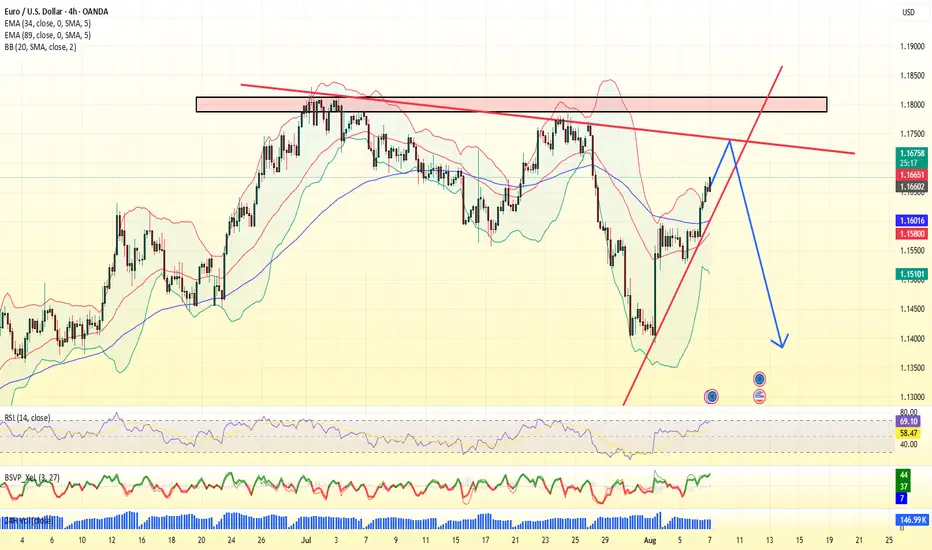
EUR/USD is trading below a key resistance area and has recently completed a pullback to the broken trendline.
As long as the pair remains under this resistance, we expect some short-term consolidation, followed by a renewed bearish move toward lower levels.
The bearish outlook remains valid while price stays below the resistance zone.
A clean break above this level would invalidate the bearish scenario.
Will EUR/USD resume its decline, or break through resistance? Share your view below! 👇
Don’t forget to like and share your thoughts in the comments! ❤️

Fed cuts interest rates or political tensions riseExperts from financial institutions such as Tierra, Goldman Sachs, and UBS predict that the world gold price in August will fluctuate around the threshold of 3,420 - 3,520 USD/ounce, and may exceed 3,600 USD/ounce if the FED cuts interest rates or political tensions increase.
Ms. Soni Kumari - commodity strategist at ANZ, commented: "Uncertainty is back in the spotlight, especially after new developments related to tariffs, which is reviving safe-haven demand. In addition, macro market sentiment also supports gold, especially when the USD weakens and expectations of the FED cutting interest rates increase."

MarketBreakdown | USDJPY, NZDUSD, EURJPY, US100
Here are the updates & outlook for multiple instruments in my watch list.
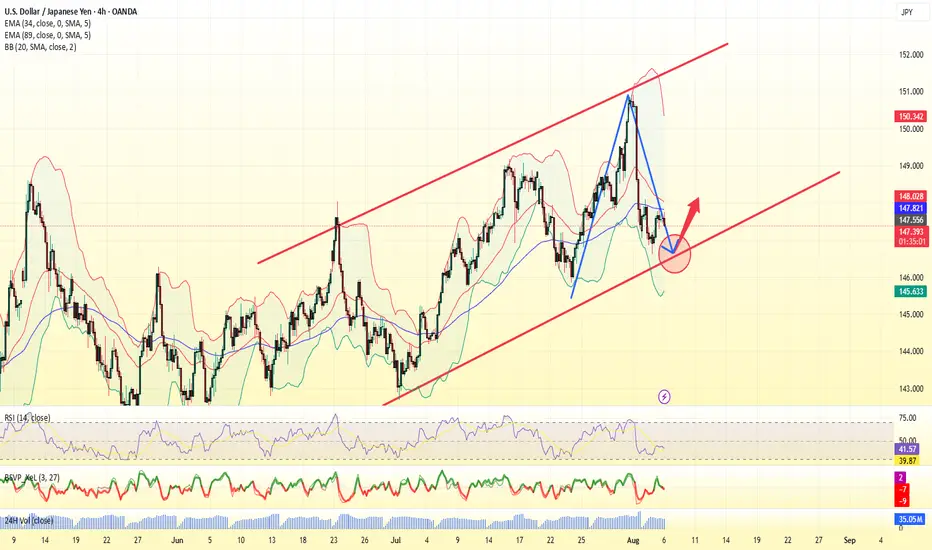
1️⃣ #USDJPY daily time frame 🇺🇸🇯🇵
The market is trading in uptrend.
After the price updated a high, it retraced.
I see a consolidation now and a formation of a narrow
horizontal trading range.
A bullish breakout of a resistance of the range and a daily
candle close above that will provide a strong trend-following bullish signal.
An uptrend will most likely resume then.
2️⃣ #NZDUSD daily time frame 🇳🇿🇺🇸
A test of a historically significant major demand cluster triggered a strong
bullish reaction. The price violated a strong resistance and closed above that.
I think that the market will most likely continue growing.
3️⃣ #EURJPY daily time frame 🇪🇺🇯🇵
The pair is trading within a horizontal parallel channel.
With the absence of high impact fundamental news today,
I think that the market will most likely continue consolidating
and the price may retrace from the resistance.
4️⃣ #NASDAQ Index #US100 daily time frame 🇺🇸🇨🇭
Looks like the market is preparing to update the ATH.
A confirmed violation of a minor daily resistance and a valid
Change of Character on intraday time frames indicate clear
strength of the buyers.
I guess that 23700 level will be tested soon with its highly probable breakout.
Do you agree with my market breakdown?
❤️Please, support my work with like, thank you!❤️
I am part of Trade Nation's Influencer program and receive a monthly fee for using their TradingView charts in my analysis.

EURUSD; Heikin Ashi Trade Idea📈 Hey Traders!
Here’s a fresh outlook from my trading desk. If you’ve been following me for a while, you already know my approach:
🧩 I trade Supply & Demand zones using Heikin Ashi chart on the 4H timeframe.
🧠 I keep it mechanical and clean — no messy charts, no guessing games.
❌ No trendlines, no fixed sessions, no patterns, no indicator overload.
❌ No overanalyzing market structure or imbalances.
❌ No scalping, and no need to be glued to the screen.
✅ I trade exclusively with limit orders, so it’s more of a set-and-forget style.
✅ This means more freedom, less screen time, and a focus on quality setups.
✅ Just a simplified, structured plan and a calm mindset.
💬 Let’s Talk:
💡Do you trade supply & demand too ?
💡What’s your go-to timeframe ?
💡Ever tried Heikin Ashi ?
📩 Got questions about my strategy or setup? Drop them below — ask me anything, I’m here to share.
Let’s grow together and keep it simple. 👊

Forex Market Structure and Factors Affecting ItForex Market Structure and Factors Affecting It
The forex market, a vast and dynamic financial arena, operates uniquely as a decentralised over-the-counter network. This article delves into its intricate structure, exploring the roles of various participants and the influence of technology. Understanding these elements is essential for anyone looking to navigate and succeed in the world of forex trading.
Understanding Market Structure in Forex
The structure of the foreign exchange market, commonly known as the forex market, is uniquely decentralised and operates over-the-counter (OTC). Unlike traditional markets with a central exchange, forex is a vast network of dealers, brokers, and financial institutions globally. This setup allows for 24-hour trading five days a week, accommodating various time zones and providing constant access to market participants.
Each participant plays a pivotal role in shaping the basic market structure of forex, with banks and financial institutions primarily acting as market makers, providing liquidity and setting prices for retail traders and brokers. This complex web of interactions and the decentralised nature of the market ensure constant movement in currency values, offering numerous opportunities for trading and speculation.
Participants in the Forex Market
In the diverse landscape of forex trading, the structure is made up of a range of participants. Each group influences the market's dynamics in unique ways:
- Central Banks and Governments: They regulate monetary policies and currency supply, impacting prices. For example, the US Federal Reserve significantly influences the value of the US dollar.
- Commercial Banks: As intermediaries, they facilitate transactions and engage in speculative trading, contributing to liquidity.
- Multinational Corporations: Involved in cross-border transactions, these entities engage in trading to manage currency risks.
- Retail Traders: Individual traders speculate on currency movements using online platforms, forming a significant market portion.
- Institutional Traders: Entities like hedge funds and asset management firms, which trade with sophisticated strategies and considerable resources.
Market Tiers and Interactions
The forex market's structure is defined by distinct tiers and interactions among its participants. Each tier plays a unique role:
- Tier 1: Major Players - This top tier includes large banks, financial institutions, and central banks. They have the most significant impact on market dynamics, often setting trends and liquidity standards.
- Tier 2: Intermediaries - Comprising smaller banks and financial firms, they serve as intermediaries, facilitating transactions and linking Tier 1 entities with smaller participants.
- Tier 3: Retail Market - At this level are individual investors, small businesses, and retail traders. They interact with the market primarily through brokers and online platforms, influenced heavily by the actions of the upper tiers.
These tiers illustrate the varied types of market structure in forex, reflecting the complexity and diversity of trading interactions.
Central Bank's Role in Market Structure
Central banks play a pivotal role in shaping the advanced market structure in forex. They influence the market through several key mechanisms:
- Monetary Policy: Central banks determine monetary policy, which directly influences interest rates. This, in turn, affects the attractiveness of a country's currency, thereby impacting forex rates and market dynamics.
- Market Stabilisation: In times of volatility, central banks can intervene in currency markets to stabilise currencies. Interventions involve buying or selling their own currency to influence exchange rates, directly affecting market structure.
- Regulatory Oversight: Central banks often have a regulatory role, overseeing banking and financial systems. Their regulations can influence accessibility, liquidity, and transparency, which are critical for a well-functioning forex market.
- Economic Signalling: Central banks release economic data and policy decisions that serve as key indicators for traders. This information can lead to anticipatory moves in the markets, shaping prices based on perceived economic strength or weakness.
- Foreign Exchange Reserves Management: Central banks manage significant foreign exchange reserves. Their strategies in managing these reserves, including decisions on when and how much to buy or sell, have a substantial impact on forex liquidity.
Technology’s Impact on Market Structure
Technological advancements have significantly reshaped the market structure in forex, introducing new dynamics and efficiencies. Electronic trading platforms, like electronic communication networks (ECNs), have revolutionised access to the forex market. Before these platforms, trades were often executed via traditional methods like phone calls.
Algorithmic trading uses computer programs for automatic trade execution, enabling fast, consistent transactions. High-frequency trading (HFT), a subset of algorithmic trading, executes thousands of trades per second, enhancing liquidity and reducing transaction costs but also raising concerns about market stability.
Furthermore, big data and analytics allow traders to analyse large datasets for price trends, refining their strategies. Mobile trading has democratised access, enabling trading from virtually anywhere, which has increased competition among brokers and accessibility for retail traders. These technological developments have increased efficiency and accessibility, contributing to a more interconnected and dynamic market.
The Bottom Line
Understanding the forex market structure is crucial for successful trading. This decentralised OTC network thrives on the interactions among various participants, influenced by central banks' policies and technological advancements. As traders navigate this dynamic environment, the right tools and knowledge are key.
This article represents the opinion of the Companies operating under the FXOpen brand only. It is not to be construed as an offer, solicitation, or recommendation with respect to products and services provided by the Companies operating under the FXOpen brand, nor is it to be considered financial advice.

Gold 15-Min Breakout: Eyes on M30 Supply Zone & FVG RetestPrice is currently approaching a key M30 Supply Zone after a strong bullish impulse from the ascending trendline support.
🔹 Key Observations:
The price broke above a previous short-term resistance zone and is now retesting the Fair Value Gap (FVG) area marked in pink.
The 200 EMA acted as dynamic support, further fueling bullish momentum.
Structure shows a series of higher lows, confirming buyers in control on intraday timeframes.
🔹 Potential Scenarios:
✅ Bullish Continuation:
If the price respects the FVG as demand and forms bullish confirmation, continuation toward the M30 Supply Zone and the 3,399–3,400 region is likely.
⚠️ Pullback Risk:
A deeper retracement below FVG could retest the trendline or the 3,371 support near the 200 EMA before any further upside.
🔹 Trade Plan:
Watching for price action reaction inside the FVG. A clean rejection could offer entries targeting the upper supply zone.

EURUSD rises slightly as US economy weakens more than expected1) Market Overview
EURUSD fluctuates around 1.0850 - 1.0960, with a slight upward trend thanks to
- US economic data is below expectations
- ECB maintains a mildly dovish stance, affirming that it will continue to monitor inflation instead of declaring an end to interest rate hikes
This week the market will focus on
- US CPI - which can cause strong fluctuations
- Some statements from ECB and FED members
- Geopolitical risks in the Middle East and Europe
2) Technical Analysis
- Trend: EURUSD is trending slightly upward, the main support level is around 1.0850 and strong resistance is at 1.0970-1.10000
- RSI: fluctuates near the 55-60 zone, not overbought, still has room to increase
- MACD: is crossing the signal line - a potential bullish signal
Gold Trend Analysis August 7, 2025Market Overview
- Gold prices rose slightly in the first trading session of the week due to geopolitical concerns in the Middle East and weak US employment data
- However, selling pressure returned in the early morning today as the USD recovered and US bond yields rose slightly again
- The market is waiting for the speech of the Fed officials later today, which is expected to be hawkish
Factors that pressured gold down
- DXY index rose again, putting pressure on gold prices, which are priced in USD
- US 10-year bond yields increased
- FED said it was not in a hurry to cut interest rates
- Money flows shifted to stocks
BITCOIN BUY SCALPBitcoin will be now head to the up side and correct itself a bit as it’s been selling buy now we can expect a short dip to buy

GBPNZD: Another Bullish Wave Coming 🇬🇧🇳🇿
GBPNZD respected a strong rising trend line on a daily.
The price formed a cup & handle pattern on that
and violated its horizontal neckline yesterday.
I think that another up movement is ahead.
Goal - 2.26
❤️Please, support my work with like, thank you!❤️

XAUUSDHello Traders! 👋
What are your thoughts on GOLD?
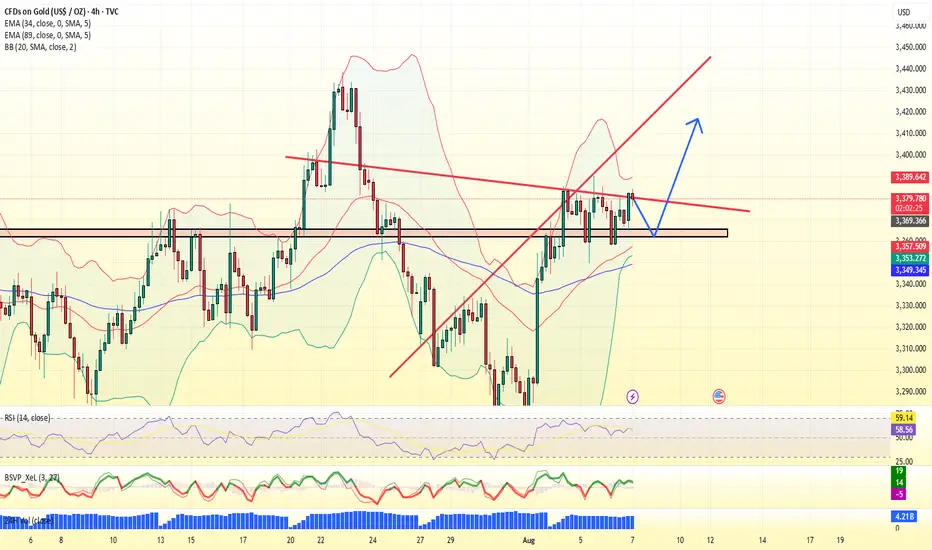
Gold remains trapped below the key $3,390–$3,400 resistance zone, which has rejected price multiple times in recent sessions.
A short-term pullback toward the marked support level is likely.
From that zone, we expect buyers to step in, leading to another bullish push toward the resistance, and this time, a potential breakout above the $3,400 level.
As long as the price stays above support, the bullish outlook remains intact.
A confirmed break above $3,400 could open the path toward new highs.
Don’t forget to like and share your thoughts in the comments! ❤️

Target Locked: USDCHF Buy Trade with High ConvictionHey Guys,
I'm planning a buy trade on USDCHF from the pullback zone between 0.80028 and 0.80625. My target level is 0.83390.
I'm quite optimistic about this setup. But remember—forex markets do what they want; we simply make educated guesses.
That’s why risk management is key. Protect your capital.
And one more thing: every single like from you is my biggest motivation to keep sharing analysis. Huge thanks to everyone supporting me!

Market Analysis: EUR/GBP Loses MomentumMarket Analysis: EUR/GBP Loses Momentum
EUR/GBP is consolidating and might aim for a fresh increase above 0.8700.
Important Takeaways for EUR/GBP Analysis Today
- EUR/GBP is trading in a positive zone above the 0.8665 pivot level.
- There is a short-term declining channel forming with resistance near 0.8705 on the hourly chart.
EUR/GBP Technical Analysis
On the hourly chart of EUR/GBP, the pair started a consolidation phase after it failed to surpass 0.8730. The Euro traded below the 0.8710 and 0.8700 support levels against the British Pound.
The EUR/GBP chart suggests that the pair even declined below the 23.6% Fib retracement level of the upward move from the 0.8605 swing low to the 0.8729 high. It is now consolidating losses and trading below the 50-hour simple moving average.
The pair is now facing resistance near the 0.8705 level. There is also a short-term declining channel forming with resistance near 0.8705.
The next major resistance could be 0.8730. The main resistance is near the 0.8750 zone. A close above the 0.8750 level might accelerate gains. In the stated case, the bulls may perhaps aim for a test of 0.8780. Any more gains might send the pair toward the 0.8800 level.
Immediate support sits near 0.8680. The next major support is near 0.8665 or the 50% Fib retracement level of the upward move from the 0.8605 swing low to the 0.8729 high.
A downside break below 0.8665 might call for more downsides. In the stated case, the pair could drop toward 0.8635.
This article represents the opinion of the Companies operating under the FXOpen brand only. It is not to be construed as an offer, solicitation, or recommendation with respect to products and services provided by the Companies operating under the FXOpen brand, nor is it to be considered financial advice.

Gold Price Setup – Potential Rejection & Long ScenariosPrice is currently consolidating below the H4 Supply Zone after rejecting the ascending trendline twice.
Two key scenarios are in focus:
✅ Scenario 1 – Deeper Pullback to Demand Zone
A retracement into the 1H + 30M Order Block (OB) and liquidity zone near 3,341–3,355 (marked with $$$) could attract buyers.
If bullish momentum confirms, look for a continuation toward 3,388 and possibly the upper trendline near 3,400+.
✅ Scenario 2 – Immediate Push Higher
If price holds above the moving average and fails to break below 3,355, bulls could step in earlier, driving price back to test the trendline resistance.
Breakout of the trendline could target the higher supply region.
🔍 Key Levels to Watch:
H4 Supply Zone (3,440 area) for potential reversal.
3,341 OB Zone for liquidity sweep and reaction.
Trendline Resistance capping the upside.

Every Like Is a Boost: This GBPUSD Analysis Is Just for You!Good morning, friends 🌞
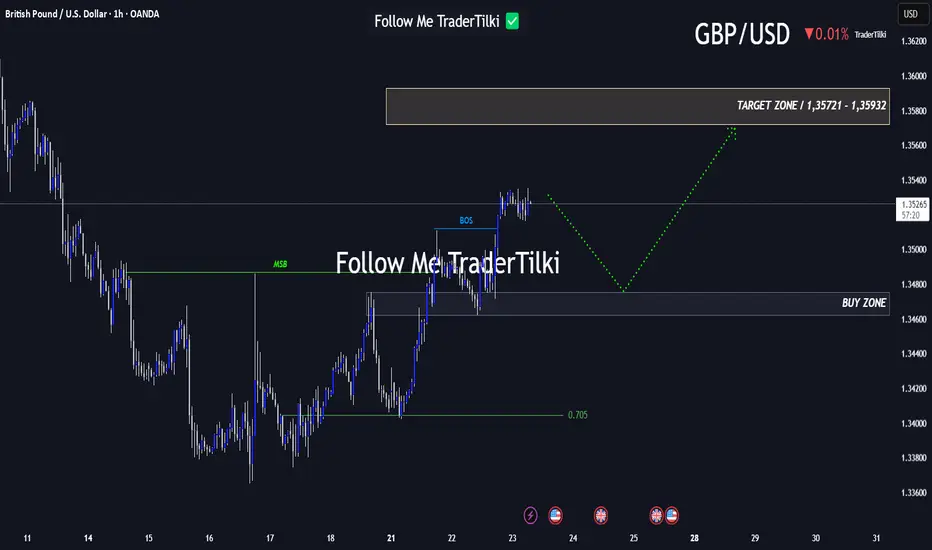
Due to the recent shift in GBPUSD’s market structure, I plan to enter a buy position when price reaches the 1.34753 – 1.34623 range.
Target levels: 1.35721 and 1.35932 📈
Every like you send fuels my motivation to share fresh analyses. Thank you to everyone who’s supporting this journey ❤️
USD may weaken in the futureExperts say the USD is still under pressure after the US economy announced a "shocking" non-farm payrolls report for July and revised the May and June figures down sharply compared to forecasts and previous figures.
Experts say the rapidly weakening job market is fueling speculation that the US Federal Reserve (Fed) will soon cut interest rates in September.
However, in the last session, the USD basically stopped falling sharply, when data on the US service and aggregate purchasing managers' indexes increased quite well in July. This has helped the USD not to fall too much.
The USD is expected to remain volatile when the US announces weekly employment on Thursday. Next week is the July consumer price index (CPI). This is an important indicator for the Fed to make a decision on interest rate policy at its meeting in September. This index will strongly affect the trend of the USD.

USD increased slightly and JPY decreased deeplyThe world USD price increased slightly. The USD-Index reached 98.79 points, 0.08 points higher than yesterday. According to CNBC, the USD increased in value compared to most currencies as the market focused on President Donald Trump's personnel nomination for the US Federal Reserve (Fed). Yesterday, President Donald Trump said he would soon announce decisions on replacing Governor Adriana Kugler, who resigned last Friday, including choosing the next Fed chair. Fed Chair Jerome Powell's term will end in May 2026.
Yesterday's report from the Institute for Supply Management said that the US non-manufacturing purchasing managers' index (PMI) in July fell to 50.1 from 50.8 in June. Economists polled by Reuters had forecast the services PMI would increase to 51.5. A PMI reading above 50 indicates growth in the services sector, which accounts for more than two-thirds of the economy. Investors are pricing in a high probability that the Fed will cut interest rates at its September meeting. Investment bank Goldman Sachs expects the Fed to deliver three consecutive 0.25% rate cuts starting in September...