GOLD (XAU/USD) Analysis – Head & Shoulders & Target📌 Overview:
Today’s GOLD market presented an excellent educational setup using the MMC (Market Maker Cycle) methodology. We identified a Head & Shoulder reversal pattern, volume contraction at a key zone, a Major Break of Structure (BOS), and finally, a clear shift in market structure leading to a strong bullish move.
Let’s break it down step-by-step:
🧠 1. Head & Shoulders Pattern – The Early Reversal Signal
The pattern started forming around May 26–28, a classic Head & Shoulders that signaled potential exhaustion of the downtrend:
Left Shoulder: Price attempted to rise but failed to break previous highs.
Head: Sellers pushed to form a deeper low, forming the head.
Right Shoulder: Buyers entered again at the previous demand, creating a higher low than the head—indicating weakening bearish momentum.
🟦 The neckline was drawn across the swing highs. Once broken, it confirmed the reversal.
📍Significance: This pattern formed inside a strong SR Interchange Zone, where support turned resistance and vice versa—adding confluence.
🛠 2. Major Break of Structure (BOS) – Confirmation of Trend Shift
After forming the right shoulder, price decisively broke above the neckline and previous highs—this was the Major Break of Structure (BOS).
This is critical in MMC because:
It signals the end of the accumulation or manipulation phase.
It confirms that smart money has taken control and is pushing price in the new direction.
BOS acts as an entry trigger for traders using structure-based strategies.
💥 A strong bullish candle closed above the BOS level, showing aggressive buying.
📉 3. Volume Contraction – Smart Money Behavior
Between May 31 and June 2, we observed a tight consolidation at the previous resistance zone (now support).
Volume was contracting, forming a compression zone—a common sign of liquidity buildup by institutional players.
🧠 Why is this important?
Low volume ranges typically lead to high-volume breakouts.
This is the “accumulation before expansion” phase.
Smart money often accumulates orders here before a major move.
When price broke out of this compression, it did so with high momentum—validating this theory.
🔄 4. Structure Shifting – New Bullish Market Cycle
Following the BOS and breakout from volume contraction, price aggressively shifted its structure:
Higher highs and higher lows started forming.
Price invalidated bearish order blocks and respected bullish zones.
A new bullish market cycle under MMC began unfolding.
🚀 Price is now headed toward the Next Reversal Zone (around $3,460–$3,470), where we expect significant reaction.
🔍 5. Key Levels Explained
🔵 SR Interchange (~$3,280): This acted as a strong base for the Head & Shoulder formation. A key demand zone if price retraces.
🟦 Volume Contraction Zone (~$3,330–$3,350): Launchpad for the bullish impulse.
🟥 Next Reversal Zone (~$3,460–$3,470): A likely profit-taking or short-term reversal zone. Watch for bearish setups or consolidation here.
🎯 Strategy Insights (Based on MMC)
Entry Opportunity: After BOS + Retest of neckline or volume contraction zone.
Risk Management: Stop loss just below the previous low or reversal zone.
Target Zones: Next Reversal Zone or Fibonacci extensions depending on strategy.
📈 Conclusion
This GOLD chart is a textbook example of how technical confluences create high-probability setups:
✅ Head & Shoulder at demand
✅ Break of structure confirms reversal
✅ Volume contraction signals smart money entry
✅ Bullish expansion shows structure shift
🔔 Final Thought:
Watch closely how price reacts around the Next Reversal Zone. If bearish price action appears, it may provide a short-term reversal or retracement trade. Otherwise, a clean break above could signal the continuation of the bullish leg.
Forextrading

When and How to Use Weekly Time Frame in Gold Forex Trading
Ignoring weekly time frame chart analysis could cost you big losses in Forex, Gold trading!
Discover 3 specific cases when weekly time frame beats daily time frame analysis.
Learn the situations when weekly timeframe exposes what daily charts can’t, how to analyze it properly and when to check it.
1. Long-term historic levels
When the market trades in a strong bullish or bearish trend and goes beyond recent historic levels, quite often the daily time frame will not be sufficient for the identification of significant supports and resistances.
The proven way to identify the next meaningful levels will be to analyze a weekly time frame.
Examine a price action on EURAUD forex pair on a daily time frame chart. The market is trading in a strong bullish trend and just updated the high.
Checking the historic price action, we don't see any historic resistance on the left.
Switching to a weekly time frame chart, we can easily recognize a historic resistance that the price respected 5 years ago.
That's a perfect example when weekly t.f revealed a historic price action that a daily didn't.
2. Trend-lines
Weekly time frame analysis is important not only for a search of historic levels. It can help you find significant vertical structures - the trend lines.
We can easily find several meaningful historic resistances on EURUSD pair on a daily time frame.
Though, there are a lot of historic structures there, let's check if there are some hidden structures on a weekly.
Weekly time frame reveals 2 important trend lines, one being a vertical support and another being a vertical resistance.
With a daily time frame analysis, these trend lines would be missed .
3. More accurate breakout confirmations
Some false support and resistance breakouts that you see on a daily could be easily avoided with a weekly time frame analysis.
Quite regularly, a daily time frame support or resistance is in fact a weekly structure. And for its breakout, a weekly candle close will provide more accurate confirmation.
From a daily time frame perspective, we see a confirmed breakout - a daily candle close above a solid resistance zone.
It provides a strong bullish signal on AUDUSD forex pair.
However, the violation turned out to be false and dropped.
Such a false breakout , could be easily avoided, checking a weekly time frame chart.
The underlined resistance is in fact a weekly structure.
The price did not manage to close above, and perfectly respected that, starting to fall after its test.
Such a deeper analysis would completely change our bias from strong bullish (based solely on a daily) to strongly bearish (based on a daily AND weekly)
Remember This
Do not ignore and always check a weekly time frame.
It shows a unique perspective on the market and reveals a lot of hidden elements that you would not notice.
No matter whether you are a scalper, day trader or swing trader,
remember that weekly time frame structures are very impactful and accumulate large trading volumes.
❤️Please, support my work with like, thank you!❤️
I am part of Trade Nation's Influencer program and receive a monthly fee for using their TradingView charts in my analysis.

Skeptic | GBP/USD Analysis: Breakout Triggers in the Box!Hey everyone, Skeptic here! FX:GBPUSD has been killing it with a solid uptrend but now it’s chilling in a correction phase, trapped in a box range. A break above or below this box could light up some epic triggers, so let’s dive into a multi-timeframe analysis to get the full picture.
🧠 Starting with the Daily Timeframe
we’re riding a powerful upward channel where price has been dancing perfectly with the ceiling, floor, and midline. We’ve nabbed some sweet trades from this setup before! After hitting resistance at 1.35576 , we slipped into a time-based correction.
Here’s the daily breakdown:
If the box floor at 1.35002 cracks, we could slide to 1.34173 , hitting the 0.382 Fibonacci retracement— a legit first support zone. 🎯
If we bust through the ceiling, the channel’s midline is our next target. But with lower highs forming, I’m betting on a deeper correction for now. 📉
With that intel, let’s zoom into the 4-Hour Timeframe for our main long and short triggers. 🔥
For longs, a break above 1.35576 is our golden ticket, with a stop loss below the box. Want a quicker R/R and early profits? Set a tighter stop below the 1H or 15-minute floor that forms. 💸 For shorts, we can play with a smaller stop loss. I’d jump in after breaking support at 1.35002 , with a stop loss at 1.35464 if we go bearish from here. If we test the box ceiling again before breaking the floor, the stop loss sits above the box. 🚨 Heads-up: longs are riskier based on the daily clues. As always, do your own research, steer clear of FOMO, and never forget—capital management and stop losses are your market lifelines. Nobody shouts about those enough! A single trade, good or bad, won’t make or break your long-term game, so skip the emotional drama and grind on your strategy and psychology.
💬 Let’s Talk!
If this recap got your gears turning, smash that boost—it means a lot! 😊 Got a pair or setup you want me to tackle next? Drop it in the comments. Thanks for vibing with me—keep trading sharp! ✌️

BEST XAUUSD M30 SELL SETUPNFOR TODAY 📉 Gold Analysis Summary – Bearish Setup Alert ⚠️
Gold is currently showing signs of weakness after a strong bullish push. A Change of Character (CHOCH) has confirmed a potential shift in trend. Price is approaching a supply zone (highlighted in purple), and rejection from this level could trigger a downward move. 🔄 The projected path suggests a potential lower high formation, followed by a drop towards the 3,348 and 3,331 key demand levels. 🧠 Watch for bearish confirmation near resistance before entering short positions. 📊💥

XAU/USD Weekly Forecast : First LONG, then SHORT! (READ CAPTION)By examining the gold chart on the 4-hour timeframe, we can see that after dropping to $3270, the price faced strong buying pressure and opened today’s session with a 100-pip gap at $3298, continuing its rally up to $3370. This bullish move could potentially extend toward $3400, but keep in mind that gold is likely to retrace soon to fill this price gap — so this scenario should definitely be considered!

Market next move Disruption of the Downtrend Analysis
The chart currently suggests a bearish breakout with a downside target near 1.12900. Let’s challenge that:
---
🟩 Bullish Reversal Possibility
1. Support Zone Near 1.1370:
Price has shown signs of stabilizing around the 1.1370 level.
Multiple wicks below the candles suggest buyer interest at this level.
2. Low Volume on Recent Red Candles:
A decreasing volume trend on recent red candles can indicate weak bearish momentum.
Bulls may be waiting to enter on a breakout above the 1.1380–1.1390 zone.
3. Potential for Fakeout:
The sharp expected drop might be a bear trap.
If price breaks back above 1.1385 with strong volume, it could invalidate the bearish thesis.
4. RSI/Momentum Divergence (Assumed):
If momentum indicators (not shown) display bullish divergence, this strengthens the case for a reversal
GBPJPYGBPJPY price has a chance to test the support zone 192.349-192.002. If the price cannot break through the 192.002 level, it is expected that in the short term, there is a chance that the price will rebound. Consider buying the red zone.
🔥Trading futures, forex, CFDs and stocks carries a risk of loss.
Please consider carefully whether such trading is suitable for you.
>>GooD Luck 😊
❤️ Like and subscribe to never miss a new idea!

Market next move ⚠️ Disruption of the Bullish Analysis:
1. Weak Support Zone
The highlighted support area is not strongly tested (only a couple of candles touch it).
Low volume around support may indicate lack of buying interest at that level.
If price breaks below this support, the bullish setup becomes invalid.
2. Bearish Volume Spike
There's a noticeable high volume red candle during the recent drop.
This could imply strong selling pressure, not just profit-taking.
Rising volume on red candles often precedes further downside.
3. Lower High Formation
The price may create a lower high near the projected bounce zone.
If that happens, the market structure would shift to bearish.
A lower high and a break below support confirms a downtrend.
Market next move 🔻 Disruptive Bearish Analysis:
🧱 1. Failed Breakout Attempt
Price is hovering at resistance but showing indecisive candles (small bodies, wicks on both sides).
This hints at buyer exhaustion rather than breakout momentum.
📉 2. Bearish Divergence (Possible)
If momentum indicators (e.g., RSI or MACD—not shown here) are diverging from price, it could signal a reversal.
Price rising while momentum flattens or drops suggests a fakeout is likely.
🕳️ 3. Liquidity Grab Trap
The chart may show a classic “bull trap”:
Price broke resistance briefly but quickly fell back.
This signals institutional liquidity grab, possibly before a downward push.
🔽 4. Volume Imbalance
The spike in volume earlier may be followed by decreasing bullish volume, indicating weak follow-through.
Sellers could take over if bulls can’t sustain pressure.

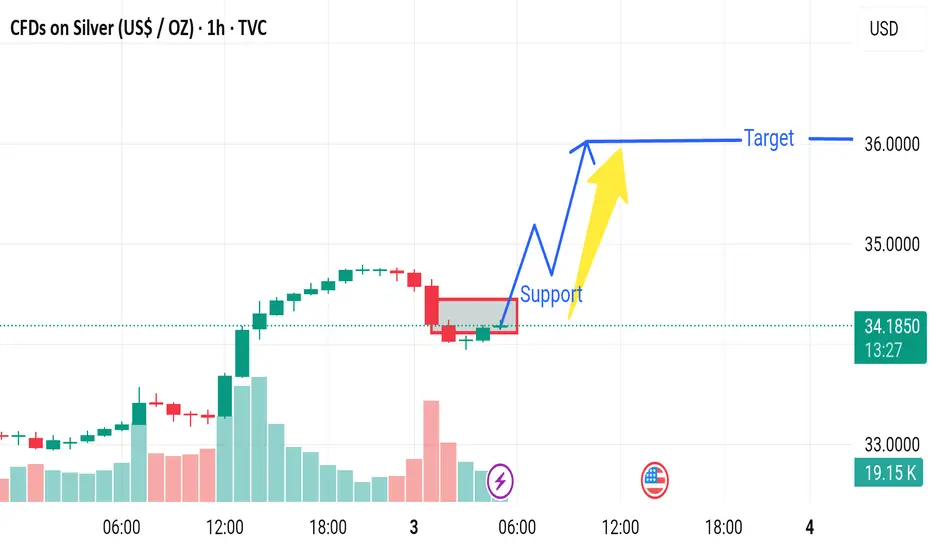
Market next target 🟢 Disruptive Bullish Scenario:
🔁 1. Healthy Bull Flag or Consolidation
The steep rally (+4.5%) may not lead to a breakdown.
The current pause near $34.50 could be a bull flag or tight range consolidation, common in continuation patterns.
🔼 2. Volume Supports the Move
Notice the strong rising volume on the breakout candles.
This shows genuine buyer interest, not a pump-and-dump move.
🧲 3. Breakout Holding Above Previous Highs
Price is holding above previous resistance, which now acts as support around $34.00–$34.20.
Holding this zone can lead to a retest and breakout to new highs.
📈 4. Strong Macro Bullish Catalyst
The U.S. event icon suggests important data is near.
If the data (like weaker dollar or inflation concerns) supports metals, Silver could surge further rather than drop.
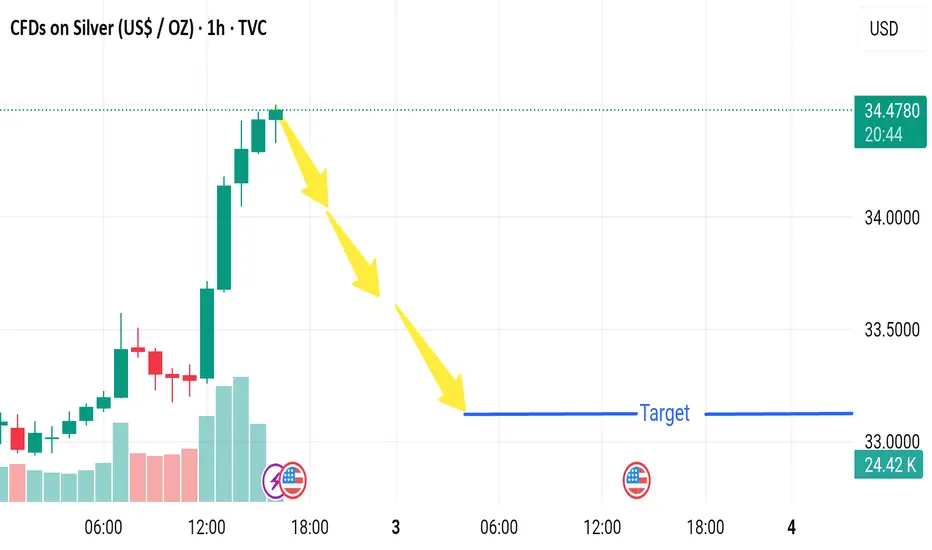
Market next move 🔻 1. False Breakout Risk
Price is hovering right at the resistance-turned-support zone.
The candles above this zone have long upper wicks, signaling rejection and selling pressure.
This may be a bull trap before reversal.
---
📉 2. Decreasing Bull Volume
Volume peaked earlier, but the most recent green candles are showing lower volume, suggesting weakening bullish momentum.
Lack of strong follow-through volume often precedes reversals.
---
🕳️ 3. Overextended Rally
Gold has moved sharply upward recently (over +2.5%).
There may be a need for a cooldown or retracement, especially if no fresh catalysts emerge.
---
⚠️ 4. Macro Factors Unpriced
The chart includes a U.S. event icon, likely representing upcoming economic data (e.g., Fed comments, job reports).
Any hawkish surprise (rate hike concerns, strong jobs report) could cause a sharp reversal in gold due to rising yields and a stronger USD.

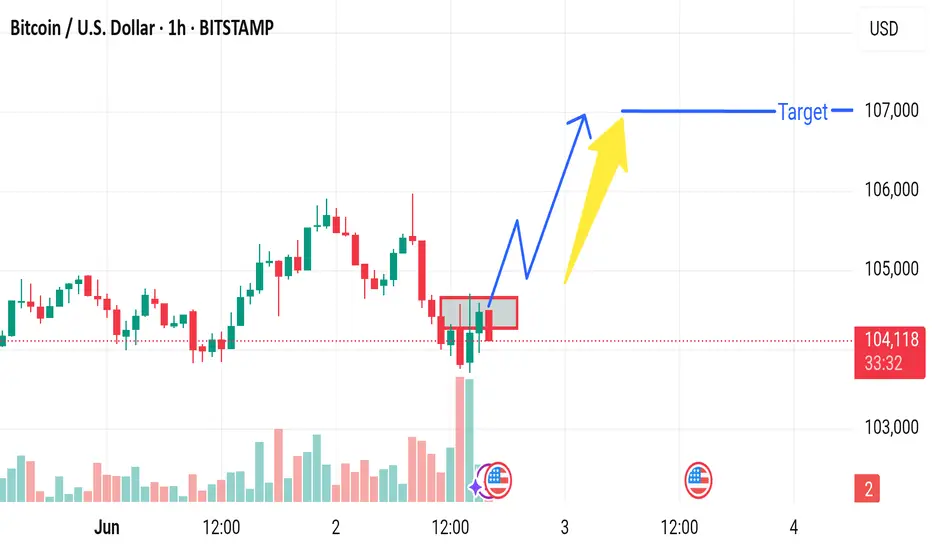
Market next target 🟢 1. Strong Support Zone Nearby
The region around $103,500–$104,000 has acted as a strong demand zone historically (look left).
BTC might bounce from this level instead of continuing the downtrend.
---
🔄 2. Consolidation, Not Breakdown
The price action appears more sideways/choppy than strongly bearish.
Without a clean breakdown candle below key support, this might be accumulation, not distribution.
---
📉 3. Bearish Momentum Weakness
Volume on the recent red candles is not significantly increasing.
This implies lack of strong conviction from sellers.

Market next move 1. Bearish Rejection Zone
The red box highlights a consolidation/resistance zone.
BTC is struggling to break and close above this area.
Multiple candle wicks into the zone suggest seller strength.
---
📉 2. Volume Weakness
The recent upward candles show lower volume compared to the selling candles before it.
This indicates that the buying pressure may be weak, lacking momentum for a breakout.
---
🕳️ 3. False Breakout Trap Risk
A fakeout above the resistance box is possible if big players trigger buy orders and then reverse the market, trapping retail traders.
---
🟠 4. Bearish Divergence (if confirmed by RSI or MACD)
Without indicators shown, if momentum indicators like RSI/MACD display divergence (price up but momentum down), it’s a bearish signal.
Market next move 🔄 Disruptive Bullish Scenario Analysis
1. Oversold Conditions & Possible Reversal
The current price at 143.028 shows an aggressive drop.
This could indicate the pair is entering oversold territory on lower timeframes (not visible here but common post-drop).
If confirmed with RSI or stochastic indicators, a reversal or retracement could be imminent before reaching the 141.000 target.
2. Demand Zone at 142.500–142.000
Historically, this area (near 142.5–142.0) may act as a support zone.
Buyers could step in here, especially if fundamentals (e.g., U.S. data releases or BOJ comments) support dollar strength.
3. Volume Divergence
Declining selling volume despite price falling (visible from lower red bars) may hint at weakening bearish momentum.
This divergence often precedes a bullish correction or range formation.
4. False Breakdown Possibility
The sharp projection to 141.000 could trigger stop hunts.
After trapping breakout sellers, price may sharply rebound to retest 143.500–144.000 zones.

USDJPY Forecast for NFP Week | Price at a Critical Turning PointIn this video, I’m diving into the USDJPY setup ahead of a high-impact week filled with major economic news like the NFP, ADP Employment, and speeches from the BoJ Governor.
We’ll walk through the technical zones I’m watching, discuss potential buyer and seller reactions, and outline the key catalysts that could move the market.
🔔 Don’t forget to like the video in support of my work.
Disclaimer:
Based on experience and what I see on the charts, this is my take. It’s not financial advice—always do your research and consult a licensed advisor before trading.
#USDJPY #ForexForecast #NFPWeek #ForexMentor #TechnicalAnalysis #ForexTrading #BoJ #TradeSetups #PriceAction #MarketBreakdown

Market next target 🔍 Original Analysis Summary:
Bearish Outlook: Price is expected to decline from the recent high.
Support Level: Identified near 1.34400.
Target Zone: Around 1.34200 based on breakdown expectations.
Reasoning: Possibly based on rejection near resistance and anticipation of bearish follow-through.
---
⚠️ Disruption (Bullish/Neutral Counter-Scenario):
1. Strong Bullish Candle at Resistance
The last candle is a bullish engulfing near recent highs, indicating buyer strength.
Rather than rejecting, price appears to break out of consolidation.
---
2. Volume Supporting Bullish Momentum
Increasing green volume bars show accumulating demand, not weakness.
Could imply a liquidity grab before a bullish continuation.
---
3. Failed Breakdown Attempts
Price has attempted to fall multiple times (wicks downward), but was bought up quickly.
That often signals trap setups where short sellers are being baited.
---
4. Macro Sentiment / USD Weakness Risk
With upcoming U.S. economic news (red circle), any sign of a weaker USD could invalidate the bearish scenario entirely.
GBP tends to benefit from any shift in U.S. interest rate expectations or economic softness.

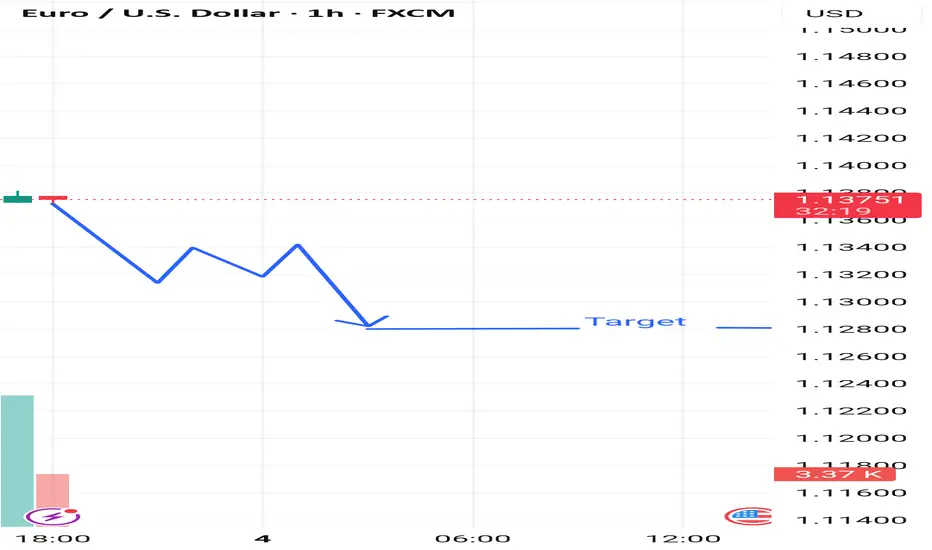
Market next move 🔍 Original Analysis Summary:
Bearish Setup: Price is expected to break down from the small consolidation area (highlighted in red box).
Projection: A drop toward the lower target zone (~1.13200–1.13300).
Trigger: Likely based on rejection from minor resistance and upcoming U.S. economic data (flag icons).
---
⚠️ Disruption (Bullish/Neutral Counter-View):
1. Support Holding Firm
The price has tested the red box area multiple times without a clear breakdown.
This could signal strong demand/support around 1.13600, invalidating the bearish momentum.
---
2. Volume Spike on Bullish Candles
Notable bullish volume spikes suggest buyers are stepping in at current levels, defending support.
---
3. Potential Bullish Reversal Pattern
The red box resembles a bullish flag or rectangle, often a continuation pattern — not necessarily a bearish signal.
If price breaks above 1.13700, it may trigger buy stop orders, fueling a rally.
---
4. Favorable Euro Fundamentals
The eurozone flag icon suggests EU news is also pending. If this is hawkish or better than expected, EUR/USD could rally sharply, invalidating the bearish outlook.

Market next target 🔍 Original Analysis Summary:
Bullish Continuation is expected.
Price is projected to rise with a series of higher highs (yellow arrows).
Target area is marked above 34.000 USD.
---
⚠️ Disruption (Bearish/Neutral Counter-View):
1. Flat Consolidation Zone = Distribution Risk
Price has been moving sideways in a tight range (approx. 32.90–33.15), indicating indecision.
This could be a distribution phase, where smart money sells into retail bullishness.
---
2. Weak Volume Profile
Volume is relatively low and not increasing with attempted bullish moves.
A strong breakout should be backed by volume, but current price action lacks conviction.
---
3. False Breakout Trap Risk
Price is testing the upper boundary of a range.
A small push higher could be a bull trap, especially if it reverses back inside the range — a common fake-out setup.

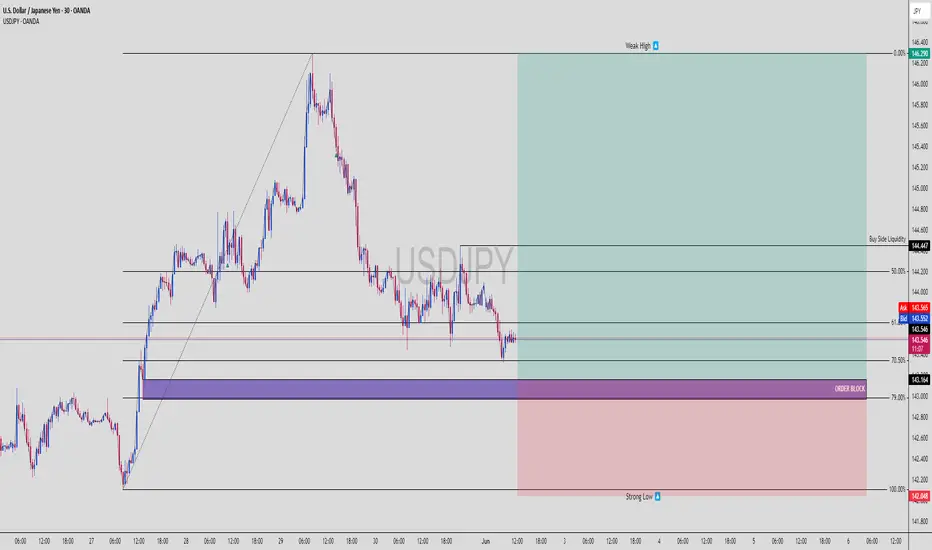
USDJPY Ready to Bounce – Sniper Long from Smart Money OBUSDJPY | 30-Min Bullish Setup – Premium to Discount + Order Block Reaction
USDJPY looks primed for a bullish reversal from a smart money perspective. Let’s walk through why this setup could be the cleanest long of the week 📈🧠
📌 1. Current Market Narrative:
Price retraced deep into discount levels (beyond 70.5%) after a strong bullish leg
Tapped into a refined bullish Order Block (OB) sitting just above a strong low
Multiple liquidity grabs have already occurred, leaving internal structure vulnerable to a reversal
Smart money has likely accumulated below recent lows… ready to pump toward Buy Side Liquidity 🧲
🧠 2. Key Technical Levels:
✅ Order Block Zone (Entry): 143.164
🔻 Strong Low: 142.048 (protected)
🟢 Buy Side Liquidity Target: 144.447
🔼 Weak High (Magnet): 146.290
Entry Point: Within OB (143.1–143.2)
TP Zones: 144.447 (main), 146.290 (stretch target)
SL: Below OB – around 142.048
RR: ~1:4+ — sniper grade 🥷
📊 3. Smart Money Flow:
OB aligned with 70.5–79% Fibonacci discount zone (deep retrace = strong reaction)
Structure shows signs of exhaustion on the sell side
Price may now reverse with displacement toward upside inefficiencies
Buyers likely stepping in aggressively from this level
🚀 4. Execution Plan (LTF Confirmation Entry):
✅ Wait for:
M5–M15 BOS (bullish break of structure)
FVG or mitigation entry confirmation
Maintain tight SL below OB (2–3 pips buffer)
Bonus: If price holds above 143.2 with strong M5 bullish candle close, that’s go-time for smart money longs.
🧨 5. Why This Setup is 🔥:
High probability bounce zone (OB + deep fib retrace)
Clean RR structure with solid target at buy side liquidity
Market structure shift likely as lower highs start breaking
Liquidity swept under recent lows = trap complete
This is the kind of setup that institutional algos are coded to exploit 🤖
💬 Type “USDJPY Long Sniper 🥷💴” in the comments if you’re in this setup too
🔁 Save this for trade journaling or future backtest
📊 Follow @ChartNinjas88 for smart money plays every day!
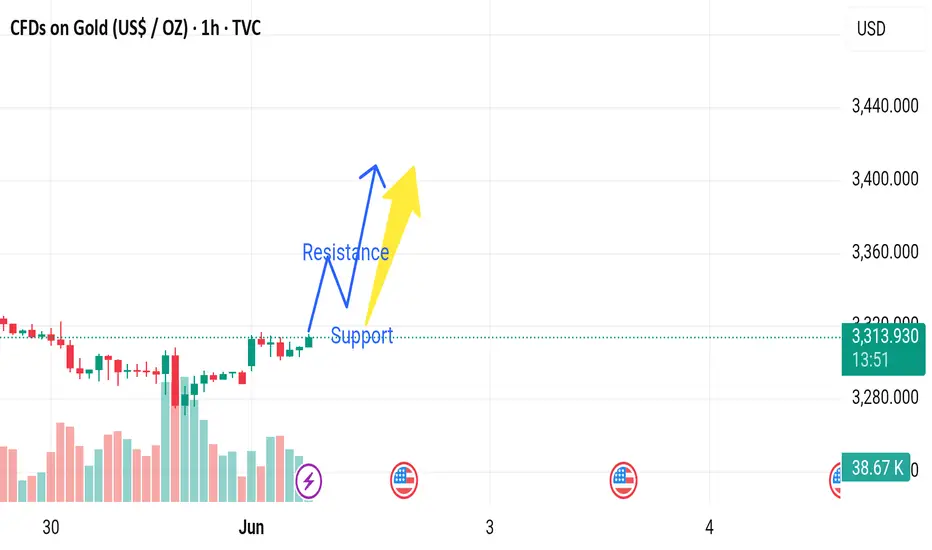
Market next move 🔍 Original Analysis Summary:
Bullish Bias: The analysis suggests a breakout above the current level, with price bouncing off "support" and targeting higher levels beyond the marked "resistance."
Expectation: Higher highs post-breakout.
---
⚠️ Disruption (Bearish/Neutral Counter-View):
1. Low Volume on Recent Push
Recent bullish candles have declining volume, signaling potential weak buying pressure.
This divergence could imply that buyers are losing interest or that the rally is unsustainable.
2. Flat Resistance Zone
The price is struggling to break above the 3,315–3,320 level, suggesting strong selling pressure.
Multiple rejections at the same level could form a double top, a bearish reversal pattern.
3. Lower Highs from May 30 Peak
While the price is rising, it's still below the highs made on May 30, indicating the uptrend might be weakening.
4. Bearish Divergence (Hypothetical)
If RSI or MACD were plotted, a bearish divergence (price rising, but momentum indicators falling) might be present — often a precursor to a reversal.
5. Fundamental Risk: U.S. Data (Flagged)
The U.S. flag icon signals upcoming economic news. If positive, it could strengthen the USD, pushing gold lower.
Volatility around this time might invalidate the bullish setup.
EURUSDHello Traders! 👋
What are your thoughts on EURUSD?
EURUSD is still trading below a key resistance zone, showing signs of weakness and lack of strong bullish momentum. At this stage, it seems unlikely that the pair will break above the resistance in the short term.
We expect a downward correction toward the specified support levels, before any potential resumption of the uptrend.
Despite short-term weakness, our long-term outlook remains bullish, and this pullback could offer a better entry opportunity in line with the broader trend.
Don’t forget to like and share your thoughts in the comments! ❤️

JPYUSD Weekly Analysis (MMC) – Smart Structure & Target Zones🧠 Market Sentiment & Technical Landscape
The JPYUSD currency pair has entered a decisive phase in its multi-week bullish run, driven by structural integrity, smart money behavior, and market psychology. This chart captures a strategic trade progression using the Mind Market Concept (MMC) approach — a hybrid strategy blending curve dynamics, volume imprints, and structural flow to track institutional intent.
We're seeing a powerful alignment of structure, momentum, and volume signals, all pointing to a potential high-probability completion near the upper target/reversal zone.
🔍 In-Depth Technical Breakdown
🔹 1. Curve Support Foundation – The Psychological Bedrock
At the heart of this bullish move lies the Black Mind Curve Support — a dynamic, rounded trendline support based on momentum cycles and structural lows. This curve is not arbitrary; it’s a reflection of where smart money has repeatedly absorbed sell-side liquidity before marking up the price.
Multiple rejections from this zone around 0.00640 – 0.00650 provided confirmation of intent.
The rounded nature of this curve support mimics market accumulation patterns — think of it as a “loading zone” before explosive movement.
🔹 2. Structural Breakout – A Clean Bullish Sequence
Price respected a multi-month resistance line and finally broke out in April–May 2025. The breakout wasn't just technical — it occurred after:
A liquidity sweep below the February-March higher low
A retest of the curve
A sharp bullish engulfing formation on the weekly chart
This combination confirms a high-confidence shift in market structure — transitioning from ranging accumulation to directional markup.
🔹 3. Volume Imprints – Institutional Footprints
The chart highlights a Needed Volume area — this is where previous institutional order blocks likely existed. The strong bullish move into that zone confirms:
Buyers were active and aggressive
The area served as both resistance and a breakout retest
This volume footprint now acts as a supportive launchpad, reaffirming trend continuation logic.
🔹 4. Target + Next Reversal Zone
As price continues climbing, it’s now approaching a critical confluence zone around 0.00720 – 0.00725. This zone is projected using:
Fibonacci extension of the last impulse
Measured move symmetry
Historical supply and resistance (Q3 2024 highs)
This is not just a target — it’s a high-probability reversal area. Expect:
Potential exhaustion candles
Momentum divergence
Institutional profit-taking
📊 MMC Strategy Approach – Trade Blueprint
Parameter Detail
Bias Bullish (until reversal confirmation)
Current Price ~0.00694
Buy Zone 0.00685–0.00690 (pullback entry)
Target Zone 0.00720–0.00725
Curve Support 0.00650–0.00660
Invalidation Clean break below curve or engulfing bear momentum
This MMC-based setup emphasizes patience, psychological precision, and proper confirmation for both entry and exit. The idea is to buy smart (on structure), and exit smarter (at institutional interest zones).
⚠️ Key Trader Insights
Don’t chase — wait for clean entry signals near structure (curve or trendline retest).
Use volume confirmation — don’t trade against low-volume rejections at resistance.
Watch emotional extremes — FOMO at targets often precedes reversal.
Plan for both scenarios:
Continuation → scale partial profits at target
Reversal → shift bias if bearish confirmation aligns with momentum loss
🔖 Summary Outlook
✅ Trend: Bullish continuation, respecting structure
🎯 Immediate Focus: Reaching the 0.0072 Target + Next Reversal Zone
🔄 Actionable Tip: Monitor for rejection/absorption candles in the upper blue zone
💼 Risk Management: Use curve break or engulfing reversal as an exit trigger
This setup reflects high technical confluence and fits into a longer-term institutional roadmap. Whether you're swing trading or intraday scaling within this wave — the logic remains powerful.

NZDUSD: Move Up Ahead 🇳🇿🇺🇸
Thursday's and Friday's sessions were bullish on NZDUSD.
After a test of a rising trend line, the price formed
a double bottom pattern on a 4H time frame and violated its neckline.
I think that the pair may rise next week and reach at least 0.6 level.
❤️Please, support my work with like, thank you!❤️
I am part of Trade Nation's Influencer program and receive a monthly fee for using their TradingView charts in my analysis.
