Market next move
1. Potential Bear Trap Scenario
Observation: The highlighted consolidation area could be a support zone.
Disruption: If the price quickly reclaims and holds above this zone (around 3,292), it could be a bear trap. This might attract buyers looking for a false breakdown reversal.
Implication: This could lead to a short-term rally instead of continuation lower.
---
2. Volume Divergence
Observation: Despite the breakdown, the selling volume seems to taper off compared to the previous heavy down move.
Disruption: Lower volume on a breakdown can signal weakening bearish momentum. Price might consolidate or even reverse.
Implication: Watch for bullish volume spikes as a sign of reversal interest.
---
3. Oversold RSI or Momentum Indicators
Disruption: If momentum indicators like RSI (not visible on this chart) show oversold conditions, this may suggest a relief bounce is more likely than further immediate downside.
Implication: Short-term traders could get trapped if they short too late.
---
4. Fundamental Triggers
Disruption: Any sudden positive news for gold (e.g. economic uncertainty, lower bond yields, central bank demand) can reverse this technical setup quickly.
Implication: Be cautious trading solely on technicals in sensitive markets like gold.
Forextrading

Analysing the Volatility Spike on the USD/JPY ChartAnalysing the Volatility Spike on the USD/JPY Chart
The USD/JPY chart offers plenty of noteworthy insights for analysis:
→ A one-month low was recorded today (marked by the arrow);
→ This was followed by a sharp upward reversal, with a series of large bullish candlesticks forming on the intraday chart.
Why Is USD/JPY Moving Sharply Today?
The primary driver appears to be recent statements from Bank of Japan Governor Kazuo Ueda.
According to Trading Economics, this morning Ueda:
→ warned of rising core inflation risks linked to increasing food prices;
→ indicated that the Bank of Japan is prepared to adjust its monetary policy in order to achieve a stable inflation target.
Latest data show that Japan’s core inflation unexpectedly rose to 3.5% — the highest level in two years — reinforcing the case for further rate hikes. However, what's particularly striking is that despite Ueda’s hawkish tone, the yen is weakening.
Technical Analysis of the USD/JPY Chart
Yen fluctuations formed a downward trajectory (marked in orange) in the second half of May, partly driven by US dollar weakness. Following a period of relative calm, the market has shifted into high gear — the ATR indicator is climbing sharply from multi-month lows, breaking through resistance at the 143.0 level.
This aggressive price action on the USD/JPY chart today suggests we may be witnessing an attempted bullish breakout from the channel. In light of this, it is possible that the surge in volatility reflects a fundamental shift in market sentiment — one that could potentially lead to the development of an upward trend.
This article represents the opinion of the Companies operating under the FXOpen brand only. It is not to be construed as an offer, solicitation, or recommendation with respect to products and services provided by the Companies operating under the FXOpen brand, nor is it to be considered financial advice.

MarketBreakdown | USDJPY, US100, BITCOIN, GBPJPY
Here are the updates & outlook for multiple instruments in my watch list.
1️⃣ #USDJPY 4H time frame 🇺🇸🇯🇵
I see a strong bullish reaction to a key daily/intraday horizontal support.
A formation of a high momentum bullish candle and a violation of a resistance line
of a bullish flag indicate a highly probable rise to higher levels.
2️⃣ #US100 #NASDAQ Index 4H time frame
I spotted one more bullish flag on US100.
Its resistance was violated yesterday and we already see
a strong buying interest.
I think that the market will rise more, at least to a current local high.
3️⃣ #BITCOIN #BTCUSD daily time frame
The price nicely respected a confluence zone based on
a rising trend line and a recently broken horizontal structure.
Probabilities will be high that the market will continue rising from that.
4️⃣ #GBPJPY daily time frame 🇬🇧🇯🇵
The price nicely respected a solid rising trend line.
I see a breakout attempt of a minor daily horizontal resistance.
IF a daily candle closes above that, it will provide a strong bullish confirmation.
Do you agree with my market breakdown?
❤️Please, support my work with like, thank you!❤️
I am part of Trade Nation's Influencer program and receive a monthly fee for using their TradingView charts in my analysis.

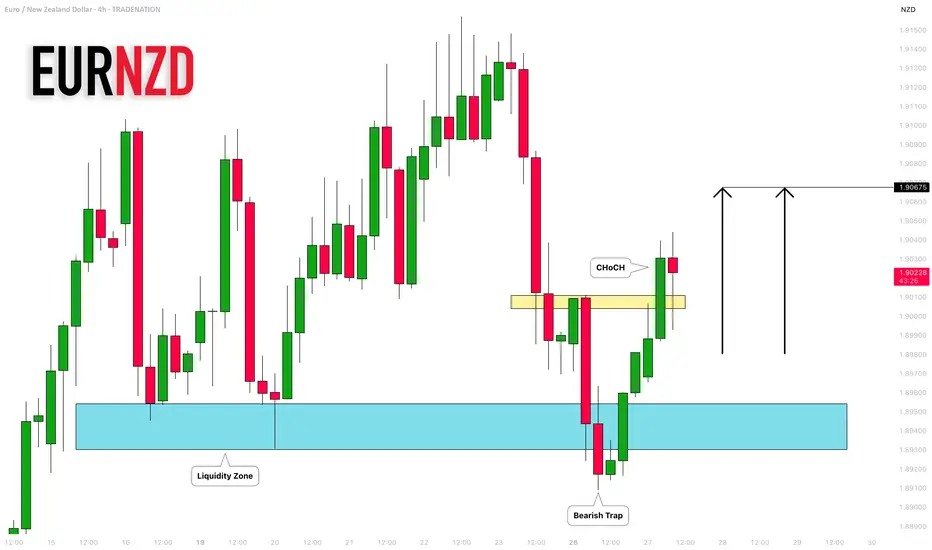
EURNZD: False Breakout & Bullish Movement 🇪🇺🇳🇿
I think that EURNZD may rise today after
a confirmed bearish trap and a bullish CHoCH.
Next resistance - 1.90675
❤️Please, support my work with like, thank you!❤️
I am part of Trade Nation's Influencer program and receive a monthly fee for using their TradingView charts in my analysis.
XAUUSD ALERT TODAYHere it is - Gold has started to fall. The price formed a descending channel pattern, bounced off the upper trendline, and broke the short-term uptrend. Parabolic SAR indicates the beginning of the decline, and MACD confirms the decline. There is also Imbalance at the bottom.
🔽 We consider selling #XAUUSD only on consolidation below 3305;
🎯 Target: 3250.

EUR/NZD Short and CAD/JPY ShortEUR/NZD Short
Minimum entry requirements:
• If tight non-structured 5 min continuation forms, reduced risk entry on the break of it.
• If tight structured 5 min continuation forms, reduced risk entry on the break of it or 5 min risk entry within it.
• If tight non-structured 15 min continuation forms, 5 min risk entry within it if the continuation is structured on the 5 min chart or reduced risk entry on the break of it.
• If tight structured 15 min continuation forms, reduced risk entry on the break of it or 15 min risk entry within it.
CAD/JPY Short
Minimum entry requirements:
• Tap into area of value.
• 1H impulse down below area of value.
• If tight non-structured 5 min continuation follows, reduced risk entry on the break of it.
• If tight structured 5 min continuation follows, reduced risk entry on the break of it or 5 min risk entry within it.
• If tight non-structured 15 min continuation follows, 5 min risk entry within it if the continuation is structured on the 5 min chart or reduced risk entry on the break of it.
• If tight structured 15 min continuation follows, reduced risk entry on the break of it or 15 min risk entry within it.

Market next target ---
Bearish Disruption Analysis
1. False Breakout Zone (Red Box Area):
The price is revisiting the red box area (potential supply/resistance zone). If it fails to break and close above this zone convincingly, it may signal a bull trap.
Previous attempts to push higher were rejected around this level, showing seller strength.
2. Lower High Formation Risk:
The recent upward move might form a lower high compared to the high from the 25th.
If price reverses below $33.30–$33.20, it could trigger more downside momentum, potentially targeting the $33.00 or even $32.80 level.
3. Volume Divergence:
Notice the decline in volume as price attempts to rise. Lower buying volume may indicate weak bullish conviction, which increases the risk of a downturn.
4. Bearish Candlestick Reversal Pattern:
If any bearish engulfing or shooting star candlestick forms near resistance, it would support a bearish reversal case.

Market next move Original Analysis Summary:
The chart shows a support area around the 3340 USD level.
There are two bullish scenarios outlined with blue and yellow arrows, implying a price increase from the support zone.
---
Disruption/Critical Analysis:
1. Overreliance on Short-Term Support:
The chart assumes the marked support area will hold, but no confirmation (like a bullish candlestick pattern or strong buying volume) is evident yet. A break below that zone could lead to a bearish move instead.
2. Volume Weakness:
Recent candles near the support zone are not backed by significantly increasing volume. This suggests weak buying interest, making the bullish forecast potentially over-optimistic.
3. No Consideration of Macroeconomic Events:
The chart doesn't factor in fundamental drivers (like U.S. economic data, Fed announcements), which can easily invalidate technical patterns.

Market next move
Disruption of the Bullish Bias:
1. False Breakout Risk
The area marked with a red rectangle might be showing signs of consolidation, but there's a possibility that the bullish breakout is a bull trap.
Volume does not strongly confirm a breakout; note that the volume on the recent upward candles is not significantly higher than the surrounding bars — often a sign of weak buyer conviction.
2. Resistance Overhead
BTC is approaching the psychological level of 110,000, which may act as resistance.
Price action shows several small-bodied candles with wicks, indicating indecision or rejection from higher levels.
3. Bearish Divergence Potential
If paired with RSI or MACD indicators (not visible in this image), there might be signs of bearish divergence — price making higher highs while the indicator makes lower highs.
4. Liquidity Sweep Scenario
The recent wick into the highlighted zone could be a liquidity sweep — grabbing stop-losses before reversing downward.
This would support a bearish move contrary to the bullish forecast.
5. Market Sentiment & Fundamentals
Ignoring macro events such as Fed decisions, ETF movements, or regulatory news can be dangerous. If bearish news breaks out, technical setups can fail fast

Why EUR vs GBP Could Be Your Best Trade This Week!When it comes to forex swing trading or even forex intraday trading, the temptation to zoom into lower timeframes—like the 15-minute or 1-hour charts—is strong. Most forex traders focus on short-term momentum, often diving into scalping strategies that chase quick pips. However, the real edge lies where most don’t look: the higher timeframes, particularly the weekly chart. The EUR/GBP forex pair is a perfect example of these higher timeframes' power, especially when paired with smart money concepts like demand and supply imbalances.
EUR/GBP: A Hidden Gem for Forex Swing Traders
The EUR/GBP Forex cross pair is often overlooked compared to major USD-based pairs. However, for seasoned swing traders and institutional players, EUR/GBP offers deep liquidity, cleaner technical analysis and price action structures, and strong reaction zones that are respected time and time again.
At the end of May 2025, a significant weekly demand imbalance at 0.8384 finally took control of price action—something smart money traders had been anticipating for months. This wasn't a surprise for those watching the higher timeframes. Similar to how the previous weekly imbalance at 0.8299 took control in February 2025, these zones have proven critical in guiding the medium- to long-term direction of EUR/GBP.

GBPAUD: Bullish Bias Remains 🇬🇧🇦🇺
I already shared a confirmed bullish breakout of a falling trend line on a daily.
Though the price went a bit lower, below that after its retest,
we have a significant horizontal support cluster that strongly holds.
I think that the price may start rising from that and reach
2.1 level this week.
❤️Please, support my work with like, thank you!❤️
I am part of Trade Nation's Influencer program and receive a monthly fee for using their TradingView charts in my analysis.

VIEW: EURUSD-Cut your losses short and let your winners run.
-The market is a device for transferring money from the impatient to the patient.
-In investing, what is comfortable is rarely profitable.
-Trade what you see, not what you think.
CONFIRMATION
-Price is bullish
-Strong order block
-BOS
-Liquidity sweep
-FVG filled
-Price retraced
NB: Do not ever compare yourself to other traders. Take regular breaks from trading Maintain a trading journal Love your craft Learn from other successful traders.

Market next target Original Analysis Summary:
Support Area Identified: Around 3335.
Expected Scenario: Bounce from support leading to a bullish move toward the "Target" zone.
Two Paths Shown: A direct bounce (yellow) or a fakeout/drop below support followed by a bullish reversal (blue arrow).
---
Disruption Analysis: Bearish Scenario
1. Support Breakdown:
Instead of bouncing at the support area (~3335), the price fails to hold and breaks down below.
Increased volume or bearish momentum could lead to this breakdown.
2. New Target Zone:
If support is broken, the next key demand zone may lie around 3300 or below, making that the new target.
Traders expecting a bounce may get trapped (bull trap), adding to sell pressure.
3. Invalidation of Bullish Setup:
The presence of consecutive lower highs leading into the support area could indicate weakening bullish momentum.
A retest of the broken support as new resistance would confirm the shift in structure (support becomes resistance).

Gold (XAU/USD) Technical Analysis – Rising Wedge Breakdown & MMC🧠 2. Introduction to Mirror Market Concepts (MMC):
MMC, or Mirror Market Concepts, is a powerful technique that views price action as symmetrical or repetitive in nature. In this scenario, we notice that the right side of the chart mirrors the left — suggesting that after this bullish climb, the market might repeat its earlier bearish behavior but in a reflected pattern.
This adds confluence to our bearish outlook and makes the forecast more robust.
🔺 3. Rising Wedge Pattern – Bearish Reversal Signal:
The most critical part of this analysis is the formation of a Rising Wedge — a classic reversal pattern. Let’s break down what it means:
Structure: The wedge is formed by two upward-sloping trendlines converging at the top.
Volume Behavior: Volume typically decreases as the wedge matures, showing that bulls are losing strength.
Psychology: Buyers keep pushing the price higher, but each move has less momentum than the last. Sellers are quietly preparing for a breakdown.
The moment price breaks below the wedge’s lower trendline, it usually triggers panic selling or aggressive short entries.
🔄 4. Key Price Levels & Zones:
Minor Resistance Zone: Price rejected near a historical resistance area, showing sellers are still active.
Previous Target Zone: This area acted as a ceiling before the rejection — important for reversal confirmation.
SR Interchange Zone: A classic zone where support becomes resistance — this adds strong confluence to the reversal idea.
🎯 Bearish Trade Plan & Take-Profit Levels:
Once the wedge breaks down, the projected move is based on measured moves and prior support levels. Here’s the breakdown:
✅ TP1 (Take Profit 1): 3,275.30 – This is the first key support level right after the wedge breakdown. Ideal for partial profits.
✅ TP2: 3,205.64 – Previous support zone from earlier consolidation. High probability target.
✅ TP3: 3,169.18 – A more extended target that aligns with historical price memory and full wedge depth.
Each TP level is supported by historical price structure and previous volume clusters.
⚠️ Risk Factors & Trade Management:
While this setup looks strong, always consider:
False Breakouts : Wedges can fake out traders. Wait for candle close confirmation below the wedge.
News Events : Macroeconomic announcements (especially U.S. dollar data) can reverse technical setups.
Risk-to-Reward: Don’t enter without calculating your stop loss above the wedge and aiming for at least a 1:2 ratio.
🧠 Conclusion – What This Setup Tells Us:
This chart is a perfect blend of price action + market symmetry (MMC). The rising wedge signals that bulls are running out of steam, while MMC suggests a mirrored decline could follow.
If price action confirms the breakdown with momentum and volume, this could be a high-probability short setup for swing traders and intraday players alike.

EUR/AUD Short, CAD/JPY Short and GBP/AUD LongEUR/AUD Short
Minimum entry requirements:
• If structured 1H continuation forms, 1H risk entry within it.
CAD/JPY Short
Minimum entry requirements:
• Break above area of value.
• 1H impulse down below area of interest.
• If tight non-structured 15 min continuation follows, 5 min risk entry within it if the continuation is structured on the 5 min chart or reduced risk entry on the break of it.
• If tight structured 15 min continuation follows, reduced risk entry on the break of it or 15 min risk entry within it.
GBP/AUD Long
Minimum entry requirements:
• Break below area of value.
• 1H impulse up above area of value.
• If tight non-structured 5 min continuation follows, reduced risk entry on the break of it.
• If tight structured 5 min continuation follows, reduced risk entry on the break of it or 5 min risk entry within it.
• If tight non-structured 15 min continuation follows, 5 min risk entry within it if the continuation is structured on the 5 min chart or reduced risk entry on the break of it.
• If tight structured 15 min continuation follows, reduced risk entry on the break of it or 15 min risk entry within it.
EUR/USD Short
Minimum entry requirements:
• 1H impulse down below area of value.
• If tight non-structured 5 min continuation follows, reduced risk entry on the break of it.
• If tight structured 5 min continuation follows, reduced risk entry on the break of it or 5 min risk entry within it.
• If tight non-structured 15 min continuation follows, 5 min risk entry within it if the continuation is structured on the 5 min chart or reduced risk entry on the break of it.
• If tight structured 15 min continuation follows, reduced risk entry on the break of it or 15 min risk entry within it.

Market Analysis: USD/CAD Declines SteadilyMarket Analysis: USD/CAD Declines Steadily
USD/CAD declined and now is consolidating below the 1.3800 level.
Important Takeaways for USD/CAD Analysis Today
- USD/CAD started a fresh decline after it failed to clear the 1.4000 resistance.
- There is a connecting bearish trend line with resistance at 1.3740 on the hourly chart at FXOpen.
USD/CAD Technical Analysis
On the hourly chart of USD/CAD at FXOpen, the pair climbed toward the 1.3900 resistance zone before the bears appeared. The US Dollar formed a swing high near 1.3890 and recently declined below the 1.3800 support against the Canadian Dollar.
There was also a close below the 50-hour simple moving average and 1.3750. The bulls are now active near the 1.3700 level, but they might fail to protect more losses. If there is an upside correction, the pair could face resistance near the 1.3740 level.
There is also a connecting bearish trend line with resistance at 1.3740. The trend line is near the 23.6% Fib retracement level of the downward move from the 1.3888 swing high to the 1.3694 low.
If there is a fresh increase, the pair could face resistance near the 1.3790 level. It is close to the 50% Fib retracement level of the downward move from the 1.3888 swing high to the 1.3694 low. The next key resistance on the USD/CAD chart is near the 1.3815 level.
If there is an upside break above 1.3815, the pair could rise toward the 1.3890 resistance. The next major resistance is near the 1.3935 level, above which it could rise steadily toward the 1.4000 resistance zone.
Immediate support is near the 1.3695 level. The first major support is near 1.3660. A close below the 1.3660 level might trigger a strong decline. In the stated case, USD/CAD might test 1.3600. Any more losses may possibly open the doors for a drop toward the 1.3550 support.
This article represents the opinion of the Companies operating under the FXOpen brand only. It is not to be construed as an offer, solicitation, or recommendation with respect to products and services provided by the Companies operating under the FXOpen brand, nor is it to be considered financial advice.

Market Analysis: GBP/USD RalliesMarket Analysis: GBP/USD Rallies
GBP/USD started a fresh increase above the 1.3520 zone.
Important Takeaways for GBP/USD Analysis Today
- The British Pound is eyeing more gains above the 1.3600 resistance.
- There is a key bullish trend line forming with support at 1.3540 on the hourly chart of GBP/USD at FXOpen.
GBP/USD Technical Analysis
On the hourly chart of GBP/USD at FXOpen, the pair formed a base above the 1.3350 level. The British Pound started a steady increase above the 1.3450 resistance zone against the US Dollar, as discussed in the previous analysis.
The pair gained strength above the 1.3500 level. The bulls even pushed the pair above the 1.3550 level and the 50-hour simple moving average. The pair tested the 1.3585 zone and is currently consolidating gains.
GBP/USD is stable above the 23.6% Fib retracement level of the upward move from the 1.3390 swing low to the 1.3586 high. There is also a key bullish trend line forming with support at 1.3540.
It seems like the bulls might aim for more gains. The RSI moved above the 60 level on the GBP/USD chart and the pair is now approaching a major hurdle at 1.3600.
An upside break above the 1.3600 zone could send the pair toward 1.3650. Any more gains might open the doors for a test of 1.3720. If there is a downside correction, immediate support is near the 1.3540 level and the trend line.
The first major support sits near the 50% Fib retracement level of the upward move from the 1.3390 swing low to the 1.3586 high at 1.3485. The next major support is 1.3450. If there is a break below 1.3450, the pair could extend the decline. The next key support is near the 1.3390 level. Any more losses might call for a test of the 1.3345 support.
This article represents the opinion of the Companies operating under the FXOpen brand only. It is not to be construed as an offer, solicitation, or recommendation with respect to products and services provided by the Companies operating under the FXOpen brand, nor is it to be considered financial advice.

Market next move Original Analysis Summary:
Identifies a bullish structure breaking above a support area.
Projects a potential continuation to higher targets.
Suggests consolidation and bounce from support before climbing.
---
Disruptive Bearish Interpretation:
1. Lower High Possibility:
Recent price action might be forming a lower high rather than a continuation signal, signaling weakness in buying pressure.
2. Volume Imbalance:
Notice how the large green candle was followed by lower bullish volume, suggesting buying momentum is fading.
3. Breakout Trap:
The "Support area" may instead be a liquidity zone where breakout traders entered long positions and could now be trapped. A break below this area could cause a panic sell-off.
4. Trendline Respect (Rejection):
Price is currently retesting the underside of a descending trendline — a common reversal spot.

Market next target
Original Analysis Summary:
Identifies a bullish breakout above a support zone.
Expects continuation upward to a target zone after minor pullback.
Assumes support holds and bullish trend continues.
---
Disruptive Bearish Interpretation:
1. Fakeout Risk (Bull Trap):
Price broke above the support area, but this could be a false breakout designed to lure in long positions before a reversal.
2. Trendline Retest Failure:
The price is testing a trendline or resistance zone. Failure to break above this area could indicate rejection and reversal.
3. Bearish Divergence:
If momentum indicators (e.g., RSI or MACD, not shown here but inferred) show divergence, it may warn of weakening bullish strength despite price rising.
4. Candlestick Exhaustion:
Recent candles show upper wicks and slowing momentum — a common sign of potential exhaustion.

Market next target Original Analysis Summary:
Support area at ~1.1400 holding price.
Expectation: Bounce off support and continuation to higher target.
Arrows indicate a bullish bias after minor retracement.
---
Disruptive Bearish Interpretation:
1. Exhaustion at Top:
Strong upward rally could be showing signs of buying exhaustion, especially after the sharp vertical move.
The current top wick suggests rejection from higher levels.
2. Bearish Reversal Candles:
If a shooting star or bearish engulfing pattern forms near the target area, it could signal a reversal.
The current candle shows a long wick, which often precedes pullbacks.
3. False Breakout Risk:
The price could have broken above a resistance level only to trap breakout buyers before reversing downward.
This would trigger a move below the red box (support area).

Market next move Original Analysis Summary (Bearish):
Support area is being tested.
Arrows suggest a breakdown below support with targets around 3,280–3,240.
Volume shows a slight increase, possibly hinting at selling pressure.
---
Disruptive Bullish Interpretation:
1. False Breakdown Trap:
Price may briefly dip below support (bear trap) to flush out weak holders before bouncing back strongly.
This would invalidate the bearish scenario and trigger short covering.
2. Volume Analysis:
Although red candles dominate, the volume spike could also indicate buying absorption at this level.
Hidden accumulation may be underway.
3. Support Holding Well:
The support zone has been tested multiple times and still holds — which can also be interpreted as strong buying defense rather than weakness.
4. Potential Bullish Reversal Pattern:
If a bullish candlestick formation like a hammer or engulfing forms near the support zone, it could signal reversal back to the upside.
Target back to 3,380–3,400+ becomes viable.

Market next target Original Analysis Summary:
Support Area marked: Price bounced from this level.
Bullish Target: Expectation is for the price to rise after retesting support.
Arrows: Indicate potential bullish continuation (yellow) or slight drop before rising (blue).
---
Disruption / Counter Analysis:
1. Weak Volume Support:
Volume in the support area is not significantly higher, which can indicate weak buying interest. This weakens the case for a strong bounce upward.
2. Double Top Risk:
The chart could be forming a double top pattern near the 33.60–33.80 region. If price fails to break above, a bearish reversal might occur.
3. Bearish Divergence:
If RSI or MACD (not shown but assumed) indicates bearish divergence, upward momentum may not sustain.
4. Support Could Break:
If the support area is tested too many times (as appears here), it may eventually fail, causing a sharp drop to the next demand zone, possibly near 33.00 or lower.
5. Macro Uncertainty:
News events (e.g., U.S. economic data or interest rate news) can abruptly reverse expected trends regardless of technical setups.

Top M30 XAU/USD Trade Setups for Today – Buy & Sell Opportuniti📊📉📈 Gold (XAU/USD) is currently trading within a key support zone 🟣, retesting after a previous bullish breakout. If the price holds this zone and forms strong bullish candles, we could see a move toward the 3,366 resistance level 🔵 and potentially higher toward 3,389 📈. However, if the price breaks below this zone with strong bearish momentum, a drop toward 3,280 🔽 becomes likely. Watch the price action closely within this zone, as it could lead to a decisive move. ✅ Patience and confirmation are crucial to avoid false breakouts. 💡
