Bullish bounce off overlap support?The Fiber (EUR/USD) is falling towards the pivot and could bounce to the 1st resistance.
Pivot: 1.1263
1st Support: 1.1166
1st Resistance: 1.1423
Risk Warning:
Trading Forex and CFDs carries a high level of risk to your capital and you should only trade with money you can afford to lose. Trading Forex and CFDs may not be suitable for all investors, so please ensure that you fully understand the risks involved and seek independent advice if necessary.
Disclaimer:
The above opinions given constitute general market commentary, and do not constitute the opinion or advice of IC Markets or any form of personal or investment advice.
Any opinions, news, research, analyses, prices, other information, or links to third-party sites contained on this website are provided on an "as-is" basis, are intended only to be informative, is not an advice nor a recommendation, nor research, or a record of our trading prices, or an offer of, or solicitation for a transaction in any financial instrument and thus should not be treated as such. The information provided does not involve any specific investment objectives, financial situation and needs of any specific person who may receive it. Please be aware, that past performance is not a reliable indicator of future performance and/or results. Past Performance or Forward-looking scenarios based upon the reasonable beliefs of the third-party provider are not a guarantee of future performance. Actual results may differ materially from those anticipated in forward-looking or past performance statements. IC Markets makes no representation or warranty and assumes no liability as to the accuracy or completeness of the information provided, nor any loss arising from any investment based on a recommendation, forecast or any information supplied by any third-party.
Forextrading

Bitcoin: Will it surpass $109k in its upward trend?Since April, Bitcoin has traded in a clearly defined upward channel with two lower and upper trend lines. This channel was formed three touchpoints both on the lower and upper trendlines.
Near a critical zone
Now, BTC is at a key resistance zone where it previously peaked around $109,000, holding its all-time high. This level resists both judgement as well as forensic level significantly of a psychological barrier because it was the peak of the last major bull cycle. The price is currently hovering around the everyday resistance line while BTC is still in the upward channel. In conjunction with the historic all-time high and the upper channel resistance, range bound price action gives us an accurate capture of BTC’s behaviour.
Bullish breakout
The scenario outlined for this resistance zone makes the most sense as a rejection may lead to a temporary pullback, likely to the somewhat lower boundary of the rising channel. This in itself would not be the termination of the bullish trend, but instead a healthy retracement within the confines of an uptrend structure. But, if the market does break out above the $109,000 level with ample volume and bullish momentum, then things could start changing in the market for the better from there. Such breakout will confirm the uptrend is strong and valid where else new breakout targets will also be set turning the old high into new low. The $109,000 level would then probably move from resistance to support, making it a critical area for bulls to protect on any retests in the future.
A bearish breakout
The ramifications of a breakdown below the rising channel should also be understood by traders. It is crucial to keep an eye on the channel's lower barrier, which is presently at about $104,000. A significant decline below this level would signal a loss of short-term bullish momentum and lead to a more thorough correction. In that scenario, Bitcoin would probably go for the imbalanced area between $97,500 and $100,500, where the price has previously moved quickly without forming any solid support or resistance. Buyers may be able to intervene in this zone and try to restore bullish dominance, which may pave the way for a new breakout attempt and another surge toward the $109,000 barrier.
Conclusion
In conclusion, Bitcoin is at a critical point right now. Bitcoin is currently facing a significant resistance zone at its prior all-time high, but the upward channel that has directed price action since April is still in place. The degree of market momentum and the actions of buyers and sellers at these critical levels will determine whether the price hits new highs or declines. Investors and traders should be alert and ready for both situations since the next action could determine how Bitcoin develops over the following few weeks.
I appreciate your help.
To ensure you do not miss the upcoming analysis, be sure to follow me!
Please leave a remark and a like!

Market next move
1. Misleading Bullish Label
Issue: The chart marks the latest price action as "Bullish" based on a short-term recovery.
Disruption: This could be a dead-cat bounce — a temporary recovery in a downtrend. The overall trend from the prior candles is bearish, and a few green candles don’t confirm a reversal without volume or structural confirmation.
---
2. Volume Analysis Ignored
Issue: The volume spike accompanying the recent green candles is not fully analyzed.
Disruption: Although there's higher volume, it could be short covering or a reaction to news, not organic buying interest. No volume divergence or institutional footprint confirmation is given.
---
3. No Confirmation Pattern
Issue: No mention of chart patterns (e.g., double bottom, inverse head and shoulders, etc.).
Disruption: Calling it “bullish” without a clear technical pattern or confirmation (like a break of resistance or retest) is speculative.
---
4. Vague Target
Issue: The “Target” is labeled without specifics.
Disruption: There's no price level, Fibonacci retracement, or resistance level justification. A target without rationale lacks credibility.
---
5. No Risk Management
Issue: No stop-loss or risk level is discussed.
Disruption: Without defined risk-reward ratio, the analysis is incomplete and not tradable. Every strategy needs downside planning.

Market next target Disruption of the Analysis
1. Weak Confirmation of Reversal: The chart shows a possible target zone after a recent small bullish move, but the candlestick reversal pattern is weak and lacks a strong confirmation candle. Without a bullish engulfing or a high-volume breakout, this “Target” may be premature.
2. Downtrend Momentum Intact: Despite the slight bounce, the broader trend remains bearish (visible by the previous lower lows and lower highs). No trendline break or structural shift supports a move toward the target.
3. Volume Does Not Support Breakout: Although there is a small spike in green volume, it does not exceed previous bearish volume, which suggests that buyers are not yet in control.
4. Over-reliance on Visual Targeting: The “Target” label appears to be placed based on a subjective expectation, not on a clear technical structure like a resistance level, Fibonacci retracement, or moving average. This makes it speculative.
5. Lack of Indicator Confluence: There are no visible indicators (like RSI, MACD, or EMA crossovers) shown to justify a reversal. Trading solely on price action without confirmation from indicators reduces reliability.

Market next move
Bullish Disruption Scenario
1. False Resistance Breakdown:
The red zone marked as resistance may fail to hold. The recent strong bullish candle and volume spike hint at possible accumulation rather than rejection.
2. Breakout and Retest Play:
Price could break above the resistance zone, retest it as new support, and then continue higher—invalidating the expected red and blue downward paths.
3. Volume Behavior:
The most recent green volume spike could signal strong institutional buying, which often precedes a breakout.
4. Higher Lows Formation:
Price structure is creating higher lows, which is a bullish signal in consolidation before breakout.
5. Market Sentiment:
If upcoming U.S. macroeconomic data (see flag icons) is dovish or supportive of crypto risk-on assets, BTC could rally sharply.

Market next move Bearish Disruption Scenario
1. Resistance Zone Holding (Red Box):
The current price is testing a strong resistance zone (highlighted in red).
There’s a chance that this level won't be broken easily due to historical supply or institutional sell orders.
2. Volume Spike Warning:
The recent green volume bars show increased buying, but this could signal buyer exhaustion if no significant breakout follows.
3. Fake Breakout Potential:
Price may perform a false breakout above the resistance, trapping late buyers before reversing down sharply.
4. Bearish Candlestick Confirmation:
If the next few candles form a reversal pattern (like a bearish engulfing or shooting star), it would support a short-term correction or drop.
5. Macro & News Risk:
Note the upcoming economic events (flag icons). U.S. or Japan economic data could disrupt the technical setup.

XAU/USD: Bull or Bear? Let's Find Out! (READ THE CAPTION)By examining the gold chart on the 4-hour timeframe, we can see that after our previous analysis, the price first corrected to the $3323 area and is currently trading around $3336. As mentioned in the previous analysis, as long as the price remains above $3313, we can expect further upside for gold. Based on the prior analysis, the next bullish targets are $3342, $3358, $3366, and $3394.
Please support me with your likes and comments to motivate me to share more analysis with you and share your opinion about the possible trend of this chart with me !
Best Regards , Arman Shaban

USDCAD: Strong Bearish Confirmation ?! 🇺🇸🇨🇦
I see an important sign of strength of the sellers on USDCAD
on an hourly time frame after a release of the today's US fundamentals.
The price violated a support line of a horizontal range and is retesting
that at the moment.
I believe that the price may drop at least to1.374 level soon.
❤️Please, support my work with like, thank you!❤️
I am part of Trade Nation's Influencer program and receive a monthly fee for using their TradingView charts in my analysis.

Market next move . Support Fatigue / Breakdown Risk
Observation: Price has tested the red support zone multiple times.
Disruption: Repeated tests of support often weaken it. If it breaks, a sharp drop may follow.
Implication: Instead of bouncing, EUR/USD could slide below 1.13200, triggering stop-losses.
---
2. Lack of Bullish Volume Confirmation
Observation: The recent candles show low volume on bullish attempts.
Disruption: Weak demand at support indicates hesitation among buyers.
Implication: Without a volume spike, any bounce may be short-lived or fail entirely.
---
3. Bearish Momentum Still Intact
Observation: Price action shows consistent lower highs and lower lows.
Disruption: The short-term trend is still bearish, so this could be a pause before continuation down.
Implication: A false bullish break could trap long traders before a drop resumes.
---
4. Fundamental Risks (USD Strength)
Disruption: Any U.S. data surprises or hawkish Fed comments (noted by U.S. event icons on the chart) could push USD higher, dragging EUR/USD down.
Implication: Technical bounce setups could be invalidated by macro events.

Market next move
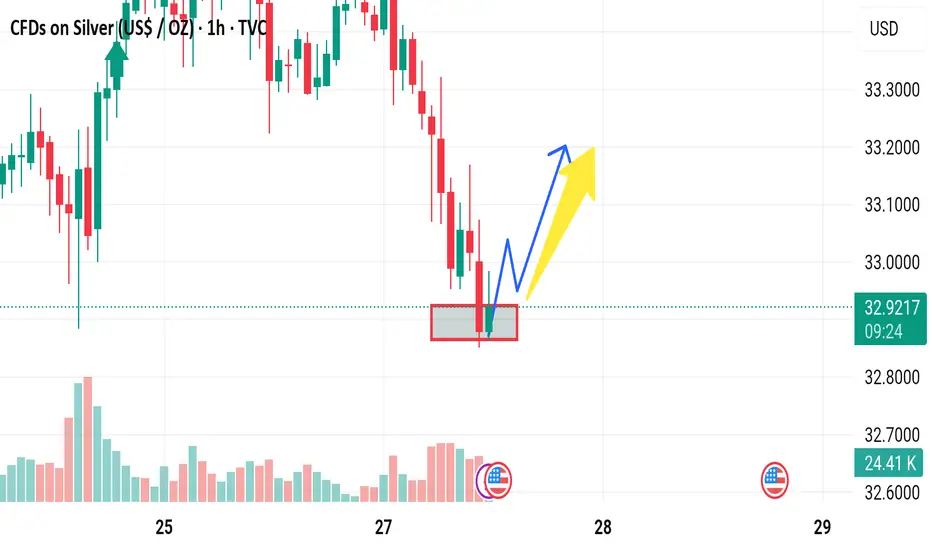
1. False Breakout / Bull Trap Risk
Observation: Price just touched the support and bounced slightly.
Disruption: If buyers fail to push above the next resistance (around 32.95–33.00), it could be a bull trap.
Implication: The bounce might just be a short-covering rally before another leg down.
---
2. Weak Buying Volume
Observation: The bounce lacks strong green volume bars so far.
Disruption: Weak volume on the bounce suggests limited buyer conviction.
Implication: Without a volume surge, the upward move could fizzle out quickly.
---
3. Lower High Structure
Observation: The trend before the support touch is clearly down.
Disruption: This bounce may only form a lower high before continuation lower.
Implication: The larger trend remains bearish unless 33.20+ is reclaimed with strength.
---
4. Fundamental Headwinds
Disruption: Any upcoming data like strong USD, rising interest rates, or weak industrial demand could push silver down despite technical setups.
Implication: Bullish setups could fail fast due to macroeconomic pressure.
Market next move
1. Potential Bear Trap Scenario
Observation: The highlighted consolidation area could be a support zone.
Disruption: If the price quickly reclaims and holds above this zone (around 3,292), it could be a bear trap. This might attract buyers looking for a false breakdown reversal.
Implication: This could lead to a short-term rally instead of continuation lower.
---
2. Volume Divergence
Observation: Despite the breakdown, the selling volume seems to taper off compared to the previous heavy down move.
Disruption: Lower volume on a breakdown can signal weakening bearish momentum. Price might consolidate or even reverse.
Implication: Watch for bullish volume spikes as a sign of reversal interest.
---
3. Oversold RSI or Momentum Indicators
Disruption: If momentum indicators like RSI (not visible on this chart) show oversold conditions, this may suggest a relief bounce is more likely than further immediate downside.
Implication: Short-term traders could get trapped if they short too late.
---
4. Fundamental Triggers
Disruption: Any sudden positive news for gold (e.g. economic uncertainty, lower bond yields, central bank demand) can reverse this technical setup quickly.
Implication: Be cautious trading solely on technicals in sensitive markets like gold.

Analysing the Volatility Spike on the USD/JPY ChartAnalysing the Volatility Spike on the USD/JPY Chart
The USD/JPY chart offers plenty of noteworthy insights for analysis:
→ A one-month low was recorded today (marked by the arrow);
→ This was followed by a sharp upward reversal, with a series of large bullish candlesticks forming on the intraday chart.
Why Is USD/JPY Moving Sharply Today?
The primary driver appears to be recent statements from Bank of Japan Governor Kazuo Ueda.
According to Trading Economics, this morning Ueda:
→ warned of rising core inflation risks linked to increasing food prices;
→ indicated that the Bank of Japan is prepared to adjust its monetary policy in order to achieve a stable inflation target.
Latest data show that Japan’s core inflation unexpectedly rose to 3.5% — the highest level in two years — reinforcing the case for further rate hikes. However, what's particularly striking is that despite Ueda’s hawkish tone, the yen is weakening.
Technical Analysis of the USD/JPY Chart
Yen fluctuations formed a downward trajectory (marked in orange) in the second half of May, partly driven by US dollar weakness. Following a period of relative calm, the market has shifted into high gear — the ATR indicator is climbing sharply from multi-month lows, breaking through resistance at the 143.0 level.
This aggressive price action on the USD/JPY chart today suggests we may be witnessing an attempted bullish breakout from the channel. In light of this, it is possible that the surge in volatility reflects a fundamental shift in market sentiment — one that could potentially lead to the development of an upward trend.
This article represents the opinion of the Companies operating under the FXOpen brand only. It is not to be construed as an offer, solicitation, or recommendation with respect to products and services provided by the Companies operating under the FXOpen brand, nor is it to be considered financial advice.

MarketBreakdown | USDJPY, US100, BITCOIN, GBPJPY
Here are the updates & outlook for multiple instruments in my watch list.
1️⃣ #USDJPY 4H time frame 🇺🇸🇯🇵
I see a strong bullish reaction to a key daily/intraday horizontal support.
A formation of a high momentum bullish candle and a violation of a resistance line
of a bullish flag indicate a highly probable rise to higher levels.
2️⃣ #US100 #NASDAQ Index 4H time frame
I spotted one more bullish flag on US100.
Its resistance was violated yesterday and we already see
a strong buying interest.
I think that the market will rise more, at least to a current local high.
3️⃣ #BITCOIN #BTCUSD daily time frame
The price nicely respected a confluence zone based on
a rising trend line and a recently broken horizontal structure.
Probabilities will be high that the market will continue rising from that.
4️⃣ #GBPJPY daily time frame 🇬🇧🇯🇵
The price nicely respected a solid rising trend line.
I see a breakout attempt of a minor daily horizontal resistance.
IF a daily candle closes above that, it will provide a strong bullish confirmation.
Do you agree with my market breakdown?
❤️Please, support my work with like, thank you!❤️
I am part of Trade Nation's Influencer program and receive a monthly fee for using their TradingView charts in my analysis.

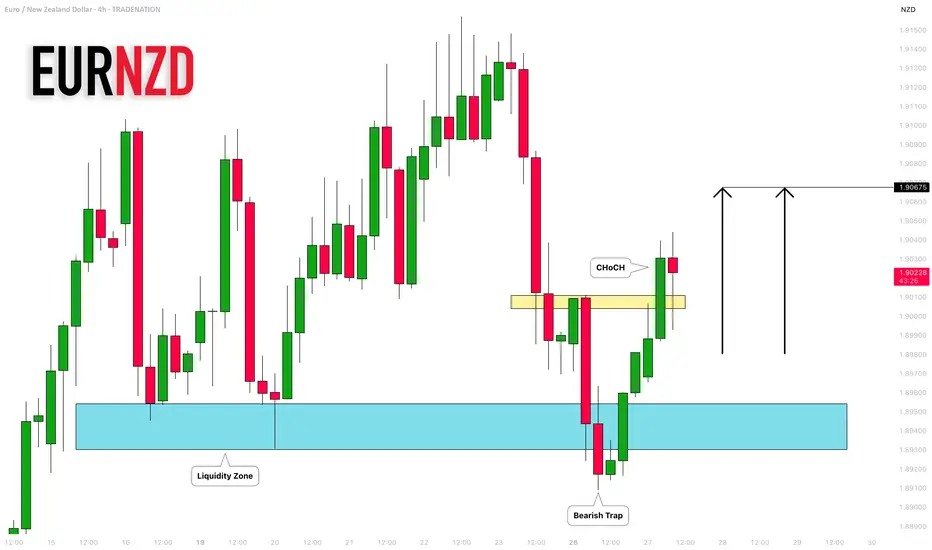
EURNZD: False Breakout & Bullish Movement 🇪🇺🇳🇿
I think that EURNZD may rise today after
a confirmed bearish trap and a bullish CHoCH.
Next resistance - 1.90675
❤️Please, support my work with like, thank you!❤️
I am part of Trade Nation's Influencer program and receive a monthly fee for using their TradingView charts in my analysis.
XAUUSD ALERT TODAYHere it is - Gold has started to fall. The price formed a descending channel pattern, bounced off the upper trendline, and broke the short-term uptrend. Parabolic SAR indicates the beginning of the decline, and MACD confirms the decline. There is also Imbalance at the bottom.
🔽 We consider selling #XAUUSD only on consolidation below 3305;
🎯 Target: 3250.

EUR/NZD Short and CAD/JPY ShortEUR/NZD Short
Minimum entry requirements:
• If tight non-structured 5 min continuation forms, reduced risk entry on the break of it.
• If tight structured 5 min continuation forms, reduced risk entry on the break of it or 5 min risk entry within it.
• If tight non-structured 15 min continuation forms, 5 min risk entry within it if the continuation is structured on the 5 min chart or reduced risk entry on the break of it.
• If tight structured 15 min continuation forms, reduced risk entry on the break of it or 15 min risk entry within it.
CAD/JPY Short
Minimum entry requirements:
• Tap into area of value.
• 1H impulse down below area of value.
• If tight non-structured 5 min continuation follows, reduced risk entry on the break of it.
• If tight structured 5 min continuation follows, reduced risk entry on the break of it or 5 min risk entry within it.
• If tight non-structured 15 min continuation follows, 5 min risk entry within it if the continuation is structured on the 5 min chart or reduced risk entry on the break of it.
• If tight structured 15 min continuation follows, reduced risk entry on the break of it or 15 min risk entry within it.

Market next target ---
Bearish Disruption Analysis
1. False Breakout Zone (Red Box Area):
The price is revisiting the red box area (potential supply/resistance zone). If it fails to break and close above this zone convincingly, it may signal a bull trap.
Previous attempts to push higher were rejected around this level, showing seller strength.
2. Lower High Formation Risk:
The recent upward move might form a lower high compared to the high from the 25th.
If price reverses below $33.30–$33.20, it could trigger more downside momentum, potentially targeting the $33.00 or even $32.80 level.
3. Volume Divergence:
Notice the decline in volume as price attempts to rise. Lower buying volume may indicate weak bullish conviction, which increases the risk of a downturn.
4. Bearish Candlestick Reversal Pattern:
If any bearish engulfing or shooting star candlestick forms near resistance, it would support a bearish reversal case.

Market next move Original Analysis Summary:
The chart shows a support area around the 3340 USD level.
There are two bullish scenarios outlined with blue and yellow arrows, implying a price increase from the support zone.
---
Disruption/Critical Analysis:
1. Overreliance on Short-Term Support:
The chart assumes the marked support area will hold, but no confirmation (like a bullish candlestick pattern or strong buying volume) is evident yet. A break below that zone could lead to a bearish move instead.
2. Volume Weakness:
Recent candles near the support zone are not backed by significantly increasing volume. This suggests weak buying interest, making the bullish forecast potentially over-optimistic.
3. No Consideration of Macroeconomic Events:
The chart doesn't factor in fundamental drivers (like U.S. economic data, Fed announcements), which can easily invalidate technical patterns.

Market next move
Disruption of the Bullish Bias:
1. False Breakout Risk
The area marked with a red rectangle might be showing signs of consolidation, but there's a possibility that the bullish breakout is a bull trap.
Volume does not strongly confirm a breakout; note that the volume on the recent upward candles is not significantly higher than the surrounding bars — often a sign of weak buyer conviction.
2. Resistance Overhead
BTC is approaching the psychological level of 110,000, which may act as resistance.
Price action shows several small-bodied candles with wicks, indicating indecision or rejection from higher levels.
3. Bearish Divergence Potential
If paired with RSI or MACD indicators (not visible in this image), there might be signs of bearish divergence — price making higher highs while the indicator makes lower highs.
4. Liquidity Sweep Scenario
The recent wick into the highlighted zone could be a liquidity sweep — grabbing stop-losses before reversing downward.
This would support a bearish move contrary to the bullish forecast.
5. Market Sentiment & Fundamentals
Ignoring macro events such as Fed decisions, ETF movements, or regulatory news can be dangerous. If bearish news breaks out, technical setups can fail fast

Why EUR vs GBP Could Be Your Best Trade This Week!When it comes to forex swing trading or even forex intraday trading, the temptation to zoom into lower timeframes—like the 15-minute or 1-hour charts—is strong. Most forex traders focus on short-term momentum, often diving into scalping strategies that chase quick pips. However, the real edge lies where most don’t look: the higher timeframes, particularly the weekly chart. The EUR/GBP forex pair is a perfect example of these higher timeframes' power, especially when paired with smart money concepts like demand and supply imbalances.
EUR/GBP: A Hidden Gem for Forex Swing Traders
The EUR/GBP Forex cross pair is often overlooked compared to major USD-based pairs. However, for seasoned swing traders and institutional players, EUR/GBP offers deep liquidity, cleaner technical analysis and price action structures, and strong reaction zones that are respected time and time again.
At the end of May 2025, a significant weekly demand imbalance at 0.8384 finally took control of price action—something smart money traders had been anticipating for months. This wasn't a surprise for those watching the higher timeframes. Similar to how the previous weekly imbalance at 0.8299 took control in February 2025, these zones have proven critical in guiding the medium- to long-term direction of EUR/GBP.

GBPAUD: Bullish Bias Remains 🇬🇧🇦🇺
I already shared a confirmed bullish breakout of a falling trend line on a daily.
Though the price went a bit lower, below that after its retest,
we have a significant horizontal support cluster that strongly holds.
I think that the price may start rising from that and reach
2.1 level this week.
❤️Please, support my work with like, thank you!❤️
I am part of Trade Nation's Influencer program and receive a monthly fee for using their TradingView charts in my analysis.

VIEW: EURUSD-Cut your losses short and let your winners run.
-The market is a device for transferring money from the impatient to the patient.
-In investing, what is comfortable is rarely profitable.
-Trade what you see, not what you think.
CONFIRMATION
-Price is bullish
-Strong order block
-BOS
-Liquidity sweep
-FVG filled
-Price retraced
NB: Do not ever compare yourself to other traders. Take regular breaks from trading Maintain a trading journal Love your craft Learn from other successful traders.

Market next target Original Analysis Summary:
Support Area Identified: Around 3335.
Expected Scenario: Bounce from support leading to a bullish move toward the "Target" zone.
Two Paths Shown: A direct bounce (yellow) or a fakeout/drop below support followed by a bullish reversal (blue arrow).
---
Disruption Analysis: Bearish Scenario
1. Support Breakdown:
Instead of bouncing at the support area (~3335), the price fails to hold and breaks down below.
Increased volume or bearish momentum could lead to this breakdown.
2. New Target Zone:
If support is broken, the next key demand zone may lie around 3300 or below, making that the new target.
Traders expecting a bounce may get trapped (bull trap), adding to sell pressure.
3. Invalidation of Bullish Setup:
The presence of consecutive lower highs leading into the support area could indicate weakening bullish momentum.
A retest of the broken support as new resistance would confirm the shift in structure (support becomes resistance).
