EUR/AUD Short, CAD/JPY Short and GBP/AUD LongEUR/AUD Short
Minimum entry requirements:
• If structured 1H continuation forms, 1H risk entry within it.
CAD/JPY Short
Minimum entry requirements:
• Break above area of value.
• 1H impulse down below area of interest.
• If tight non-structured 15 min continuation follows, 5 min risk entry within it if the continuation is structured on the 5 min chart or reduced risk entry on the break of it.
• If tight structured 15 min continuation follows, reduced risk entry on the break of it or 15 min risk entry within it.
GBP/AUD Long
Minimum entry requirements:
• Break below area of value.
• 1H impulse up above area of value.
• If tight non-structured 5 min continuation follows, reduced risk entry on the break of it.
• If tight structured 5 min continuation follows, reduced risk entry on the break of it or 5 min risk entry within it.
• If tight non-structured 15 min continuation follows, 5 min risk entry within it if the continuation is structured on the 5 min chart or reduced risk entry on the break of it.
• If tight structured 15 min continuation follows, reduced risk entry on the break of it or 15 min risk entry within it.
EUR/USD Short
Minimum entry requirements:
• 1H impulse down below area of value.
• If tight non-structured 5 min continuation follows, reduced risk entry on the break of it.
• If tight structured 5 min continuation follows, reduced risk entry on the break of it or 5 min risk entry within it.
• If tight non-structured 15 min continuation follows, 5 min risk entry within it if the continuation is structured on the 5 min chart or reduced risk entry on the break of it.
• If tight structured 15 min continuation follows, reduced risk entry on the break of it or 15 min risk entry within it.
Forextrading

Market Analysis: USD/CAD Declines SteadilyMarket Analysis: USD/CAD Declines Steadily
USD/CAD declined and now is consolidating below the 1.3800 level.
Important Takeaways for USD/CAD Analysis Today
- USD/CAD started a fresh decline after it failed to clear the 1.4000 resistance.
- There is a connecting bearish trend line with resistance at 1.3740 on the hourly chart at FXOpen.
USD/CAD Technical Analysis
On the hourly chart of USD/CAD at FXOpen, the pair climbed toward the 1.3900 resistance zone before the bears appeared. The US Dollar formed a swing high near 1.3890 and recently declined below the 1.3800 support against the Canadian Dollar.
There was also a close below the 50-hour simple moving average and 1.3750. The bulls are now active near the 1.3700 level, but they might fail to protect more losses. If there is an upside correction, the pair could face resistance near the 1.3740 level.
There is also a connecting bearish trend line with resistance at 1.3740. The trend line is near the 23.6% Fib retracement level of the downward move from the 1.3888 swing high to the 1.3694 low.
If there is a fresh increase, the pair could face resistance near the 1.3790 level. It is close to the 50% Fib retracement level of the downward move from the 1.3888 swing high to the 1.3694 low. The next key resistance on the USD/CAD chart is near the 1.3815 level.
If there is an upside break above 1.3815, the pair could rise toward the 1.3890 resistance. The next major resistance is near the 1.3935 level, above which it could rise steadily toward the 1.4000 resistance zone.
Immediate support is near the 1.3695 level. The first major support is near 1.3660. A close below the 1.3660 level might trigger a strong decline. In the stated case, USD/CAD might test 1.3600. Any more losses may possibly open the doors for a drop toward the 1.3550 support.
This article represents the opinion of the Companies operating under the FXOpen brand only. It is not to be construed as an offer, solicitation, or recommendation with respect to products and services provided by the Companies operating under the FXOpen brand, nor is it to be considered financial advice.

Market Analysis: GBP/USD RalliesMarket Analysis: GBP/USD Rallies
GBP/USD started a fresh increase above the 1.3520 zone.
Important Takeaways for GBP/USD Analysis Today
- The British Pound is eyeing more gains above the 1.3600 resistance.
- There is a key bullish trend line forming with support at 1.3540 on the hourly chart of GBP/USD at FXOpen.
GBP/USD Technical Analysis
On the hourly chart of GBP/USD at FXOpen, the pair formed a base above the 1.3350 level. The British Pound started a steady increase above the 1.3450 resistance zone against the US Dollar, as discussed in the previous analysis.
The pair gained strength above the 1.3500 level. The bulls even pushed the pair above the 1.3550 level and the 50-hour simple moving average. The pair tested the 1.3585 zone and is currently consolidating gains.
GBP/USD is stable above the 23.6% Fib retracement level of the upward move from the 1.3390 swing low to the 1.3586 high. There is also a key bullish trend line forming with support at 1.3540.
It seems like the bulls might aim for more gains. The RSI moved above the 60 level on the GBP/USD chart and the pair is now approaching a major hurdle at 1.3600.
An upside break above the 1.3600 zone could send the pair toward 1.3650. Any more gains might open the doors for a test of 1.3720. If there is a downside correction, immediate support is near the 1.3540 level and the trend line.
The first major support sits near the 50% Fib retracement level of the upward move from the 1.3390 swing low to the 1.3586 high at 1.3485. The next major support is 1.3450. If there is a break below 1.3450, the pair could extend the decline. The next key support is near the 1.3390 level. Any more losses might call for a test of the 1.3345 support.
This article represents the opinion of the Companies operating under the FXOpen brand only. It is not to be construed as an offer, solicitation, or recommendation with respect to products and services provided by the Companies operating under the FXOpen brand, nor is it to be considered financial advice.

Market next move Original Analysis Summary:
Identifies a bullish structure breaking above a support area.
Projects a potential continuation to higher targets.
Suggests consolidation and bounce from support before climbing.
---
Disruptive Bearish Interpretation:
1. Lower High Possibility:
Recent price action might be forming a lower high rather than a continuation signal, signaling weakness in buying pressure.
2. Volume Imbalance:
Notice how the large green candle was followed by lower bullish volume, suggesting buying momentum is fading.
3. Breakout Trap:
The "Support area" may instead be a liquidity zone where breakout traders entered long positions and could now be trapped. A break below this area could cause a panic sell-off.
4. Trendline Respect (Rejection):
Price is currently retesting the underside of a descending trendline — a common reversal spot.

Market next target
Original Analysis Summary:
Identifies a bullish breakout above a support zone.
Expects continuation upward to a target zone after minor pullback.
Assumes support holds and bullish trend continues.
---
Disruptive Bearish Interpretation:
1. Fakeout Risk (Bull Trap):
Price broke above the support area, but this could be a false breakout designed to lure in long positions before a reversal.
2. Trendline Retest Failure:
The price is testing a trendline or resistance zone. Failure to break above this area could indicate rejection and reversal.
3. Bearish Divergence:
If momentum indicators (e.g., RSI or MACD, not shown here but inferred) show divergence, it may warn of weakening bullish strength despite price rising.
4. Candlestick Exhaustion:
Recent candles show upper wicks and slowing momentum — a common sign of potential exhaustion.

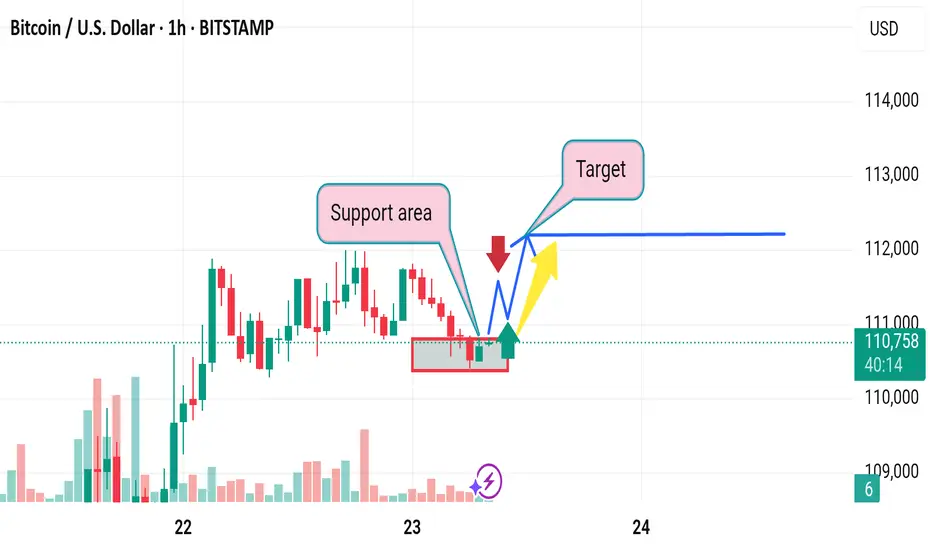
Market next target Original Analysis Summary:
Support area at ~1.1400 holding price.
Expectation: Bounce off support and continuation to higher target.
Arrows indicate a bullish bias after minor retracement.
---
Disruptive Bearish Interpretation:
1. Exhaustion at Top:
Strong upward rally could be showing signs of buying exhaustion, especially after the sharp vertical move.
The current top wick suggests rejection from higher levels.
2. Bearish Reversal Candles:
If a shooting star or bearish engulfing pattern forms near the target area, it could signal a reversal.
The current candle shows a long wick, which often precedes pullbacks.
3. False Breakout Risk:
The price could have broken above a resistance level only to trap breakout buyers before reversing downward.
This would trigger a move below the red box (support area).

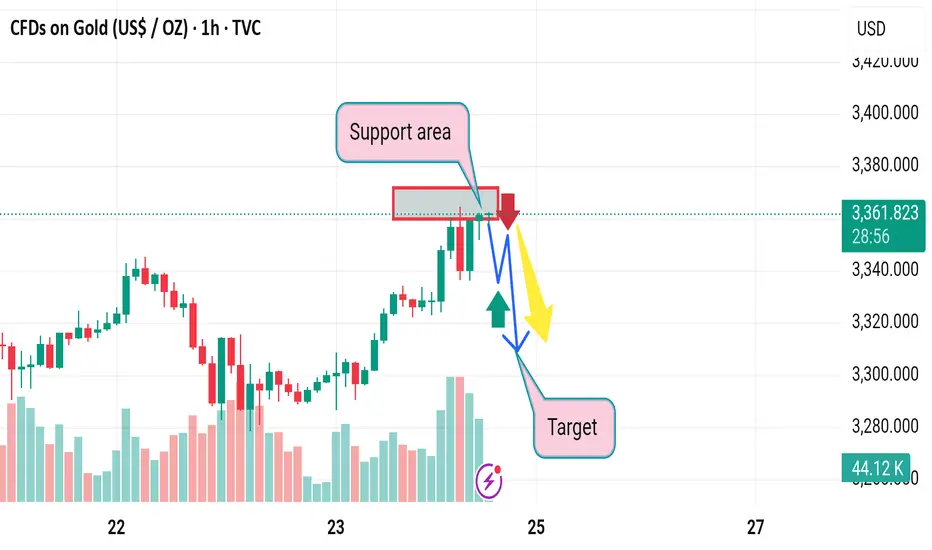
Market next move Original Analysis Summary (Bearish):
Support area is being tested.
Arrows suggest a breakdown below support with targets around 3,280–3,240.
Volume shows a slight increase, possibly hinting at selling pressure.
---
Disruptive Bullish Interpretation:
1. False Breakdown Trap:
Price may briefly dip below support (bear trap) to flush out weak holders before bouncing back strongly.
This would invalidate the bearish scenario and trigger short covering.
2. Volume Analysis:
Although red candles dominate, the volume spike could also indicate buying absorption at this level.
Hidden accumulation may be underway.
3. Support Holding Well:
The support zone has been tested multiple times and still holds — which can also be interpreted as strong buying defense rather than weakness.
4. Potential Bullish Reversal Pattern:
If a bullish candlestick formation like a hammer or engulfing forms near the support zone, it could signal reversal back to the upside.
Target back to 3,380–3,400+ becomes viable.

Market next target Original Analysis Summary:
Support Area marked: Price bounced from this level.
Bullish Target: Expectation is for the price to rise after retesting support.
Arrows: Indicate potential bullish continuation (yellow) or slight drop before rising (blue).
---
Disruption / Counter Analysis:
1. Weak Volume Support:
Volume in the support area is not significantly higher, which can indicate weak buying interest. This weakens the case for a strong bounce upward.
2. Double Top Risk:
The chart could be forming a double top pattern near the 33.60–33.80 region. If price fails to break above, a bearish reversal might occur.
3. Bearish Divergence:
If RSI or MACD (not shown but assumed) indicates bearish divergence, upward momentum may not sustain.
4. Support Could Break:
If the support area is tested too many times (as appears here), it may eventually fail, causing a sharp drop to the next demand zone, possibly near 33.00 or lower.
5. Macro Uncertainty:
News events (e.g., U.S. economic data or interest rate news) can abruptly reverse expected trends regardless of technical setups.

Top M30 XAU/USD Trade Setups for Today – Buy & Sell Opportuniti📊📉📈 Gold (XAU/USD) is currently trading within a key support zone 🟣, retesting after a previous bullish breakout. If the price holds this zone and forms strong bullish candles, we could see a move toward the 3,366 resistance level 🔵 and potentially higher toward 3,389 📈. However, if the price breaks below this zone with strong bearish momentum, a drop toward 3,280 🔽 becomes likely. Watch the price action closely within this zone, as it could lead to a decisive move. ✅ Patience and confirmation are crucial to avoid false breakouts. 💡

"GBPUSD Ready for the Kill After Premium Zone Reaction!"⚡ GBPUSD Analysis - 1H Timeframe | April 28, 2025
📈 What's Happening:
GBPUSD just tapped deep into the Premium Zone while simultaneously reacting off a clean Fair Value Gap (FVG).
Signs of bearish rejection are stacking up — Smart Money might be preparing for the kill shot! 🎯
🚨 Key Levels Highlighted:
Strong High = Major invalidation (~1.34317).
Premium Zone = Where sellers ideally step in.
Fair Value Gap (FVG) = Where price imbalance triggered a reaction.
Weak Low = Major liquidity target (~1.32036).
🧠 Key Observations:
Price filled the FVG and immediately showed a reaction = sign of Smart Money stepping in.
Strong High untouched = still valid for bearish play.
Weak Low + Sell Side Liquidity = magnets below.
🎯 2-SCENARIO PLAN:
Plan A — Short Setup (Primary Bias):
✅ Look for bearish confirmation via M15 or M5 structure shift.
✅ Ideal entry around Premium/FVG zone.
✅ TP1 = Minor structure lows around 1.33000. TP2 = Full Weak Low sweep (~1.32036).
✅ SL = Above Strong High (~1.34317).
Plan B — Invalidated if:
✅ Strong High is broken impulsively = setup failed. No chasing!
📊 Risk Management Tip:
"Fair Value Gap reactions inside Premium = sniper-level setups. Focus on confirmations, not assumptions."
🧘♂️ Summary:
✅ Premium Tap ✅ FVG Fill ✅ Bearish Reaction ✅ Weak Low Target
Patience = Power.
This could be the sniper setup you've been waiting for! 🔥
➡️ Save this playbook.
➡️ Comment "SNIPE THE GAP" if you're setting the trap! 🎯

USDJPY: Smart Money Reloads at Demand ZoneThis pair is showing some next-level institutional behavior right now, and the play is looking ripe for a long position — here's why:
📉 Previous Sell-Off = Liquidity Engineering
USDJPY had a strong downward leg creating a perfect internal liquidity pool, then took out that internal high (marked by triple liquidity tags 💵💵💵) just above a descending channel. That was your classic fakeout / inducement trap.
🎯 Price Tapped Into a Fresh Bullish Order Block
Price dipped deep into a refined OB (purple zone) aligned with the lower channel and then wicked hard out of it. That move created a bullish rejection wick, confirming buyer interest from smart money.
You can see price forming a micro HL structure at the edge of the demand zone — premium setup for continuation.
📍 Key Confluences:
✅ OB sits right around the mid-channel EQ
✅ Demand zone is built on top of a strong low (142.680 area)
✅ Strong risk-to-reward setup aiming for weak high and buy-side liquidity
✅ Rejection aligns with a bullish change of character (ChoCh) from lower timeframes
💥 Targets:
🔹 TP1 - Weak High at 144.400
🔹 TP2 - Buy Side Liquidity sweep at 145.514
🔹 Extended Target - Ride it to channel top / HTF imbalance fill above 146.000
📈 Trade Idea Summary:
Entry Zone: Anywhere in the OB range from 143.554 to 143.189
Stop Loss: Below 143.000 or the strong low
Risk-Reward: Easily 1:5+ if targeting full range move
🚨 Why It Matters:
This chart screams smart money accumulation at the bottom of a channel. Retail traders might still be shorting the retracement — but smart money is loading longs while price consolidates at demand.
If price clears the weak high, it could ignite a bullish rally into the upper supply zones where liquidity lies.
💬 Comment "UJ MOVE" if you're entering this sniper long!
🔁 Repost this if you’re tracking it with your team!

Gold (XAUUSD) Primed to ExplodeGold is looking ultra-reactive right now and ready to pop. This is textbook SMC with a clean roadmap.
🔍 Market Narrative:
Price action shows a series of equal highs + trendline liquidity sweeps, followed by a deep sell-off into a premium demand zone. What makes this setup powerful is how it:
Swept internal liquidity below structure
Tapped a strong low while entering a discount OB zone
Respected FVG (Fair Value Gap) sitting right in the golden zone (61.8–70.5%)
📍 Key Confluences:
✅ Triple inducement zones (yellow circles = retail trap triggers)
✅ Perfect bounce off the strong low (3,298.783)
✅ Price projected to react off FVG and then target the weak high + buy-side liquidity
✅ Target aligned with a -27% Fibonacci extension, i.e., 3,369.600
📈 Price Roadmap:
Current PA pushing up to break the Weak High
Slight retrace or reaction from the Fair Value Gap
Continuation bullish leg towards Buy-Side Liquidity: 3,345.470
Final extended TP at 3,369.600
🎯 Trade Plan (Long Idea):
Entry: Upon retrace into FVG (ideally between 3,314.560 – 3,312.046)
Stop Loss: Below the strong low (~3,298.783)
TP1: Weak High → 3,330s
TP2: Buy-side liquidity sweep → 3,345.470
TP3: Fib extension at → 3,369.600
RRR: Solid 1:4+ potential
🧠 Institutional Insight:
Smart Money is using retail trendline breakouts and fake resistance levels to stack orders before the real move. This play is all about accumulation + imbalance correction + liquidity run.
💬 If you’re watching Gold, drop a 🔐 or “XAU MOVE” in the comments!

USDCAD: Bearish Continuation Ahead 🇺🇸🇨🇦
USDCAD completed a consolidation within a horizontal range.
A violation of its support and a daily candle close below that
is a strong bearish signal.
I believe that the price may drop lower next week
and reach at least 1.3655 level.
❤️Please, support my work with like, thank you!❤️
I am part of Trade Nation's Influencer program and receive a monthly fee for using their TradingView charts in my analysis.

Learn TOP 3 Elements of a Perfect SWING TRADE (GOLD, FOREX)
In the today's post, I will share with you a formula of ideal swing trading setup.
✔️Element 1 - Market Trend
When you are planning a swing trade, it is highly recommendable that the direction of your trade would match with the direction of the market trend.
If the market is trading in a bullish trend, you should look for buying the market while if the market is bearish, you should look for shorting.
Take a look at CHFJPY pair on a daily. Obviously, the market is trading in a bullish trend and your should look for swing BUYING opportunity.
✔️Element 2 - Key Level
You should look for a trading opportunity from a key structure.
IF the market is bullish, you should look for buying from a key horizontal or vertical SUPPORT, WHILE if the market is bearish, you should look for shorting from a key horizontal or vertical RESISTANCE.
CHFJPY is currently approaching a rising trend line - a key vertical support.
Please, note that if the price is NOT on a key structure, you should patiently wait for the test of the closest one.
✔️Element 3 - Confirmation
Once the market is on a key level, do not open a trading position blindly. Look for a confirmation - for the sign of strength of the buyers, if you want to buy or for the sign of strength of the sellers, if you are planning to short.
There are dozens of confirmation strategies, one of the most accurate is the price action confirmation.
Analyzing a 4H time frame on CHFJPY, we can spot a falling wedge pattern. While the price is stuck within that, the minor trend remains bearish. Bullish breakout of the resistance of the wedge will be the important sign of strength of the buyers and can be your strong bullish confirmation.
Following these 3 conditions, you will achieve high win rate in swing trading. Try these techniques yourself and good luck in your trading journey.
❤️Please, support my work with like, thank you!❤️
I am part of Trade Nation's Influencer program and receive a monthly fee for using their TradingView charts in my analysis.

USDCAD: 1D Death Cross signals more selling.USDCAD is almost oversold on its 1D technical outlook (RSI = 31.307, MACD = -0.005, ADX = 41.498) as it is having one of the strongest red 1D candles of 2025, which is dominated by a Channel Down pattern. The market formed today a 1D Death Cross and since the new bearish wave started on a 1D MA200 rejection, we expect the selling to continue despite the oversold technical condition. Short and aim for a new -3.80% decline TP = 1.35000.
## If you like our free content follow our profile to get more daily ideas. ##
## Comments and likes are greatly appreciated. ##

Market next target 1. Mislabeling of Support Area
The red box is labeled as a support area, but price is approaching from below, not above—so technically, this should be called a resistance area.
Until price closes above it with volume, it cannot be assumed to act as support.
---
2. Volume Misinterpretation
The volume does not strongly support a breakout. The latest green bars are not significantly larger than prior volume, implying limited bullish conviction.
Lack of volume surge through resistance is often a false breakout indicator.
---
3. Single Scenario Bias
The analysis shows only an upside (bullish) projection, ignoring bearish possibilities.
If price gets rejected from resistance, there’s a strong chance of a pullback to $33.00 or lower, especially with weak momentum.
---
4. No Confirmation Indicators
The chart lacks confirming technical indicators like RSI, MACD, or trendlines to validate the bullish scenario.
Price could be forming a lower high, indicating a possible continuation of the downtrend.

Market next target
1. Misinterpretation of Support Area
Claimed support area has already been broken previously (left of the red box), so it's no longer strong support—it might be better viewed as resistance now.
The bounce from this zone could be a liquidity trap or a fakeout, rather than genuine buying interest.
---
2. Overreliance on a Single Target Zone
The chart implies a clear target zone below, but no Fibonacci, moving average, or volume profile is shown to validate this zone.
A better analysis might include additional tools (like RSI, Bollinger Bands, or Fibonacci levels) to confirm this as a realistic target.
---
3. Volume Analysis Oversight
There is a volume spike on the most recent bullish candles, which could indicate strong buying interest, contradicting the downtrend expectation.
This might suggest a potential breakout above resistance instead of a fall.
---
4. No Risk Management Consideration
The chart lacks stop-loss levels or invalidation points, which is crucial for trading strategies.
Without a clear invalidation, the trade idea becomes more speculative.
---
5. Alternative Scenario Missing
A bullish breakout scenario (above resistance zone) isn’t given enough weight.
Given the recent strength, there is a strong case for continuation upward if the price closes above the red box with volume.
USDJPY Trade Setup – H1 Chart📉The pair continues to respect its descending channel, recently rejecting the upper trendline and testing the Adaptive Moving Average (AMA).
📊 Additionally, the Chaikin Oscillator has dipped below zero, signaling weakening buying pressure.
#TradeIdea
🔽 Sell USDJPY on confirmed consolidation below 143.200
🎯 TP1: 142.400
🎯 TP2: 142.000

GBPUSD: The Next Historic Resistances 🇬🇧🇺🇸
GBPUSD keeps rising.
Here are the next historic resistance that the price
may head towards.
Resistance 1: 1.359 - 1.365 area
Resistance 2: 1.375 - 1.383 area
Resistance 3: 1.390 - 1.400 area
Resistance 4: 1.419 - 1.425 area
Resistance 1 is most likely going to be the next goal for the bulls for now.
❤️Please, support my work with like, thank you!❤️
I am part of Trade Nation's Influencer program and receive a monthly fee for using their TradingView charts in my analysis.

Market target 1. Support Area Assumption
Disruption: The highlighted support area is relatively narrow and based on a few candles. On a 1-hour chart, this might not provide a strong enough foundation for a meaningful bounce. The price has tested this level multiple times, suggesting weakening support rather than strength.
2. Target Projection
Disruption: The target area is drawn without showing how it was calculated—no Fibonacci level, previous resistance, or volume zone is referenced. Without clear technical justification, the target level appears speculative.
3. Pattern Expectation (Bounce Prediction)
Disruption: The blue arrow suggests a bullish reversal, but volume is declining, and there’s no strong bullish candle yet to confirm the move. In fact, multiple lower highs suggest bearish pressure.
4. Ignoring Bearish Continuation
Disruption: The red arrow suggesting a drop isn't emphasized as strongly as the bullish path. However, repeated testing of the support with no significant bounce increases the risk of a breakdown. Also, if macroeconomic conditions or broader crypto sentiment is bearish, this chart setup could break down easily.
5. Lack of Context
Disruption: The chart analysis is isolated to a short timeframe (1 hour). Without higher timeframe confluence (e.g., 4H, Daily), any short-term pattern can easily be a false signal.
Market next move Current Analysis Summary:
Bullish Outlook: The chart suggests a bullish trend after price moves above a marked support area.
Price Scenarios:
Red arrow: Pullback to support.
Blue arrow: Bounce back upward.
Yellow arrow: Continuation of the bullish trend.
---
Disruption of the Analysis:
1. False Breakout Risk:
The move above the support zone might be a false breakout. Volume does not appear significantly increased during the breakout, which is typically needed to confirm real breakout momentum.
2. Volume Confirmation Lacking:
Although some volume is present, the breakout does not show a clear volume spike to validate strong buying interest, which challenges the bullish bias.
3. Resistance Overhead Ignored:
No mention of overhead resistance. The price may face selling pressure near 1.35000, a likely psychological and technical resistance area.
4. Over-reliance on Simple Support Zone:
The support zone is too narrowly defined. If the price dips below it slightly, it could still be a healthy retest, not a reversal, which the red arrow path implies prematurely.

GBP/JPY (Trade Recap) and EUR/JPY ShortEUR/JPY Short
Minimum entry requirements:
• If structured 1H continuation forms, 1H risk entry within it.

Market next move Original Analysis Summary:
Price has entered a support area and is expected to bounce.
Two possible bullish paths (blue & yellow arrows) suggest a continuation toward the marked target zone.
---
Disruption Thesis: Bearish Reversal Setup
1. Overextended Rally Into Resistance
The move up into the “support area” is sharp and fast, suggesting it's a liquidity grab.
This zone might actually be a supply zone, where smart money is offloading.
Disruption Call: Price could stall or reverse sharply from this area due to lack of follow-through volume.
---
2. Volume Profile Weakness
Volume peaked earlier in the rally and is now diminishing, which often signals buyer exhaustion.
Disruption Call: Fading bullish momentum implies a fakeout, not a breakout.
---
3. False Breakout / Bull Trap
The green arrow assumes a bounce, but price may just be hovering to bait longs before dropping.
Previous swing highs near 1.1320 may act as a strong rejection point.
Disruption Call: A sudden drop below 1.1300, with a new bearish wave back to 1.1250 or lower.
