Market next target 🚀 Bullish Disruption Analysis
1. Support Holds Above 35.80
The market may dip slightly but find strong support around the 35.90–36.00 zone.
Instead of continuing lower, buyers absorb the selling pressure, leading to a sharp bullish reversal.
2. Bullish Continuation After Consolidation
The current pullback could just be a healthy retracement following the strong recovery move from the previous dip.
This could form a bullish flag or ascending triangle, eventually breaking above 36.20 and pushing higher.
3. Volume Clue
If the pullback happens with declining red volume, while previous green candles had strong volume, it signals a temporary correction rather than a trend reversal.
Watch for a bullish engulfing candle backed by strong volume to confirm.
4. Macro Trigger / Fundamental Support
Any dovish signal from the Fed, rising inflation, or weakening USD could increase investor demand for silver, pushing prices back up.
A news-driven reversal could invalidate the bearish path quickly.
5. Bullish Price Target
If buyers take control, silver could retest and break above 36.30–36.40, aiming toward 36.60 or even 36.80.
Forextrading

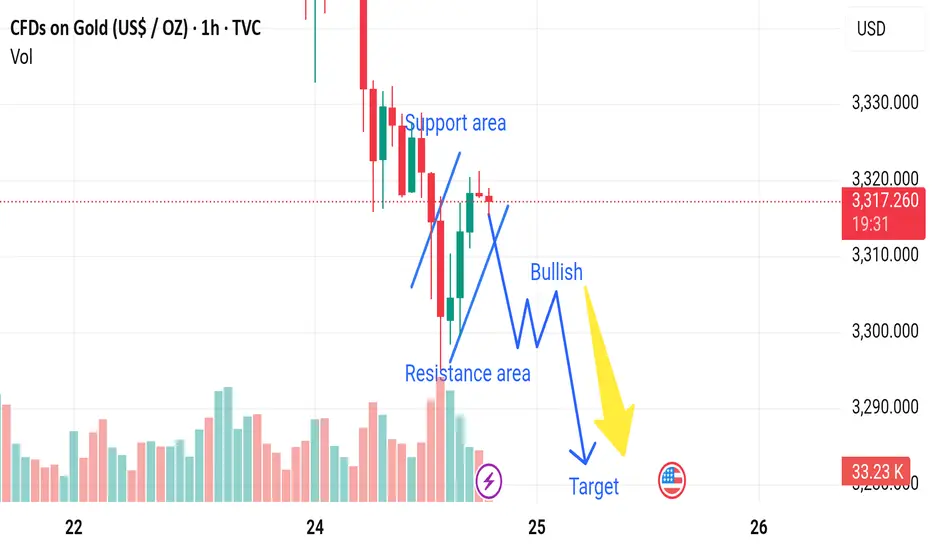
Market next move 🔻 Bearish Disruption Analysis
1. False Breakout / Bull Trap
The price might briefly break above the red resistance zone (highlighted), triggering buy orders.
However, instead of continuing higher, sellers step in aggressively, pushing the price back below resistance.
This would form a fakeout or bull trap, catching breakout buyers off-guard.
2. Volume Divergence
Look at the volume at the breakout: if the breakout occurs on declining or weak volume, it's a warning sign that the move lacks conviction.
The breakout may not sustain without strong volume backing it.
3. Lower High Formation
If the price fails to make a higher high above the previous peak (~3,340-3,345), and reverses downward, it indicates buying exhaustion.
4. MACRO/FUNDAMENTAL Trigger
Sudden news (e.g., strong USD data, interest rate hike comments from the Fed, or geopolitical tension easing) could cause a sharp sell-off in gold.
This would invalidate the bullish pattern entirely.
5. Bearish Price Target
If the disruption plays out, price could drop back to 3,300 or below, especially if support is weak.
A confirmed lower low below 3,310 would suggest a larger bearish structure

AUD/USD Shows Bullish Hints, Can Gains Be Sustained?Market Analysis: AUD/USD Shows Bullish Hints, Can Gains Be Sustained?
AUD/USD started a decent increase above the 0.6440 and 0.6465 levels.
Important Takeaways for AUD/USD Analysis Today
- The Aussie Dollar rebounded after forming a base above the 0.6370 level against the US Dollar.
- There was a break above a key bearish trend line with resistance at 0.6470 on the hourly chart of AUD/USD at FXOpen.
AUD/USD Technical Analysis
On the hourly chart of AUD/USD at FXOpen, the pair started a fresh increase from the 0.6370 support. The Aussie Dollar was able to clear the 0.6400 resistance to move into a positive zone against the US Dollar.
There was a close above the 0.6440 resistance and the 50-hour simple moving average. There was a break above a key bearish trend line with resistance at 0.6470. Finally, the pair tested the 0.6520 zone. A high was formed near 0.6519 and the pair recently started a consolidation phase.
The pair dipped and tested the 23.6% Fib retracement level of the upward move from the 0.6372 swing low to the 0.6519 high.
On the downside, initial support is near the 0.6485 level. The next major support is near the 0.6465 zone. If there is a downside break below the 0.6465 support, the pair could extend its decline toward the 0.6445 level. It is close to the 50% Fib retracement level.
Any more losses might signal a move toward 0.6405. On the upside, the AUD/USD chart indicates that the pair is now facing resistance near 0.6520. The first major resistance might be 0.6550. An upside break above 0.6580 might send the pair further higher.
The next major resistance is near the 0.6600 level. Any more gains could clear the path for a move toward 0.6650.
This article represents the opinion of the Companies operating under the FXOpen brand only. It is not to be construed as an offer, solicitation, or recommendation with respect to products and services provided by the Companies operating under the FXOpen brand, nor is it to be considered financial advice.

GBPUSD Price Action Analysis | Sell Setup Below 1.36106In this GBPUSD market overview, we break down recent price action following yesterday’s strong bullish rally from the momentum low. The session was highly emotional across major forex pairs, which is typical when a major wave structure reaches its end. This often results from incomplete auctions on one side of the market, causing order flow imbalances that drive sharp price movements.
The key price level we're watching on GBPUSD is 1.36326. Price approached this zone with momentum, and the rejection at 1.36267 triggered a classic TCP (Trend Changing Pattern), followed by a single upside break, confirming exhaustion at the highs.
📉 Sell Setup:
According to the Waves of Success execution model, the best short entry is below 1.36106, in alignment with the prevailing bearish structure.
⚠️ Alternative Scenario:
We are not looking for long setups on GBPUSD at this time — our bias remains bearish unless significant structure changes occur.
This analysis combines wave structure, trend confirmation patterns, and institutional price levels for a professional, risk-managed approach.
🔑 Key Levels:
Resistance: 1.36326
Rejection High: 1.36267
Sell Trigger: 1.36106

EURCHF: Bearish Continuation After Breakout 🇪🇺🇨🇭
EURCHF violated a significant horizontal support.
Retesting that, a bearish flag pattern was formed.
Its support violation provides a strong intraday confirmation.
The pair may drop lower at least to 0.9328
❤️Please, support my work with like, thank you!❤️
I am part of Trade Nation's Influencer program and receive a monthly fee for using their TradingView charts in my analysis.

Market next target ⚠️ Disruption Analysis – BTC/USDT
1. False Bullish Narrative
The chart labels the structure as “Bullish”, yet recent price action shows:
A strong rejection near 106,000.
Followed by multiple red candles with increasing volume — a common sign of sell pressure re-entering the market.
The bullish label may be premature or misleading based on this momentum shift.
2. Bearish Structure Developing
The price is starting to form a lower high after the sharp drop.
The outlined path resembles a head-and-shoulders pattern in early development, often preceding a bearish breakdown.
The breakdown could lead directly to the "Target" zone or even below if momentum increases.
3. Volume Divergence
The volume spike during the pump was not sustained. Post-spike, volume is declining on green candles, suggesting buyers are exhausted.
Sellers are likely using liquidity at the top to exit positions, not initiate new longs.
4. Support Turned Resistance
The red boxes mark failed support zones which now may act as resistance.
If price attempts to retest these zones and fails, it would confirm bearish control and validate the downward path toward the target (104,400–104,000).

Market next target ⚠️ Disruption Analysis – BTC/USD
1. Questionable Bullish Bias
The chart labels the structure as "Bullish," but the current setup looks more like a potential distribution phase than a healthy continuation pattern.
The price is moving sideways with declining volume, suggesting buyers are losing strength.
2. Volume Discrepancy
Notice the spike in volume during the sharp move up, followed by flat candles and lower volume.
This is typical of a "pump and fade" structure, where large players exit after a rapid price move, leaving retail traders with poor entries.
3. Resistance Not Clearly Broken
Price failed to sustain above 105,800–106,000, indicating that the resistance zone remains valid.
The recent rejection candles near this level suggest sellers are active and overhead pressure is strong.
4. Descending Into Compression
The blue "descending" structure before the sideways move may signal a bearish flag or a pause before further downside—not necessarily a bullish sign.
5. False Reversal Warning
The bullish pattern drawn with zig-zags (implying consolidation before continuation) could actually be setting up a bull trap.
If price fakes a bounce and then breaks below 104,800, a sharper decline toward the 103,000 target could accelerate quickly.

Market next target ⚠️ Disruption Analysis – USD/JPY
1. Sideways/Flat Price Action
Price is consolidating in a tight range with small-bodied candles.
This indicates indecision and lack of momentum, not strength.
The upward arrows suggest bullish bias, but no strong signal confirms a breakout yet.
2. Bearish Momentum
The recent red candles dominate, showing a clear drop from above 146.000 earlier.
The overall trend (short-term) is down, and the support area could be tested again.
3. Decreasing Volume
Volume is fading out, especially the most recent bar (around 1.01K).
This suggests waning interest—any bullish breakout without volume support is likely to fail or reverse.
4. Resistance Area is Strong
The resistance zone near 145.800–146.000 is clearly tested before and held.
Without a significant catalyst, it's unlikely to break in the near term.
5. False Breakout Risk Above Target
The marked "target" just below resistance could trigger false bullish entries.

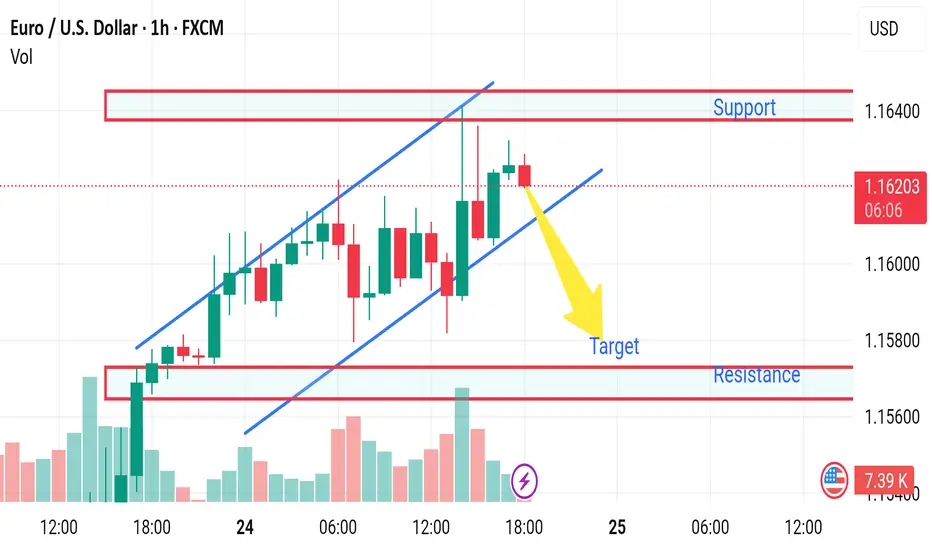
Market next move ⚠️ Disruption Analysis of the Chart
1. False Breakout Risk
The price is currently within an ascending channel, which is often seen as bullish.
However, the recent candlesticks show smaller bodies with wicks on top, indicating buyer exhaustion.
A false breakout above the upper trendline or support around 1.3632 could trap buyers before a sharp reversal.
2. Low Volume Confirmation
Volume peaked earlier but has significantly decreased in the last few candles.
Weak volume during a price rise signals a lack of conviction, increasing the likelihood of a pullback.
3. Resistance Flip Not Confirmed
The level around 1.3600 is marked as resistance-turned-support, but there is no strong retest confirmation yet.
If price revisits this zone and fails to bounce, this support could break, leading to a downside reversal.
4. Divergence Watch
While not visible in this static image, if you overlay RSI or MACD, there could be signs of bearish divergence (price making higher highs while momentum indicators make lower highs).
This is often a leading indicator of trend weakening.

Market next target 🔁 Disrupted Analysis (Bullish Scenario Instead of Bearish)
1. Price in an Upward Channel:
The price remains within a clear ascending channel, respecting both upper and lower bounds.
The bearish arrow prematurely predicts a breakdown while no support break has occurred.
2. Strong Bullish Momentum:
Price is making higher highs and higher lows, a textbook bullish structure.
The recent dip respected the lower trendline and was followed by strong green candles.
3. Volume Confirmation:
Notice the increasing bullish volume on the recent push higher.
That suggests buyers are still in control, contradicting the bearish prediction.
4. Invalidation of Bearish Breakdown:
Until the lower blue trendline is clearly broken with volume, the bearish target is speculative.
Support is holding at 1.1610–1.1600 zone, which may become a launchpad for further gains.
EURUSD: Can it reach 1.1900?EURUSD is bullish on its 1D technical outlook (RSI = 65.234, MACD = 0.006, ADX = 20.419) and is going for a 3 week high. This is technically a long term bullish wave (since the January 13th 2025 low) on the 3 year Channel Up. We anticipate that this wave will go for the pattern's high by the end of the year, and being limited by the 7 year LH trendline, we expect to aim for at least 1.1900. The 1W RSI has started to post a sequence that resembles the last 3 major ones.
## If you like our free content follow our profile to get more daily ideas. ##
## Comments and likes are greatly appreciated. ##

Market next move 🔁 Disrupted Analysis (Bullish Scenario Instead of Bearish)
1. Support Holding Firm:
The analysis assumes the price will drop after failing resistance, but the current price action is showing higher lows, suggesting accumulation.
The support area has been tested multiple times, showing strength.
2. Volume Analysis Contradiction:
Recent green volume bars indicate buying interest at lower levels.
No significant volume spike on the last downward leg, suggesting lack of strong selling pressure.
3. Potential Inverted Head and Shoulders:
The current formation could be the right shoulder of an inverted head and shoulders pattern, a classic bullish reversal setup.
If confirmed, this could lead to a breakout above the resistance area, not a drop.
4. Trendline Breakout Watch:
There's a potential bullish breakout of the descending trendline.
A break above 3,320 USD could invalidate the bearish thesis and suggest a target near 3,340–3,350 USD.

Market next target 🔁 Disrupted Analysis (Bullish Scenario Instead of Bearish)
1. Support Holding Firm:
The analysis assumes the price will drop after failing resistance, but the current price action is showing higher lows, suggesting accumulation.
The support area has been tested multiple times, showing strength.
2. Volume Analysis Contradiction:
Recent green volume bars indicate buying interest at lower levels.
No significant volume spike on the last downward leg, suggesting lack of strong selling pressure.
3. Potential Inverted Head and Shoulders:
The current formation could be the right shoulder of an inverted head and shoulders pattern, a classic bullish reversal setup.
If confirmed, this could lead to a breakout above the resistance area, not a drop.
4. Trendline Breakout Watch:
There's a potential bullish breakout of the descending trendline.
A break above 3,320 USD could invalidate the bearish thesis and suggest a target near 3,340–3,350 USD.
EURNZD: Time to Grow 🇪🇺🇳🇿
EURNZD is strongly bullish after a test of a key horizontal support.
A bullish violation of a resistance line of a falling channel provide
a strong bullish signal.
Goal - 1.936
❤️Please, support my work with like, thank you!❤️
I am part of Trade Nation's Influencer program and receive a monthly fee for using their TradingView charts in my analysis.

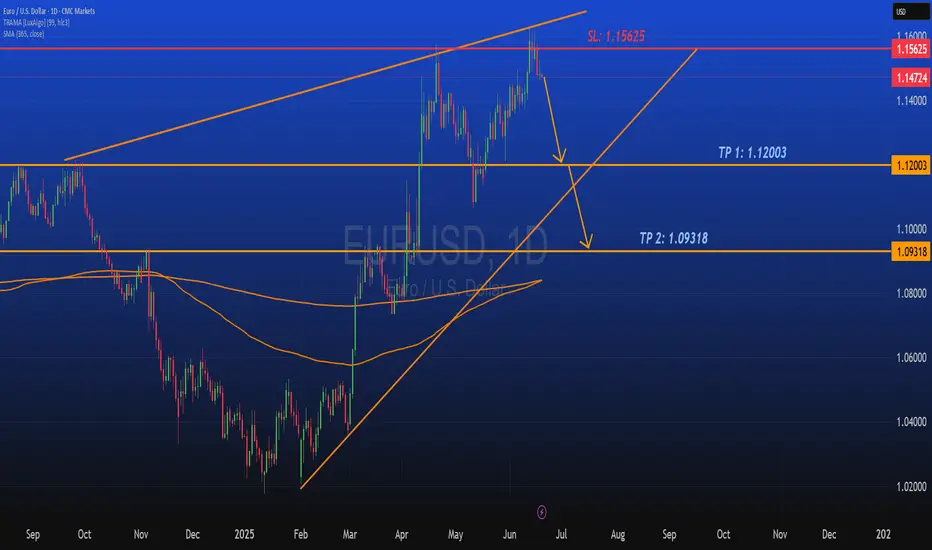
EURUSD Short Part IIEURUSD Analysis
On EURUSD daily chart from CMC Markets quota, indicates a bullish trend with a symmetrical triangle pattern forming. The price has recently broken above a key resistance level, suggesting potential for continued upward movement.
Key Price Levels
Current Price: 1.16932
Stop Loss (SL): 1.16549
Take Profit 1 (TP1): 1.12003
Take Profit 2 (TP2): 1.09318
Trend Analysis
EURUSD shows clear signs on an ascending trend supported by higher lows and higher highs since early 2025. Both orange trend-lines which I created form a symmetrical triangle, with the price nearing the apex, hinting at a potential breakout or reversal which I have been looking for a reversal bearish breakout.
The upward momentum is strong, but the proximity to the upper trend-line and set take-profit levels indicates preparation for a possible correction. I still believe in shorts on EURUSD.
Conclusion
Traders and investors should monitor the price action near the triangle apex for breakout confirmation. The set stop loss and take-profit levels provide a structured approach to managing the trade, balancing potential gains with risk mitigation. Stay tuned for more updates on the trade.

EURUSD Sell/ShortFundamental Analysis
EURUSD rates is being influenced by the current Eurozone's economic performance, driven by key economies like Germany and France, continues to be shaped by industrial output, consumer confidence, and inflation trends. The European Central Bank (ECB) has likely maintained a cautious monetary policy, with interest rates possibly held steady or adjusted slightly to combat inflation while supporting growth. On the U.S. side, the Federal Reserve's stance on interest rates, potentially in a tightening phase to address persistent inflation plays a critical role. Recent U.S. economic data, including GDP growth, employment figures, and consumer spending, may indicate a robust dollar, putting downward pressure on EURUSD. Additionally, geopolitical tensions, energy prices (affecting Eurozone energy imports), and trade balances between the U.S. and EU are likely contributing to volatility. Given the current date, recent ECB and Fed statements or data releases for June 2025 inflation reports.
Technical Analysis:
Based on the provided EURUSD 1D chart (covering mid-2024 to mid-2025), the following technical observations can be made:
Trend and Moving Averages:
For EURUSD it shows a descending trend from a peak around 1.48 in mid-2024, with a potential reversal or consolidation forming in mid-2025. The 50-day and 200-day moving averages (depicted as orange lines) are sloping downward, with the price recently testing these levels around 1.12-1.13. A break above the shorter-term moving average could signal bullish momentum, while a failure to hold might confirm a continuation of the downtrend. Looking for key support levels here are identified at 1.09318 (TP 2) and 1.08000, with the current price hovering near 1.12003 (TP 1). Resistance is notable at 1.15625 (SL) and the previous high near 1.4800. The price action suggests a potential bounce from the recent low, with the next target being the resistance zone around 1.15625 if bullish momentum persists. Candlesticks and volume patterns are showing a recent green candlesticks indicate buying pressure, potentially forming a reversal pattern near the 1.12 level. Volume analysis would confirm the strength of this move, with higher volume on upticks supporting a breakout.
Overall Bias:
The technical setup suggests a short-term bullish correction within a broader bearish trend, contingent on breaking and holding above 1.15625. A drop below 1.09318 would invalidate the bullish case and resume the downtrend toward 1.08000 or lower.
Sentiment Analysis
Market sentiment as of June 2025 likely reflects heightened interest in EUR/USD due to recent economic data and central bank policies. Traders and analysts are closely watching for signs of ECB rate cuts or Fed rate hikes, which could sway the pair. On social platforms and financial forums, there may be a mix of caution and optimism looking out for caution due to the Eurozone's economic challenges (energy costs, political uncertainty), and optimism if U.S. data softens, weakening the dollar. The chart's visibility on trading platforms suggests retail and institutional traders are actively monitoring this pair, with a focus on the 1.12-1.16 range as a critical decision point. Sentiment could shift rapidly based on upcoming economic releases or geopolitical developments.
Conclusion
The EUR/USD pair is at a pivotal juncture, with fundamentals pointing to a stronger USD due to Fed policy, while from a technical standpoint suggest a short-term bounce toward 1.15625 if support at 1.12003 holds. Sentiment indicates active trader interest, with eyes on central bank moves. A break above resistance could target 1.4800 (long-term), while a failure might see a decline to 1.08000. Monitor upcoming data for confirmation.
EUR/AUD Short, EUR/NZD Short, NZD/USD Long and AUD/NZD ShortEUR/AUD Short
Minimum entry requirements:
- If tight non-structured 1H continuation forms, 15 min risk entry within it if the continuation is structured on the 15 min chart or reduced risk entry on the break of it.
- If tight structured 1H continuation forms, 1H risk entry within it or reduced risk entry on the break of it.
EUR/NZD Short
Minimum entry requirements:
- If tight non-structured 1H continuation forms, 15 min risk entry within it if the continuation is structured on the 15 min chart or reduced risk entry on the break of it.
- If tight structured 1H continuation forms, 1H risk entry within it or reduced risk entry on the break of it.
NZD/USD Long
Minimum entry requirements:
- If tight non-structured 1H continuation forms, 15 min risk entry within it if the continuation is structured on the 15 min chart.
- If tight structured 1H continuation forms, 1H risk entry within it.
AUD/NZD Short
Minimum entry requirements:
- If tight non-structured 1H continuation forms, 15 min risk entry within it if the continuation is structured on the 15 min chart.
- If tight structured 1H continuation forms, 1H risk entry within it.

XAU/USD Double Bottom Breakout Bullish Momentum Incoming!XAU/USD Double Bottom Breakout 💥 | 🚀 Bullish Momentum Incoming!
Analysis:
🟡 Double Bottom Pattern: Two clear lows have formed around the $3,340 support, signaling a potential reversal.
🟦 Accumulation Zone: The price consolidated in a range, indicating strong buying interest before the breakout.
🟣 Bullish Momentum: Recent aggressive bullish candles show strong buying pressure.
📈 Breakout & Retest Zone: If the price holds above $3,370, a bullish continuation toward $3,409 and possibly $3,445 is expected.
🧭 Target Area: Marked with a blue box, the upside potential is clearly projected.
Conclusion:
A successful retest of the breakout level may lead to a strong bullish run. Keep an eye on $3,370 as the pivot zone. 🎯

GBPCHF: Pullback From Support 🇬🇧🇨🇭
GBPCHF is going to pull back from a wide daily support cluster.
I see a strong intraday bullish confirmation and a bullish
imbalance candle after the news.
Goal - 1.0986
❤️Please, support my work with like, thank you!❤️
I am part of Trade Nation's Influencer program and receive a monthly fee for using their TradingView charts in my analysis.

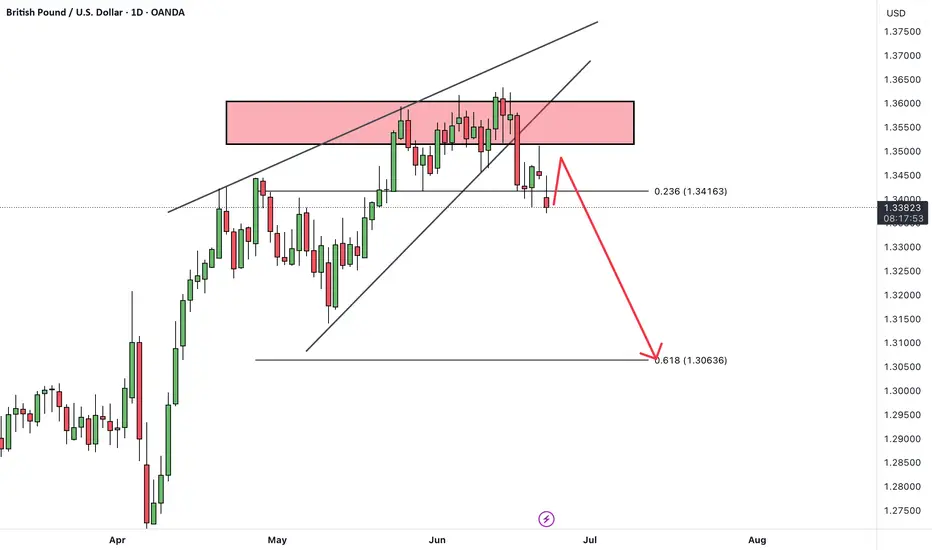
GBPUSDHello Traders! 👋
What are your thoughts on GBPUSD?
On the GBPUSD chart, we can see that the price has repeatedly tested a key resistance zone but failed to break above it, resulting in multiple rejections.
After forming a rising wedge pattern, the pair has broken down below the wedge, and is now completing a pullback toward the broken trendline.
We expect that after some consolidation in this area and completion of the pullback, the price will likely resume its decline toward lower targets.
As long as price remains below the resistance zone and broken trendline, the bearish scenario remains valid.
Is the pullback complete and ready for the next leg down? Share your view below! 🤔👇
Don’t forget to like and share your thoughts in the comments! ❤️
Market Analysis: USD/CAD Breaks HigherMarket Analysis: USD/CAD Breaks Higher
USD/CAD is rising and might aim for more gains above the 1.3765 resistance.
Important Takeaways for USD/CAD Analysis Today
- USD/CAD is showing positive signs above the 1.3720 support zone.
- There is a key bullish trend line forming with support at 1.3740 on the hourly chart at FXOpen.
USD/CAD Technical Analysis
On the hourly chart of USD/CAD at FXOpen, the pair formed a strong support base above the 1.3540 level. The US Dollar started a fresh increase above the 1.3600 resistance against the Canadian Dollar.
The bulls pushed the pair above the 1.3640 and 1.3700 levels. The pair cleared the 50-hour simple moving average and climbed above 1.3750. A high was formed at 1.3766 and the pair is now consolidating.
Initial support is near the 1.3740 level. There is also a key bullish trend line forming with support at 1.3740. The next major support is near the 1.3710 level or the 23.6% Fib retracement level of the upward move from the 1.3539 swing low to the 1.3766 high.
The main support sits near the 1.3650 zone on the USD/CAD chart. It is near the 50% Fib retracement level.
A downside break below the 1.3650 level could push the pair further lower. The next major support is near the 1.3595 support zone, below which the pair might visit 1.3540.
If there is another increase, the pair might face resistance near the 1.3765 level. A clear upside break above 1.3765 could start another steady increase. The next major resistance is the 1.3800 level. A close above the 1.3800 level might send the pair toward the 1.3880 level. Any more gains could open the doors for a test of the 1.4000 level.
This article represents the opinion of the Companies operating under the FXOpen brand only. It is not to be construed as an offer, solicitation, or recommendation with respect to products and services provided by the Companies operating under the FXOpen brand, nor is it to be considered financial advice.

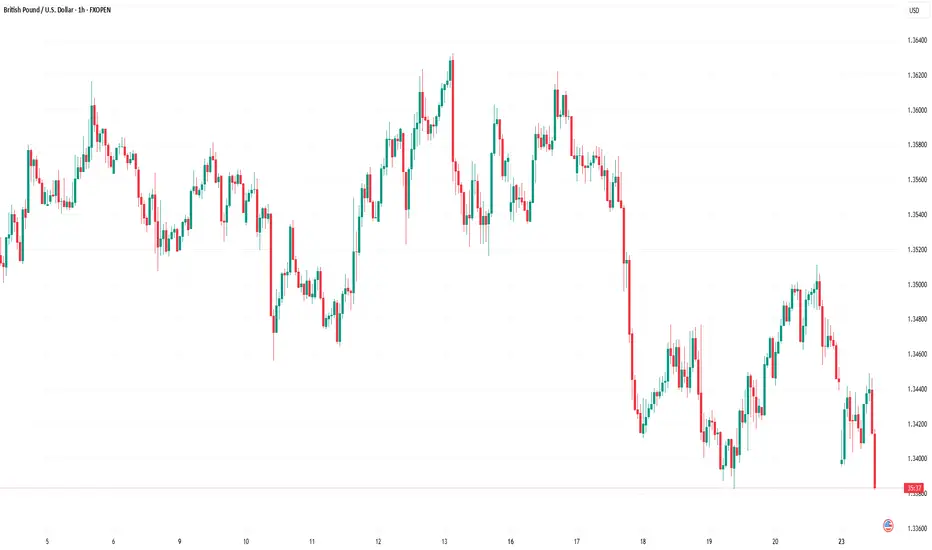
Market Analysis: GBP/USD Dips Below SupportMarket Analysis: GBP/USD Dips Below Support
GBP/USD started a fresh decline below the 1.3620 zone.
Important Takeaways for GBP/USD Analysis Today
- The British Pound started another decline from the 1.3620 resistance zone.
- There was a break below a connecting bullish trend line with support at 1.3460 on the hourly chart of GBP/USD at FXOpen.
GBP/USD Technical Analysis
On the hourly chart of GBP/USD at FXOpen, the pair struggled to continue higher above the 1.3620 resistance zone. The British Pound started a fresh decline and traded below the 1.3550 support zone against the US Dollar, as discussed in the previous analysis.
The pair even traded below 1.3500 and the 50-hour simple moving average. Finally, the bulls appeared near the 1.3380 level. There was a recovery wave above the 1.3450 level and the 23.6% Fib retracement level of the downward move from the 1.3622 swing high to the 1.3382 low.
However, the bears were active near the 1.3500 zone and the 50% Fib retracement level. As a result, there was a fresh bearish reaction below a connecting bullish trend line with support at 1.3460.
Initial support on the GBP/USD chart sits at 1.3380. The next major support is at 1.3350, below which there is a risk of another sharp decline. In the stated case, the pair could drop toward 1.3200.
Immediate resistance on the upside is near 1.3440. The first major resistance is near the 1.3500 zone. The main hurdle sits at 1.3530. A close above the 1.3530 resistance might spark a steady upward move. The next major resistance is near the 1.3565 zone. Any more gains could lead the pair toward the 1.3620 resistance in the near term.
This article represents the opinion of the Companies operating under the FXOpen brand only. It is not to be construed as an offer, solicitation, or recommendation with respect to products and services provided by the Companies operating under the FXOpen brand, nor is it to be considered financial advice.
EUR/AUD ShortEUR/AUD Short
Minimum entry requirements:
- 1H impulse down below area of interest.
- If tight non-structured 5 min continuation follows, reduced risk entry on the break of it.
- If tight structured 5 min continuation follows, reduced risk entry on the break of it or 5 min risk entry within it.
- If tight non-structured 15 min continuation follows, 5 min risk entry within it if the continuation is structured on the 5 min chart or reduced risk entry on the break of it.
- If tight structured 15 min continuation follows, reduced risk entry on the break of it or 15 min risk entry within it.
