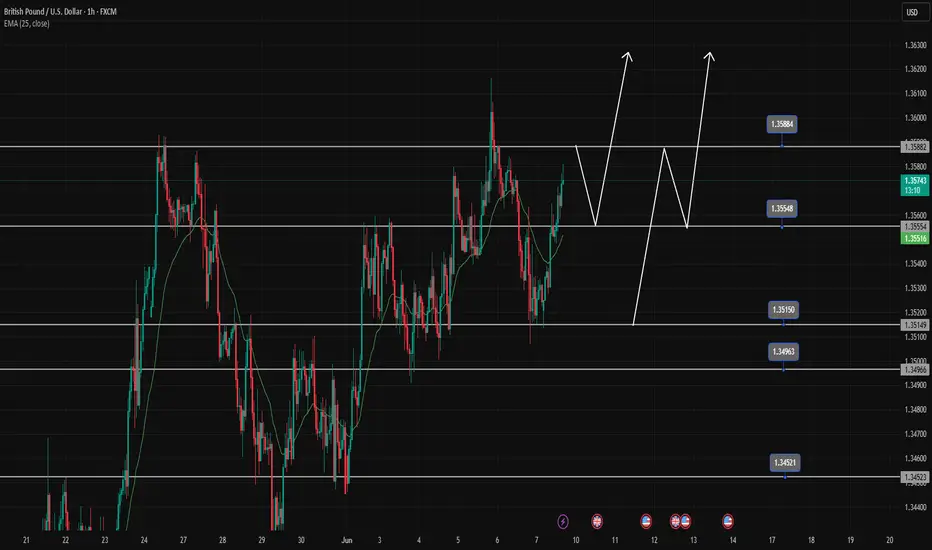
Buy opportunity when price retraces to break the topGBPUSD encounters resistance at 1.358, there is a high possibility that there will be a price reaction to 1.35500 to create a Dow break 1.358 towards higher levels.
GBPUSD is increasing very strongly again in the main trend, we wait for a retracement to the support zones, which is a strong buying opportunity.
1.358-1.355-1.351-1.345 are BUY zones when the price has a reaction of buying force at these price zones.
Forextrading
USD/JPY Short, AUD/NZD Short, AUD/JPY Neutral and EUR/USD ShortUSD/JPY Short
Minimum entry requirements:
- If tight non-structured 5 min continuation forms, reduced risk entry on the break of it.
- If tight structured 5 min continuation forms, reduced risk entry on the break of it or 5 min risk entry within it.
- If tight non-structured 15 min continuation forms, 5 min risk entry within it if the continuation is structured on the 5 min chart or reduced risk entry on the break of it.
- If tight structured 15 min continuation forms, reduced risk entry on the break of it or 15 min risk entry within it.
AUD/NZD Short
Minimum entry requirements:
- If tight non-structured 15 min continuation forms, 5 min risk entry within it if the continuation is structured on the 5 min chart or reduced risk entry on the break of it.
- If tight structured 15 min continuation forms, reduced risk entry on the break of it or 15 min risk entry within it.
AUD/JPY Neutral
Minimum entry requirements:
- If structured 1H continuation forms, 1H risk entry within it.
Minimum entry requirements:
- 1H impulse down below area of value.
- If tight non-structured 5 min continuation follows, reduced risk entry on the break of it.
- If tight structured 5 min continuation follows, reduced risk entry on the break of it or 5 min risk entry within it.
- If tight non-structured 15 min continuation follows, 5 min risk entry within it if the continuation is structured on the 5 min chart or reduced risk entry on the break of it.
- If tight structured 15 min continuation follows, reduced risk entry on the break of it or 15 min risk entry within it.
EUR/USD Short
Minimum entry requirements:
- Tap into area of value.
- 1H impulse down below area of value.
- If tight non-structured 15 min continuation follows, 5 min risk entry within it if the continuation is structured on the 5 min chart or reduced risk entry on the break of it.
- If tight structured 15 min continuation follows, reduced risk entry on the break of it or 15 min risk entry within it.

USDCAD Short Opportunity Description :
USDCAD is setting up for a potential short — I’m watching closely for an upthrust into the highlighted zone to initiate the position. Here’s my current read:
🔍 Technical Breakdown:
1. Trendline Break
Previous bullish trendline broken with conviction. Market structure now vulnerable to bearish continuation.
2. Volume Spike with Selling Pressure
Notable increase in volume on bearish candles — suggests smart money exiting or early sellers stepping in.
3. Anticipating an Upthrust
Watching for price to sweep the highs around 1.3695–1.3700, fail to sustain, and drop back inside range.
This would provide a low-risk entry with tight stops above the highs and 5r+ down to 1.3652, possibly even lower.
📌 Trade Plan:
Entry Zone: 1.3695–1.3700 (after upthrust confirmation)
Stop: Above 1.3710
TP1: 1.3652 (structure low)
TP2: 1.3600 (extended target if momentum builds)
---
🧠 Why This Setup?
This aligns with key principles I trade:
Trendline breaks often lead to retests followed by continuation.
Rising volume on the break is confirmation, not noise.
A failed breakout (upthrust) into previous supply zones is often the "last push" before price collapses.
Let me know if you're seeing something different. This is how I’m planning to attack the chart today.

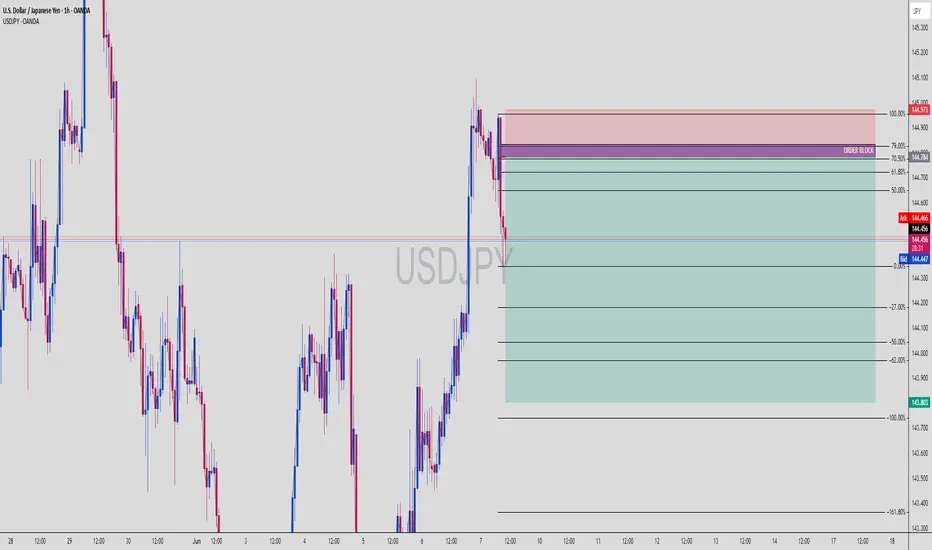
USDJPY Short Setup: OB Rejection + Fib Premium Sell-Off IncomingUSDJPY (1H Chart) | Institutional Short Setup with OB + Fib Confluence
The market is showing clear Smart Money Distribution behavior — with a rejection from a high-confluence zone combining Order Block, Premium Fib Levels, and bearish momentum shift.
🔍 Smart Money Setup Breakdown:
🔻 Bearish Order Block Zone (OB)
Price wicked into OB zone and got instantly rejected
OB located precisely at the 70.5% – 79% premium range
Mark of institutional sell-side interest
📐 Fibonacci Retracement + Premium Zone
Retracement from swing high (144.973) to swing low (144.436)
Premium zone between 61.8% to 79% aligns with OB (144.700–144.973)
Entry taken from this zone for high-probability sell setup
📉 Bearish Confirmation
Aggressive bearish reaction post-OB tap
Market structure flipping bearish
Momentum candle breaks previous bullish leg
🔻 Target Zones (Measured Fib Extensions)
-27%: 144.200
-62%: 144.000
-100%: 143.803
-161.8%: 143.300 (extended liquidity draw)
🧠 Chart Ninja Entry Plan:
🔹 Entry Zone 144.784 – 144.973 (OB + Premium Fib + FVG rejection)
🔻 SL Above 145.000 (above OB wick)
📉 TP 1 144.200 (first fib extension)
📉 TP 2 143.803 (full -100% extension)
⚖️ RRR Approx. 1:4+ — stealthy sniper precision
💬 Pro Tip from the Ninja Dojo:
The market doesn’t move because of indicators — it moves because of liquidity.
Find the OB. Wait for the imbalance. Strike where Smart Money hides. 🥷📊
This isn’t retail — this is calculated execution.
🎯 Save this chart before price melts to 143.8
💬 Drop your entry zone & SL idea in comments
EURUSD: Support & Resistance Analysis For Next Week 🇪🇺🇺🇸
Here is my latest structure analysis
and important supports and resistances for EURUSD
for next week.
Consider these structures for pullback/breakout trading.
❤️Please, support my work with like, thank you!❤️
I am part of Trade Nation's Influencer program and receive a monthly fee for using their TradingView charts in my analysis.

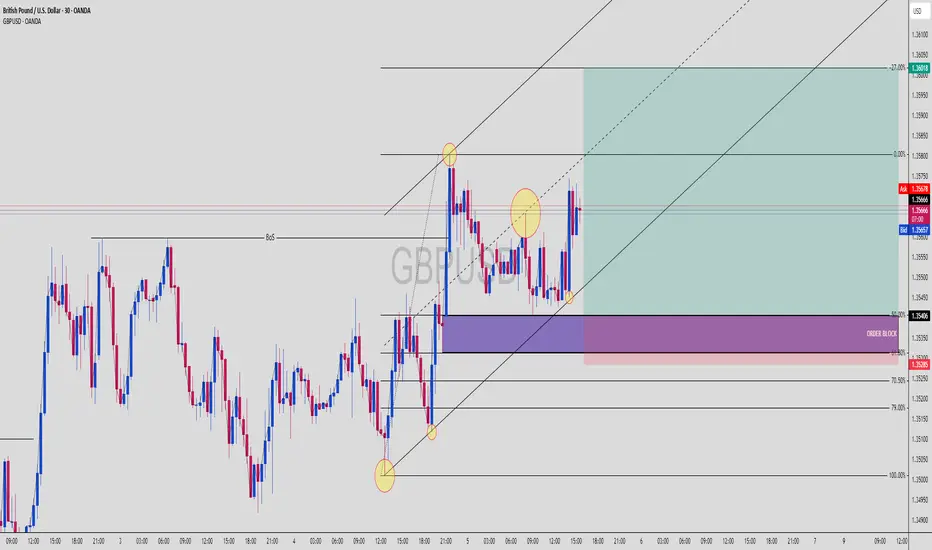
GBPUSD Buy Setup! BoS + OB + 61.8–79% Fib + Trend Channel ComboGBPUSD | 30-Min Chart – High Probability Long Setup Identified
GBPUSD is showing bullish intent after a clear Break of Structure (BoS) and now offers a high-confluence buy opportunity. This setup combines Smart Money Concepts with classical technical analysis for a sniper-grade entry.
🔍 Trade Breakdown:
📈 Break of Structure (BoS):
Price broke previous highs with strong bullish momentum.
Confirmed market intent shift from ranging to bullish.
📐 Fibonacci Confluence:
Price retraced perfectly into the 61.8% – 79% Fib zone from the latest bullish impulse.
These golden ratio levels align with an institutional Order Block (OB) and ascending trendline — high confluence entry.
🟣 Order Block Zone (OB): 1.35285 – 1.35406
The last bearish candle before bullish BoS — a clean demand zone.
OB sits within the Fib retracement zone and overlaps a mid-trendline tap.
📐 Fibonacci Levels (Swing Low to High):
61.8% = 1.35285
70.5% = ~1.35190
79% = ~1.35075
This is the institutional kill zone — OB + 61.8–79% retracement = precision buy levels.
🟡 Liquidity Sweep + Reaction:
Price swept liquidity below short-term lows and tapped the OB with a sharp bullish reaction.
Candle confirmation + lower wick shows strong rejection from Smart Money.
🧭 Projected Move:
Targeting a move toward the -27% Fib extension at 1.36018
Trendline and internal structure support bullish continuation
🔵 Projected Path:
Sweep ➝ OB/Fib confluence tap ➝ strong bullish continuation into premium territory
🧠 Chart Ninja Entry Plan:
🔹 Entry Zone: 1.35285 – 1.35406 (OB + 61.8–70.5% Fib)
🔻 SL Below: 1.35000 (beneath OB & key structure low)
📈 Target: 1.36018 (-27% Fib extension)
⚖️ RRR: 1:3+ — sniper entry with institutional precision
💬 Ninja Wisdom:
Smart Money isn’t buying breakouts — they buy retracements into OB zones with precision.
Combine OB + Fib + channel = institutional roadmap.
Let price come to you. Let retail chase. 🥷💸
📍 Save this GBPUSD setup before it hits the next impulse wave
🗣️ Drop your thoughts – are you buying this OB too?
👣 Follow @ChartNinjas88 for more institutional-grade setups daily
USDJPY: Bullish Outlook For Next Week Explained 🇺🇸🇯🇵
USDJPY completed a consolidation, violating
a resistance line of a horizontal range on a 4H time frame.
I believe that it provides a strong bullish confirmation signal.
The price will most likely go up and reach 146.0 level next week.
❤️Please, support my work with like, thank you!❤️
I am part of Trade Nation's Influencer program and receive a monthly fee for using their TradingView charts in my analysis.

DXY: Approaching a bottom. Wait for the 1D MA50 to break.The U.S. Dollar Index is neutral on its 1D technical outlook (RSI = 45.278, MACD = -0.450, ADX = 23.415) as it seems to be approaching a long term support level, the bottom of the 12 month Channel Down. As long as it stays under the 1D MA50, the trend will remain bearish towards the bottom but once it crosses above, we will turn bullish and aim for a +9.95% bullish wave (TP = 107.000) same as the one before. Notice how similar the 1D RSI fractals are now and the previous bottom in September 2024.
## If you like our free content follow our profile to get more daily ideas. ##
## Comments and likes are greatly appreciated. ##

EURCHF: Fierce consolidation prompts to a bullish breakoutEURCHF is neutral on its 1D technical outlook (RSI = 52.253, MACD = 0.000, ADX = 26.091) as it has been consolidating since the April 25th high. Since then it has failed to close a 1D candle above the 1D MA200. Given the strong presence of the S1 Zone, if we get that closing above the 1D MA200, we will turn bullish, aiming for the 0.618 Fibonacci retracement level (TP = 0.94900), like the March 14th high did.
## If you like our free content follow our profile to get more daily ideas. ##
## Comments and likes are greatly appreciated. ##

Market next move Bearish Disruption Analysis:
1. False Breakout Risk:
The current price is consolidating in a tight range.
The support area may fail to hold due to low volume and indecision (notice the decreasing volume in recent candles).
2. Lower High Formation:
A potential lower high is forming compared to the peak from earlier on June 5.
This could signal a trend reversal or weakening bullish momentum.
3. Volume Divergence:
The bullish candles have lower volume than previous strong moves, indicating a lack of strong buying interest.
4. Support Breakdown Scenario:
If price breaks below the marked support area (~3360), we could see:
Drop toward the 3340 area (next visible support).
Acceleration if stop-losses are triggered below the support zone.
Market next move 🔍 Original Interpretation:
Support Zone: The red rectangle suggests a support level between ~102,800 and ~103,300.
Bullish Bias: The blue arrow anticipates a bounce from this zone, potentially forming a higher low before continuing upward.
Bearish Bias: The red arrow marks a potential resistance, predicting rejection and a move lower if the bullish breakout fails.
---
⚠️ Disruptive Analysis:
1. False Support Breakout Risk:
A false breakdown beneath the support zone could trigger panic selling before a rapid recovery (fakeout).
Traders might place stop-losses just below the box — a perfect target for market makers before price reverses.
2. Volume Deception:
Volume increased during the sell-off but did not show strong absorption by buyers (green volume wasn't dominant).
This suggests sellers still dominate and a continuation lower could occur before any bounce.
3. Lower Highs Formation:
The last few green candles failed to break the previous highs, indicating weaker buying strength.
Price may form a lower high, hinting at a short-term bearish trend.
4. Macro Trend Consideration:
If this is just a retracement within a larger downtrend, the bounce could be short-lived.
Broader market sentiment or macro news could push BTC toward 100,000 support or lower.
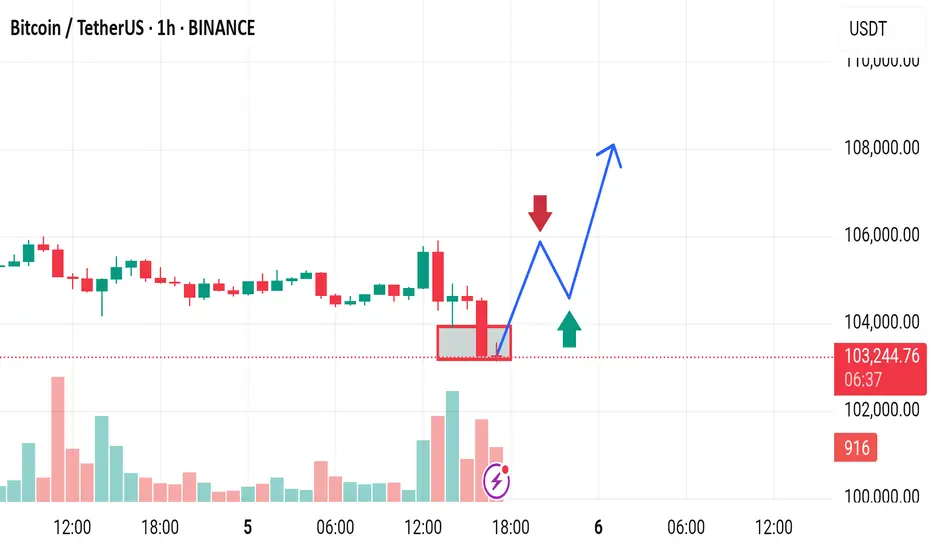
Market next move Disruptive Bearish Scenarios:
1. Support Area Breakdown
The recent strong bearish candle with high volume shows aggressive selling pressure.
If the price fails to hold above the support area and closes below it, especially on high volume, it could invalidate the bullish recovery.
> Bearish Alternative: Price breaks below 103,000, retests it as resistance (bearish flip), and continues down toward 101,000–100,000.
---
2. Lower High Trap
The projected bounce could form a lower high below the 106,000 resistance, creating a classic bearish structure.
> Disruption Path: After a minor recovery toward 104,500–105,000, sellers regain control, and BTC resumes the downtrend.
---
3. Fake Support Bounce
The support area could create a fake-out bounce, tricking long traders before a sharper reversal.
The move up may lack follow-through due to diminishing bullish volume.
EURJPY: Well supported Channel Up aiming for 166.700.EURJPY is bullish on its 1D technical outlook (RSI = 58.535, MACD = 0.340, ADX = 24.438) and is staging right now a rebound on the 1D MA50. This comes only days after the 1D MA200 HL rebound tight at the bottom of the Channel Up. This is a great opportunity to buy and aim for the R1 level (TP = 166.700).
## If you like our free content follow our profile to get more daily ideas. ##
## Comments and likes are greatly appreciated. ##

Market next move Disruption Points:
1. Bullish Accumulation Underway
The recent candles show higher lows and lower volume on red candles, suggesting selling pressure is decreasing.
> Disruptive scenario: Price may bounce off minor support (around 1.3560–1.3570) and form a higher low, triggering a bullish rally back above 1.3620.
---
2. Fake Bearish Setup (Liquidity Trap)
The three arrows predicting a drop might represent a classic retail trap where too many anticipate the same direction.
> Contrary idea: A false breakdown below 1.3550 may occur just to collect stop-losses, followed by a strong reversal upward.
---
3. Divergence Risk
If momentum indicators (e.g., RSI, MACD) show bullish divergence while price moves sideways or dips, it may signal an upcoming bullish impulse.
> Disruption: Downward arrows may be misinterpreting consolidation as weakness rather than a setup for continuation of the previous uptrend.
---
4. Fundamental Wildcard
The chart shows an upcoming U.S. economic event, likely to impact the dollar.
If the data is weak for the USD, GBP/USD could surge sharply, invalidating the bearish scenario.

Market next target 🧨 Disruption Points:
1. Overbought Condition / RSI Divergence
Even though the price is surging (+3.30%), there could be an overbought condition forming.
If RSI or other momentum indicators (not shown here) diverge, it might signal weakness in bullish momentum.
> Disruptive idea: Price may fake the breakout (blue arrow) and then sharply reverse, trapping late buyers.
---
2. False Breakout Trap
The red-box area could be a liquidity zone where smart money might induce a fake breakout before dumping.
> Alternative path: Price breaks above temporarily (as in blue path), but then reverses violently back into the range, forming a “bull trap.”
---
3. Volume Anomaly
The volume appears to be decreasing on recent bullish candles after the initial spike.
This suggests that the uptrend may be losing strength, making the yellow arrow scenario less likely.
> Contrary outlook: Lack of volume confirmation could mean a sideways consolidation or reversal is more probable.
---
4. News/Event Risk (Fundamental Disruption)
The chart shows an upcoming economic event (U.S. flag icon), possibly Non-Farm Payrolls (NFP), interest rate news, or CPI.
These events could cause extreme volatility and invalidate all technical patterns.

Market next move 🧨 Disruption Points:
1. Overbought Condition / RSI Divergence
Even though the price is surging (+3.30%), there could be an overbought condition forming.
If RSI or other momentum indicators (not shown here) diverge, it might signal weakness in bullish momentum.
> Disruptive idea: Price may fake the breakout (blue arrow) and then sharply reverse, trapping late buyers.
---
2. False Breakout Trap
The red-box area could be a liquidity zone where smart money might induce a fake breakout before dumping.
> Alternative path: Price breaks above temporarily (as in blue path), but then reverses violently back into the range, forming a “bull trap.”
---
3. Volume Anomaly
The volume appears to be decreasing on recent bullish candles after the initial spike.
This suggests that the uptrend may be losing strength, making the yellow arrow scenario less likely.
> Contrary outlook: Lack of volume confirmation could mean a sideways consolidation or reversal is more probable.

Market next move 🔍 Bearish Disruption Perspective
1. Supply Zone Rejection
The red box marks a strong resistance zone. Current price action shows rejection at that level (long upper wicks).
This signals that sellers are defending this zone, increasing the likelihood of a false breakout.
2. Exhaustion After Strong Rally
The massive green candle just before the resistance may have exhausted short-term buying power.
Without a clear consolidation or volume surge, the price could reverse or retrace to gather strength.
3. Volume Discrepancy
Volume spikes with price often suggest conviction. However, this chart shows moderate volume on the test of resistance—not enough to confirm breakout strength.
4. Bearish Candlestick Pattern
The small red candle following the green surge could be forming a bearish engulfing or rejection candle, depending on the close.
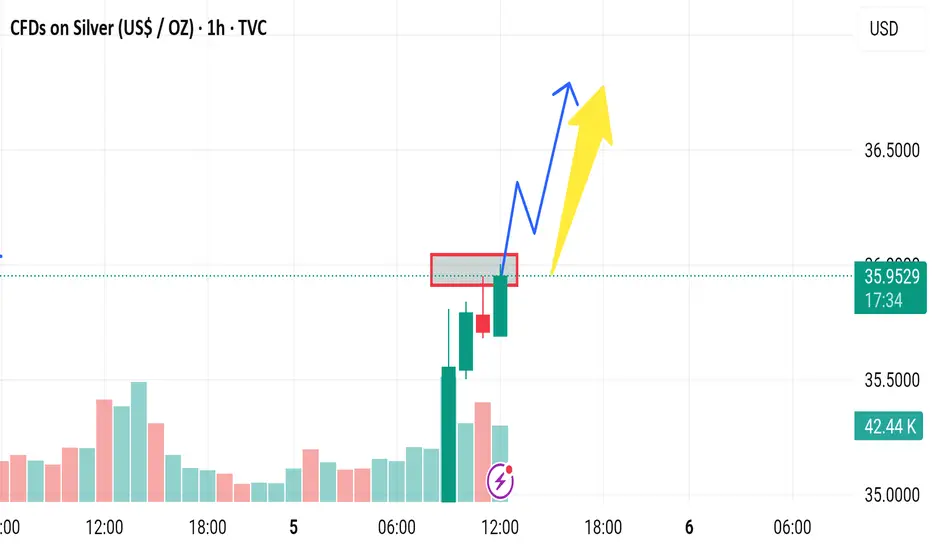
Market next move 🔍 Disruptive Technical Perspective
1. Overextension After Rally
The current sharp upward move may be overextended.
Lack of consolidation suggests the rally may be unsustainable without a pullback to test support.
2. Volume Divergence
While price is rising, the volume bar at the most recent candle is not increasing proportionally.
This signals weakening momentum, which often precedes a reversal or consolidation.
3. Unconfirmed Breakout
The chart doesn't clearly show a confirmed breakout above a significant resistance zone.
This could indicate a potential fakeout rather than a true breakout.
4. Potential Double Top Formation Risk
If price stalls near current levels and pulls back, a double top pattern might form—often a bearish reversal signal.
A drop back below $3,380 could trigger heavy selling.

Market next move 🔍 Disruptive Counter-Analysis
1. False Breakout Risk
The current breakout could be a bull trap. Price may break above the resistance level temporarily before reversing sharply.
Volume Analysis: The volume isn't significantly higher at the breakout candle, which may suggest a lack of strong momentum or institutional participation.
2. Resistance Zone Ahead
The 1.14500 to 1.15000 range is historically a supply zone, where sellers may aggressively enter the market.
This makes any upside move vulnerable to a reversal near that zone.
3. Macroeconomic Risk
A red-circled economic event icon appears on the chart (likely an ECB or Fed-related release). This adds uncertainty—news can invalidate technical patterns.
If the event is bearish for the euro (e.g., weak data or dovish ECB comments), the pair could reverse sharply.
4. Overbought Short-Term
A series of green candles without significant pullback suggests short-term overbought conditions.
RSI or other momentum indicators (not shown here) may confirm this. A correction to the previous base is possible.

Bearish drop?GBP/AUD is rising towards the pivot, which is a pullback resistance and could drop to the 1st support, which is also a pullback support.
Pivot: 2.0898
1st Support: 2.0797
1st Resistance: 2.0946
Risk Warning:
Trading Forex and CFDs carries a high level of risk to your capital and you should only trade with money you can afford to lose. Trading Forex and CFDs may not be suitable for all investors, so please ensure that you fully understand the risks involved and seek independent advice if necessary.
Disclaimer:
The above opinions given constitute general market commentary, and do not constitute the opinion or advice of IC Markets or any form of personal or investment advice.
Any opinions, news, research, analyses, prices, other information, or links to third-party sites contained on this website are provided on an "as-is" basis, are intended only to be informative, is not an advice nor a recommendation, nor research, or a record of our trading prices, or an offer of, or solicitation for a transaction in any financial instrument and thus should not be treated as such. The information provided does not involve any specific investment objectives, financial situation and needs of any specific person who may receive it. Please be aware, that past performance is not a reliable indicator of future performance and/or results. Past Performance or Forward-looking scenarios based upon the reasonable beliefs of the third-party provider are not a guarantee of future performance. Actual results may differ materially from those anticipated in forward-looking or past performance statements. IC Markets makes no representation or warranty and assumes no liability as to the accuracy or completeness of the information provided, nor any loss arising from any investment based on a recommendation, forecast or any information supplied by any third-party.

EURUSD: Twin Channel Up structure aims for 1.14950.EURUSD is bullish on its 1D technical outlook (RSI = 59.016, MACD = 0.005, ADX = 22.852) as it maintains a bullish structure consisting of successive Channel Up patterns. We are currently on the 2nd, with the price supported by both the 30m MA50 and MA200. The 1st Channel Up peaked after a +1.29% rise. We remain bullish, aiming for a similar rise, TP = 1.14950.
See how our prior idea has worked out:
## If you like our free content follow our profile to get more daily ideas. ##
## Comments and likes are greatly appreciated. ##

EURUSD: Pullback From Support Confirmed 🇪🇺🇺🇸
Update for our yesterday's setup on EURUSD.
It feels like the pair has successfully completed a retracement,
respecting an intraday horizontal support.
A double bottom formation on that and a formation of a bullish
imbalance candle provide a strong bullish confirmation.
I think the pair may rise at least to 1.144 support soon.
❤️Please, support my work with like, thank you!❤️
I am part of Trade Nation's Influencer program and receive a monthly fee for using their TradingView charts in my analysis.
