Market next target 🧨 Disruption Points:
1. Bullish Accumulation Underway
The recent candles show higher lows and lower volume on red candles, suggesting selling pressure is decreasing.
> Disruptive scenario: Price may bounce off minor support (around 1.3560–1.3570) and form a higher low, triggering a bullish rally back above 1.3620.
---
2. Fake Bearish Setup (Liquidity Trap)
The three arrows predicting a drop might represent a classic retail trap where too many anticipate the same direction.
> Contrary idea: A false breakdown below 1.3550 may occur just to collect stop-losses, followed by a strong reversal upward.
---
3. Divergence Risk
If momentum indicators (e.g., RSI, MACD) show bullish divergence while price moves sideways or dips, it may signal an upcoming bullish impulse.
> Disruption: Downward arrows may be misinterpreting consolidation as weakness rather than a setup for continuation of the previous uptrend.
---
4. Fundamental Wildcard
The chart shows an upcoming U.S. economic event, likely to impact the dollar.
If the data is weak for the USD, GBP/USD could surge sharply, invalidating the bearish scenario.
Forextradingzones

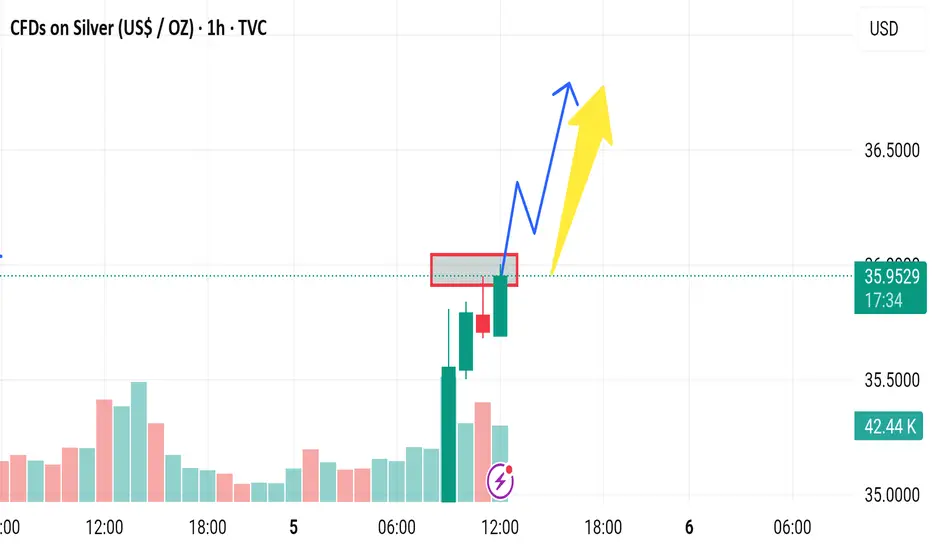
Market next target 🧨 Disruption Points:
1. Overbought Condition / RSI Divergence
Even though the price is surging (+3.30%), there could be an overbought condition forming.
If RSI or other momentum indicators (not shown here) diverge, it might signal weakness in bullish momentum.
> Disruptive idea: Price may fake the breakout (blue arrow) and then sharply reverse, trapping late buyers.
---
2. False Breakout Trap
The red-box area could be a liquidity zone where smart money might induce a fake breakout before dumping.
> Alternative path: Price breaks above temporarily (as in blue path), but then reverses violently back into the range, forming a “bull trap.”
---
3. Volume Anomaly
The volume appears to be decreasing on recent bullish candles after the initial spike.
This suggests that the uptrend may be losing strength, making the yellow arrow scenario less likely.
> Contrary outlook: Lack of volume confirmation could mean a sideways consolidation or reversal is more probable.
---
4. News/Event Risk (Fundamental Disruption)
The chart shows an upcoming economic event (U.S. flag icon), possibly Non-Farm Payrolls (NFP), interest rate news, or CPI.
These events could cause extreme volatility and invalidate all technical patterns.

Market next move 🧨 Disruption Points:
1. Overbought Condition / RSI Divergence
Even though the price is surging (+3.30%), there could be an overbought condition forming.
If RSI or other momentum indicators (not shown here) diverge, it might signal weakness in bullish momentum.
> Disruptive idea: Price may fake the breakout (blue arrow) and then sharply reverse, trapping late buyers.
---
2. False Breakout Trap
The red-box area could be a liquidity zone where smart money might induce a fake breakout before dumping.
> Alternative path: Price breaks above temporarily (as in blue path), but then reverses violently back into the range, forming a “bull trap.”
---
3. Volume Anomaly
The volume appears to be decreasing on recent bullish candles after the initial spike.
This suggests that the uptrend may be losing strength, making the yellow arrow scenario less likely.
> Contrary outlook: Lack of volume confirmation could mean a sideways consolidation or reversal is more probable.

Market next move 🔍 Bearish Disruption Perspective
1. Supply Zone Rejection
The red box marks a strong resistance zone. Current price action shows rejection at that level (long upper wicks).
This signals that sellers are defending this zone, increasing the likelihood of a false breakout.
2. Exhaustion After Strong Rally
The massive green candle just before the resistance may have exhausted short-term buying power.
Without a clear consolidation or volume surge, the price could reverse or retrace to gather strength.
3. Volume Discrepancy
Volume spikes with price often suggest conviction. However, this chart shows moderate volume on the test of resistance—not enough to confirm breakout strength.
4. Bearish Candlestick Pattern
The small red candle following the green surge could be forming a bearish engulfing or rejection candle, depending on the close.
Market next move 🔍 Disruptive Technical Perspective
1. Overextension After Rally
The current sharp upward move may be overextended.
Lack of consolidation suggests the rally may be unsustainable without a pullback to test support.
2. Volume Divergence
While price is rising, the volume bar at the most recent candle is not increasing proportionally.
This signals weakening momentum, which often precedes a reversal or consolidation.
3. Unconfirmed Breakout
The chart doesn't clearly show a confirmed breakout above a significant resistance zone.
This could indicate a potential fakeout rather than a true breakout.
4. Potential Double Top Formation Risk
If price stalls near current levels and pulls back, a double top pattern might form—often a bearish reversal signal.
A drop back below $3,380 could trigger heavy selling.

Market next move 🔍 Disruptive Counter-Analysis
1. False Breakout Risk
The current breakout could be a bull trap. Price may break above the resistance level temporarily before reversing sharply.
Volume Analysis: The volume isn't significantly higher at the breakout candle, which may suggest a lack of strong momentum or institutional participation.
2. Resistance Zone Ahead
The 1.14500 to 1.15000 range is historically a supply zone, where sellers may aggressively enter the market.
This makes any upside move vulnerable to a reversal near that zone.
3. Macroeconomic Risk
A red-circled economic event icon appears on the chart (likely an ECB or Fed-related release). This adds uncertainty—news can invalidate technical patterns.
If the event is bearish for the euro (e.g., weak data or dovish ECB comments), the pair could reverse sharply.
4. Overbought Short-Term
A series of green candles without significant pullback suggests short-term overbought conditions.
RSI or other momentum indicators (not shown here) may confirm this. A correction to the previous base is possible.

Market next move Disruption of the Downtrend Analysis
The chart currently suggests a bearish breakout with a downside target near 1.12900. Let’s challenge that:
---
🟩 Bullish Reversal Possibility
1. Support Zone Near 1.1370:
Price has shown signs of stabilizing around the 1.1370 level.
Multiple wicks below the candles suggest buyer interest at this level.
2. Low Volume on Recent Red Candles:
A decreasing volume trend on recent red candles can indicate weak bearish momentum.
Bulls may be waiting to enter on a breakout above the 1.1380–1.1390 zone.
3. Potential for Fakeout:
The sharp expected drop might be a bear trap.
If price breaks back above 1.1385 with strong volume, it could invalidate the bearish thesis.
4. RSI/Momentum Divergence (Assumed):
If momentum indicators (not shown) display bullish divergence, this strengthens the case for a reversal
Market next move ⚠️ Disruption of the Bullish Analysis:
1. Weak Support Zone
The highlighted support area is not strongly tested (only a couple of candles touch it).
Low volume around support may indicate lack of buying interest at that level.
If price breaks below this support, the bullish setup becomes invalid.
2. Bearish Volume Spike
There's a noticeable high volume red candle during the recent drop.
This could imply strong selling pressure, not just profit-taking.
Rising volume on red candles often precedes further downside.
3. Lower High Formation
The price may create a lower high near the projected bounce zone.
If that happens, the market structure would shift to bearish.
A lower high and a break below support confirms a downtrend.
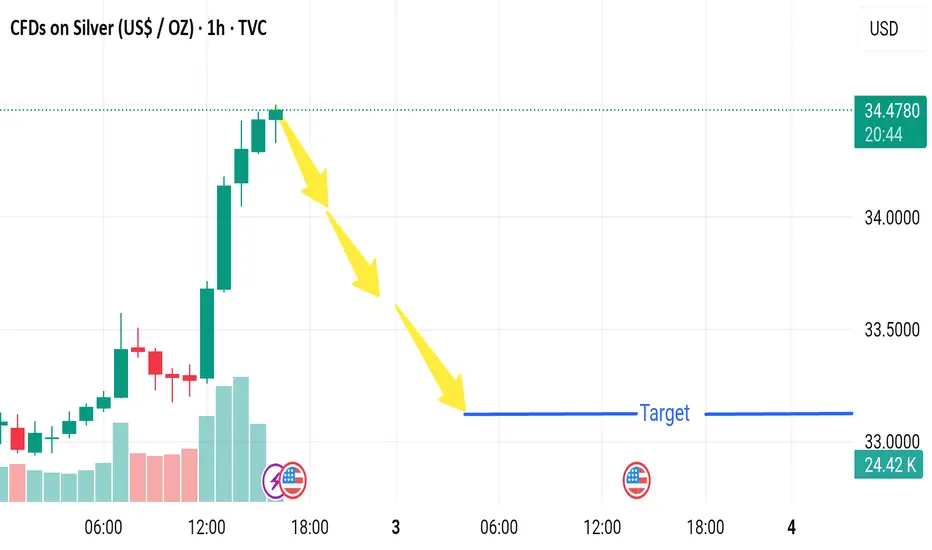
Market next move 🔻 Disruptive Bearish Analysis:
🧱 1. Failed Breakout Attempt
Price is hovering at resistance but showing indecisive candles (small bodies, wicks on both sides).
This hints at buyer exhaustion rather than breakout momentum.
📉 2. Bearish Divergence (Possible)
If momentum indicators (e.g., RSI or MACD—not shown here) are diverging from price, it could signal a reversal.
Price rising while momentum flattens or drops suggests a fakeout is likely.
🕳️ 3. Liquidity Grab Trap
The chart may show a classic “bull trap”:
Price broke resistance briefly but quickly fell back.
This signals institutional liquidity grab, possibly before a downward push.
🔽 4. Volume Imbalance
The spike in volume earlier may be followed by decreasing bullish volume, indicating weak follow-through.
Sellers could take over if bulls can’t sustain pressure.

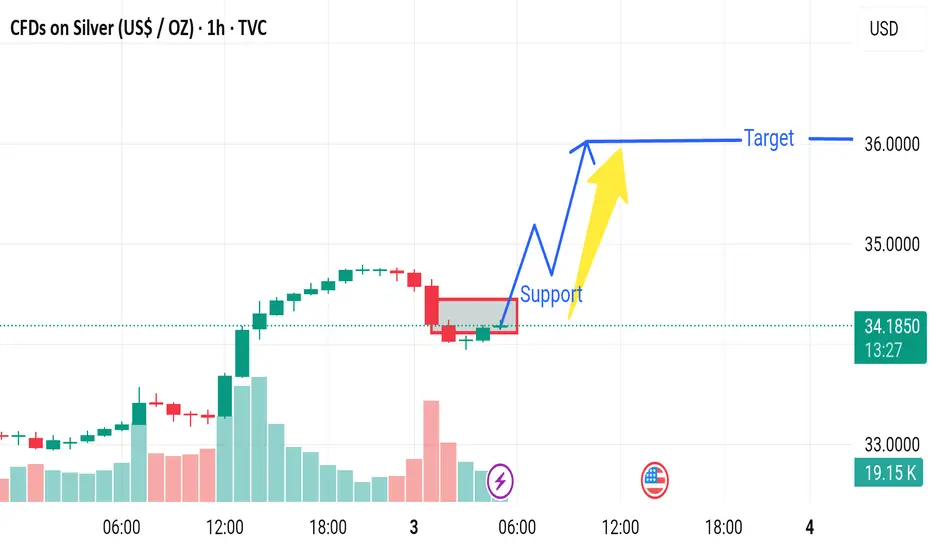
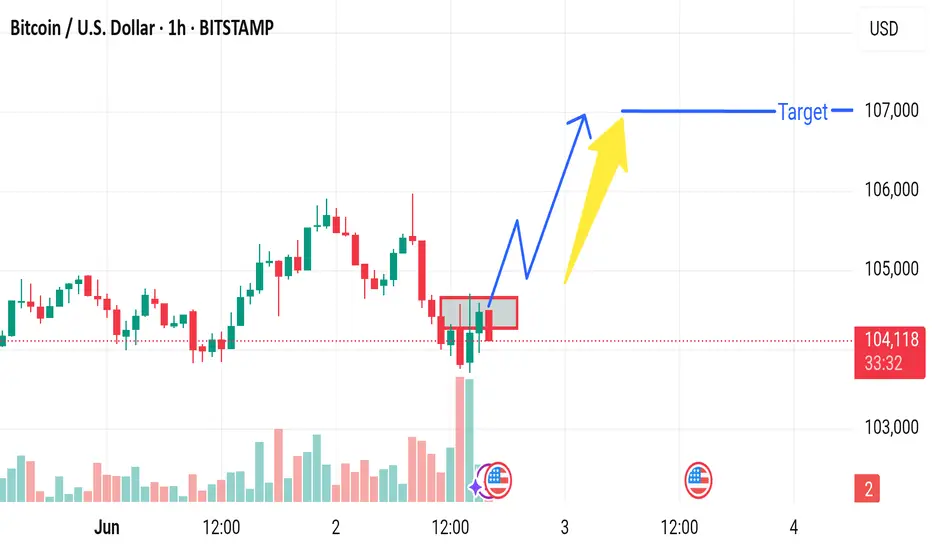
Market next target 🟢 Disruptive Bullish Scenario:
🔁 1. Healthy Bull Flag or Consolidation
The steep rally (+4.5%) may not lead to a breakdown.
The current pause near $34.50 could be a bull flag or tight range consolidation, common in continuation patterns.
🔼 2. Volume Supports the Move
Notice the strong rising volume on the breakout candles.
This shows genuine buyer interest, not a pump-and-dump move.
🧲 3. Breakout Holding Above Previous Highs
Price is holding above previous resistance, which now acts as support around $34.00–$34.20.
Holding this zone can lead to a retest and breakout to new highs.
📈 4. Strong Macro Bullish Catalyst
The U.S. event icon suggests important data is near.
If the data (like weaker dollar or inflation concerns) supports metals, Silver could surge further rather than drop.
Market next move 🔻 1. False Breakout Risk
Price is hovering right at the resistance-turned-support zone.
The candles above this zone have long upper wicks, signaling rejection and selling pressure.
This may be a bull trap before reversal.
---
📉 2. Decreasing Bull Volume
Volume peaked earlier, but the most recent green candles are showing lower volume, suggesting weakening bullish momentum.
Lack of strong follow-through volume often precedes reversals.
---
🕳️ 3. Overextended Rally
Gold has moved sharply upward recently (over +2.5%).
There may be a need for a cooldown or retracement, especially if no fresh catalysts emerge.
---
⚠️ 4. Macro Factors Unpriced
The chart includes a U.S. event icon, likely representing upcoming economic data (e.g., Fed comments, job reports).
Any hawkish surprise (rate hike concerns, strong jobs report) could cause a sharp reversal in gold due to rising yields and a stronger USD.

Market next target 🟢 1. Strong Support Zone Nearby
The region around $103,500–$104,000 has acted as a strong demand zone historically (look left).
BTC might bounce from this level instead of continuing the downtrend.
---
🔄 2. Consolidation, Not Breakdown
The price action appears more sideways/choppy than strongly bearish.
Without a clean breakdown candle below key support, this might be accumulation, not distribution.
---
📉 3. Bearish Momentum Weakness
Volume on the recent red candles is not significantly increasing.
This implies lack of strong conviction from sellers.

Market next move 1. Bearish Rejection Zone
The red box highlights a consolidation/resistance zone.
BTC is struggling to break and close above this area.
Multiple candle wicks into the zone suggest seller strength.
---
📉 2. Volume Weakness
The recent upward candles show lower volume compared to the selling candles before it.
This indicates that the buying pressure may be weak, lacking momentum for a breakout.
---
🕳️ 3. False Breakout Trap Risk
A fakeout above the resistance box is possible if big players trigger buy orders and then reverse the market, trapping retail traders.
---
🟠 4. Bearish Divergence (if confirmed by RSI or MACD)
Without indicators shown, if momentum indicators like RSI/MACD display divergence (price up but momentum down), it’s a bearish signal.
Market next move 🔄 Disruptive Bullish Scenario Analysis
1. Oversold Conditions & Possible Reversal
The current price at 143.028 shows an aggressive drop.
This could indicate the pair is entering oversold territory on lower timeframes (not visible here but common post-drop).
If confirmed with RSI or stochastic indicators, a reversal or retracement could be imminent before reaching the 141.000 target.
2. Demand Zone at 142.500–142.000
Historically, this area (near 142.5–142.0) may act as a support zone.
Buyers could step in here, especially if fundamentals (e.g., U.S. data releases or BOJ comments) support dollar strength.
3. Volume Divergence
Declining selling volume despite price falling (visible from lower red bars) may hint at weakening bearish momentum.
This divergence often precedes a bullish correction or range formation.
4. False Breakdown Possibility
The sharp projection to 141.000 could trigger stop hunts.
After trapping breakout sellers, price may sharply rebound to retest 143.500–144.000 zones.

Market next target 🔍 Original Analysis Summary:
Bearish Outlook: Price is expected to decline from the recent high.
Support Level: Identified near 1.34400.
Target Zone: Around 1.34200 based on breakdown expectations.
Reasoning: Possibly based on rejection near resistance and anticipation of bearish follow-through.
---
⚠️ Disruption (Bullish/Neutral Counter-Scenario):
1. Strong Bullish Candle at Resistance
The last candle is a bullish engulfing near recent highs, indicating buyer strength.
Rather than rejecting, price appears to break out of consolidation.
---
2. Volume Supporting Bullish Momentum
Increasing green volume bars show accumulating demand, not weakness.
Could imply a liquidity grab before a bullish continuation.
---
3. Failed Breakdown Attempts
Price has attempted to fall multiple times (wicks downward), but was bought up quickly.
That often signals trap setups where short sellers are being baited.
---
4. Macro Sentiment / USD Weakness Risk
With upcoming U.S. economic news (red circle), any sign of a weaker USD could invalidate the bearish scenario entirely.
GBP tends to benefit from any shift in U.S. interest rate expectations or economic softness.

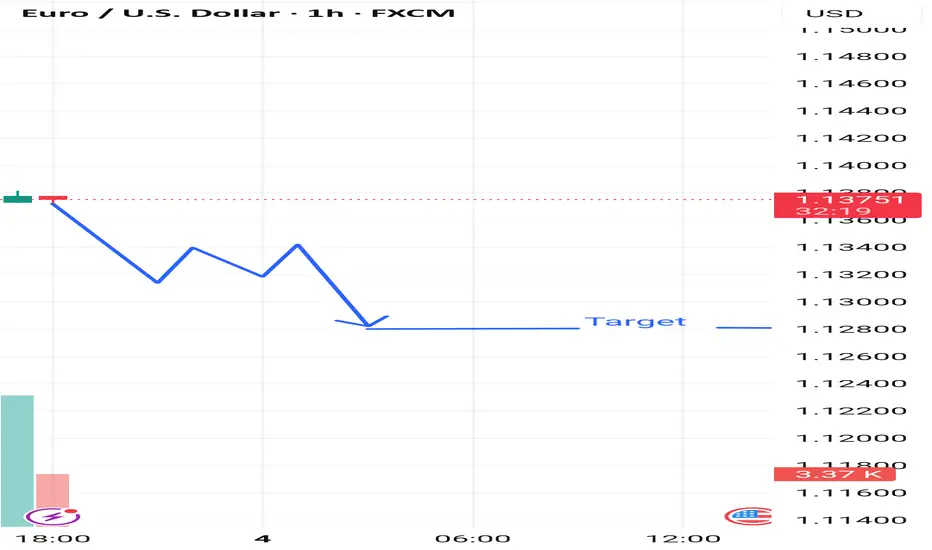
Market next move 🔍 Original Analysis Summary:
Bearish Setup: Price is expected to break down from the small consolidation area (highlighted in red box).
Projection: A drop toward the lower target zone (~1.13200–1.13300).
Trigger: Likely based on rejection from minor resistance and upcoming U.S. economic data (flag icons).
---
⚠️ Disruption (Bullish/Neutral Counter-View):
1. Support Holding Firm
The price has tested the red box area multiple times without a clear breakdown.
This could signal strong demand/support around 1.13600, invalidating the bearish momentum.
---
2. Volume Spike on Bullish Candles
Notable bullish volume spikes suggest buyers are stepping in at current levels, defending support.
---
3. Potential Bullish Reversal Pattern
The red box resembles a bullish flag or rectangle, often a continuation pattern — not necessarily a bearish signal.
If price breaks above 1.13700, it may trigger buy stop orders, fueling a rally.
---
4. Favorable Euro Fundamentals
The eurozone flag icon suggests EU news is also pending. If this is hawkish or better than expected, EUR/USD could rally sharply, invalidating the bearish outlook.

Market next target 🔍 Original Analysis Summary:
Bullish Continuation is expected.
Price is projected to rise with a series of higher highs (yellow arrows).
Target area is marked above 34.000 USD.
---
⚠️ Disruption (Bearish/Neutral Counter-View):
1. Flat Consolidation Zone = Distribution Risk
Price has been moving sideways in a tight range (approx. 32.90–33.15), indicating indecision.
This could be a distribution phase, where smart money sells into retail bullishness.
---
2. Weak Volume Profile
Volume is relatively low and not increasing with attempted bullish moves.
A strong breakout should be backed by volume, but current price action lacks conviction.
---
3. False Breakout Trap Risk
Price is testing the upper boundary of a range.
A small push higher could be a bull trap, especially if it reverses back inside the range — a common fake-out setup.

Market next move 🔍 Original Analysis Summary:
Bullish Bias: The analysis suggests a breakout above the current level, with price bouncing off "support" and targeting higher levels beyond the marked "resistance."
Expectation: Higher highs post-breakout.
---
⚠️ Disruption (Bearish/Neutral Counter-View):
1. Low Volume on Recent Push
Recent bullish candles have declining volume, signaling potential weak buying pressure.
This divergence could imply that buyers are losing interest or that the rally is unsustainable.
2. Flat Resistance Zone
The price is struggling to break above the 3,315–3,320 level, suggesting strong selling pressure.
Multiple rejections at the same level could form a double top, a bearish reversal pattern.
3. Lower Highs from May 30 Peak
While the price is rising, it's still below the highs made on May 30, indicating the uptrend might be weakening.
4. Bearish Divergence (Hypothetical)
If RSI or MACD were plotted, a bearish divergence (price rising, but momentum indicators falling) might be present — often a precursor to a reversal.
5. Fundamental Risk: U.S. Data (Flagged)
The U.S. flag icon signals upcoming economic news. If positive, it could strengthen the USD, pushing gold lower.
Volatility around this time might invalidate the bullish setup.
Market next move 🚫 Disruption Points
1. No Clear Breakout Confirmation
Issue: The chart does not show a clear breakout of any recent highs or resistance levels.
Disruption: Without a break of a key level (like 1.3480–1.3500), the bullish target is premature.
2. Bearish Price Structure
Observation: The price has been making lower highs and lower lows over the last few candles.
Disruption: This may indicate a downtrend, not a setup for a bullish target.
3. Low Momentum
Issue: Volume appears to be declining, and recent bullish candles are smaller and weaker.
Disruption: The move toward the target may lack strength and could reverse without momentum.

Market next target 🔍 Original Analysis Summary
Resistance Zone: Around 1.1360
Support Zone: Same level after breakout (suggesting a breakout and retest pattern)
Target: Around 1.1450 after breakout
---
🚫 Disruption Points
1. False Breakout Risk
What could happen: Price might break the resistance briefly and then fall back below it.
Why: Lack of volume or confirmation, or a market maker trap to gather liquidity above the resistance zone.
Disruption: Instead of forming new support, it could become a bull trap leading to a sharp reversal.
2. Fundamental Risk
What could happen: Unexpected U.S. or Eurozone economic data (like NFP, CPI, or ECB/Fed announcements) may shift sentiment suddenly.
Why: The image shows upcoming news events (flag icons), which could induce volatility.
Disruption: The news might push EUR/USD sharply down even if a breakout occurs.
3. Bearish Divergence (if applicable)
What could happen: If RSI or MACD were included, they might show divergence while price is rising.
Why: Divergence typically precedes reversals.
Disruption: This would undermine the bullish breakout thesis.

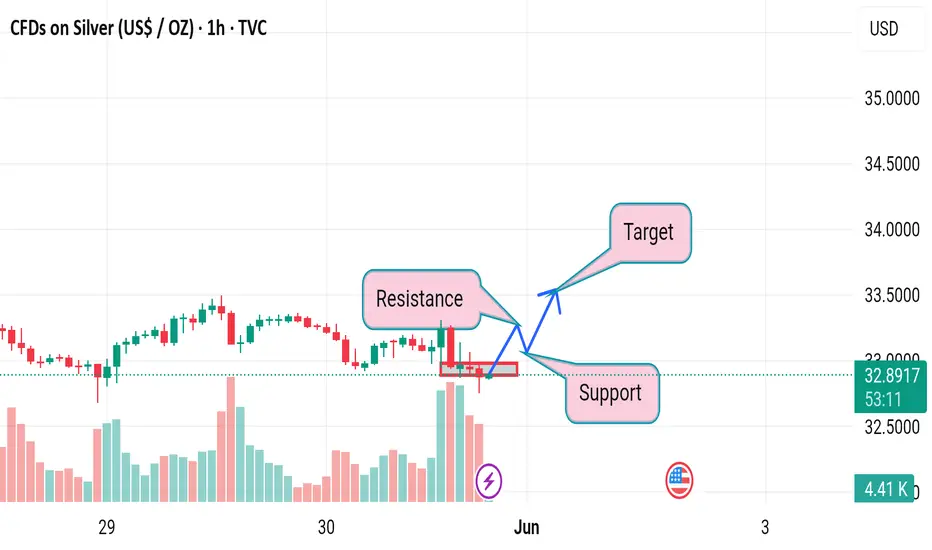
Market next move ⚠️ Disruption of the Bullish Silver Setup:
---
1. Misleading Support-Resistance Interpretation
The resistance zone highlighted is flat and overlapping with multiple wicks.
The support zone is not well-established; it's only tested once or twice with weak bounce reaction, which is not enough to consider it strong support.
---
2. Lack of Bullish Confirmation
The price is currently hovering around the support with no breakout candle or strong bullish engulfing pattern.
The recent candlesticks near resistance are small-bodied with long wicks, suggesting indecision or weakening buying power, not strength.
---
3. Volume Disagreement
There's no surge in bullish volume that would confirm buyers stepping in.
The large red volume bars toward the right indicate selling pressure dominating, which contradicts the bullish target.
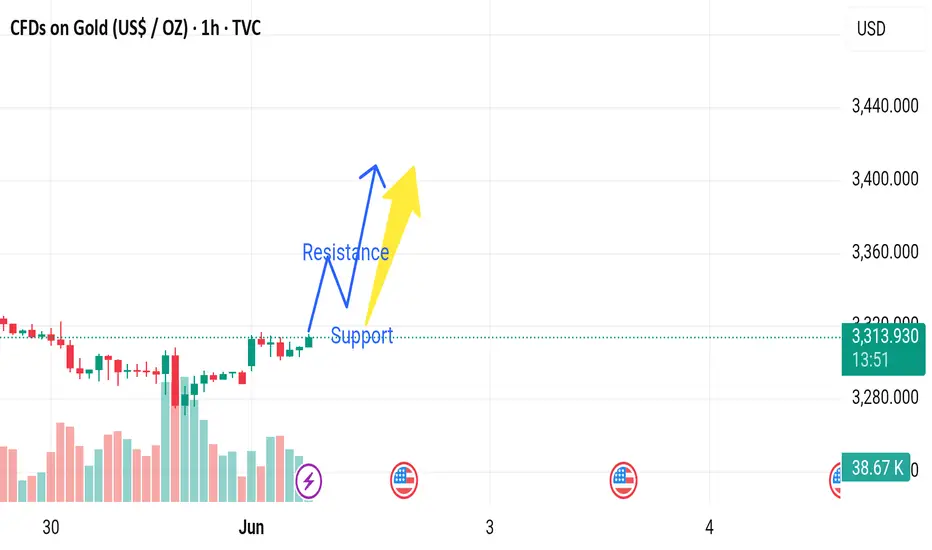
Market next move 🔍 Disruption of the Bullish Setup on GOLD:
1. Range Market Ignored:
The price is moving sideways in a tight consolidation, indicating range-bound behavior rather than a breakout setup.
The chart projects a bullish move, but there's no confirmed breakout of the resistance zone yet.
2. Weak Resistance Zone:
The identified “resistance” zone is very narrow and lacks strong rejection wicks or significant bearish volume.
It's unclear if this is true resistance or just part of the ongoing chop.
3. Lack of Volume Confirmation:
Volume remains moderate and doesn’t show increasing buying pressure, which would be expected if bulls were preparing a breakout.
No signs of volume climax or absorption, which are typical before breakouts.
4. Premature Targeting:
The target area is placed far above the resistance zone without a measured move or pattern basis (e.g., no flag, no cup-and-handle, no inverse head and shoulders).
This could be misleading as it sets unrealistic expectations.

Market next move 🔍 Disruption of the Current Bearish Setup:
1. Mislabeling of Levels:
The chart labels a newly broken support as "Support" still, even though price has clearly broken below that zone.
In proper technical analysis, once support is broken, it often turns into resistance, so the labels should be reversed.
2. Premature Downside Projection:
The bearish arrow assumes continued downside immediately after the breakdown, but there’s no confirmation candle or retest yet.
This could easily be a false breakdown or a liquidity sweep below support before a bounce.
3. No Confirmation from Volume:
Volume spiked on the breakdown, but the follow-up candle doesn’t confirm seller continuation.
Absence of sustained volume makes the move questionable. It could be a trap for breakout traders.
4. Lack of Trend Context:
The chart doesn't consider the broader trend. If BTC was in a strong uptrend before this pullback, this could be a bullish retracement, not a true reversal.
Drawing a trendline or checking a higher timeframe would help validate the direction.
