USDCNH top-down analysisHello traders, this is the full breakdown of this pair. We will take this trade if all the conditions are satisfied as discussed in the analysis. Smash the like button if you find value in this analysis and drop a comment if you have any questions or let me know which pair to cover in my next analysis.
Forextradingzones

AUDNZD top-down analysisHello traders, this is the full breakdown of this pair. We will take this trade if all the conditions are satisfied as discussed in the analysis. Smash the like button if you find value in this analysis and drop a comment if you have any questions or let me know which pair to cover in my next analysis.

#GOLD is trading 4HR Resistance Area, the potential a Drop!#GOLD Price is trading the supply area and it also reacts to the 4HR resistance so it is possible to a drop And the price also expect to touch the 50EMA and Hangingman and Doji candlestick formed in the resistance area
Why we like it:
Price is trading to the Resistance 4HR area
Hanging man and Doji candlestick formed in the resistance area
waiting for 50EMA retracement
1st support:
1822
Next Zone area & horizontal swing Low support
2nd support:
1817
Next Zone area & horizontal swing Low support
1st Resistance
1834
Zone area & horizontal swing high resistance

#EURCAD for nearby 4HR support area to potential to Buy!#EURCAD Price is trading nearby the 4HR Support Area zone waiting for any bullish candlestick formation and watch breakout the trend line its will move to the next level resistance area
Why we like it:
Price Trading nearby in 4HR support area
watch the trend line breakout
moving to the next resistance area
waiting for candlestick confirmation
1st support:
1.47514
Next Zone area & horizontal swing Low support
2nd support:
1.46883
Next Zone area & horizontal swing Low support
1st Resistance
1.48233
Zone area & horizontal swing high resistance
2nd Resistance
1.48514
Zone area & horizontal swing high resistance

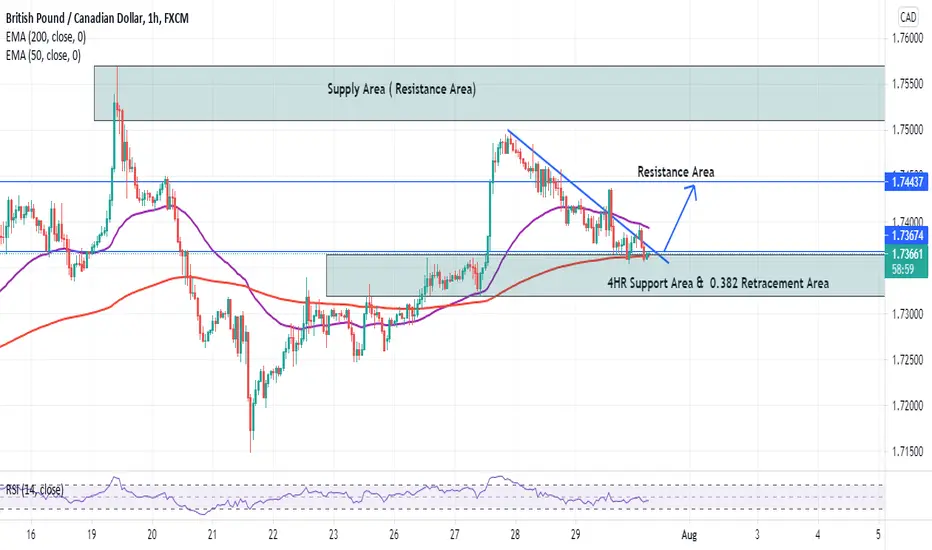
#GBPCAD for 4HR support area to potential to Buy!#GBPCAD Price is trading the Support Area zone waiting for any bullish candlestick formation and watch breakout the trend line its will move to the next level resistance area
Why we like it:
Price Trading in 4HR support area
watch the trend line breakout
moving to the next resistance area
waiting for candlestick confirmation
1st support:
1.73180
Next Zone area & horizontal swing Low support
1st Resistance
1.74404
Zone area & horizontal swing high resistance
#GBPUSD approaching 4HR Resistance Area, the potential a Drop!#GBPUSD Price trading in supply area and it also reacts the 4HR resistance so it is possible to a drop And the price also expect touching the 50EMA or next level support and watch any evening star candlestick formed in the resistance area once the price come with retracement level and watch any bullish candlestick formation
Why we like it:
Price is moving to the Resistance 4HR area
Evening star candlestick formation
waiting for 50EMA retracement
1st support:
1.39086
Next Zone area & horizontal swing Low support
1st Resistance
1.40122
Zone area & horizontal swing high resistance

#EURUSD approaching 4HR Resistance Area, the potential a Drop!#EURUSD Price trading in supply area and it also reacts the 4HR resistance so it is possible to a drop And the price also expect touching the 50EMA or next level support and watch any bearish candlestick formed in the resistance area
Why we like it:
Price is moving to the Resistance 4HR area
waiting for bearish candlestick formation
waiting for 50EMA retracement
1st support:
1.18678
Next Zone area & horizontal swing Low support
2nd support:
1.18472
Zone area & horizontal swing Low support
1st Resistance
1.19100
Zone area & horizontal swing high resistance

#USDCHF approaching for 4HR demand area to potential to Buy!#USDCHF Price is trading the demand Area confirm the any bullish candlestick formation in 1hr timeframe it will go for the next level resistance 0.91191
Why we like it:
Price Trading in 4HR demand area
watch the bullish candlestick formation in 1hr timeframe
Expect to moving the next level resistance area
1st support:
0.90750
Next Zone area & horizontal swing Low support
1st Resistance
0.91191
Zone area & horizontal swing high resistance

EURGBP Renter on EURGBP….. expected the retrace kept sl to reward high….
Let’s see how this one plays out currently +4% for the week..

#GBPCAD waiting for 4HR support area to potential to Buy!#GBPCAD Price is trading the near by Support Area once price come with marked support then you will confirm the any bullish candlestick formation and watch breakout the trend line
Why we like it:
Price Trading in 4HR support area
watch the trend line breakout
moving to the next resistance area
1st support:
1.73693
Next Zone area & horizontal swing Low support
1st Resistance
1.74449
Zone area & horizontal swing high resistance

#GBPUSD moving to 4HR Resistance Area , the potential a Drop!#GBPUSD Price is moving to demand and it is also react the 4HR resistance so it is possible to a drop And the price also expect touching the 50EMA and watch the any bearish candlestick formed in resistance area
Why we like it:
Price is moving to Resistance 4HR area
waiting for bearish candlestick formation
waiting for 50EMA retracement
1st support:
1.38983
Next Zone area & horizontal swing Low support
1st Resistance
1.39885
Zone area & horizontal swing high resistance

#EURUSD approaching 4HR Resistance Area , the potential a Drop!#EURUSD Price is moving to demand and it is also react the 4HR resistance so it is possible to a drop And the price also expect touching the 50EMA and watch the any bearish candlestick formed in resistance area
Why we like it:
Price is moving to Resistance 4HR area
waiting for bearish candlestick formation
waiting for 50EMA retracement
1st support:
1.18355
Next Zone area & horizontal swing Low support
2nd support:
1.18166
Zone area & horizontal swing Low support
1st Resistance
1.18777
Zone area & horizontal swing high resistance

#GOLD potential for moving buy-side! #GOLD Price is trading in the demand zone and we got the price rejection so if you form any bullish candlestick the price possible to moving next resistance level 1807
Why we like it:
price trading in demand zone
waiting for Bullish Candlestick Formation
Touching 50 EMA
1st Resistance:
1807
Next supply area & horizontal swing high resistance
2nd Resistance:
1810
Next supply area & horizontal swing high resistance
1st Support:
1795
Next demand area & horizontal swing low resistance
2nd Support:
1788
Next demand area & horizontal swing low resistance

#GBPUSD approaching Resistance Area , the potential a Drop!#GBPUSD Price is trading the Resistance Area and it is also react the 4HR resistance so it is possible to a drop And the price also possible to down and touch the 50EMA shooting star candlesticks will formed in resistance area
Why we like it:
Price Trading in Resistance area
formed shooting star candlestick pattern
Attend the 90% fib level
Retrace the price and expect to touch the 50EMA
1st support:
1.37655
Next Zone area & horizontal swing Low support
2nd support:
1.36960
Zone area & horizontal swing Low support
1st Resistance
1.38649
Zone area & horizontal swing high resistance

#GBPJPY approaching Resistance Area , the potential a Drop!GPJPY Price is trading the Resistance Area and it is also react the 4HR resistance so it is possible to a drop And the price also touching the 200EMA and pricing pattern candlestick formed in resistance area
Why we like it:
Price Trading in Resistance area
formed pricing pattern candlestick pattern
Attend the 100% fib level
200EMA touching
1st support:
151.346
Next Zone area & horizontal swing Low support
2nd support:
141.938
Zone area & horizontal swing Low support
1st Resistance
153.313 - 153.514
Zone area & horizontal swing high resistance

CadUsd structureNice build up (4h TF)
Breakout and retest
* White line = 200 ema could be (first) 🎯
* T2 = 0.8100
Breakdown might take support @ previous swing
Note = I'm trading only it gives breakout, no trade on breakdown
If breakdown will wait for another structure to form
:)

EURUSD Sell the downtrend.EURUSD - Intraday - We look to Sell at 1.1824 (stop at 1.1845)
Trades with a bearish descending triangle formation.
Trend line resistance is located at 1.1820.
We look for a temporary move higher.
Pivot resistance is at 1.1825.
Daily signals are bearish.
Rallies continue to attract sellers.
Our profit targets will be 1.1762 and 1.1752
Resistance: 1.1780 / 1.1800 / 1.1820
Support: 1.1760 / 1.1750 / 1.1730

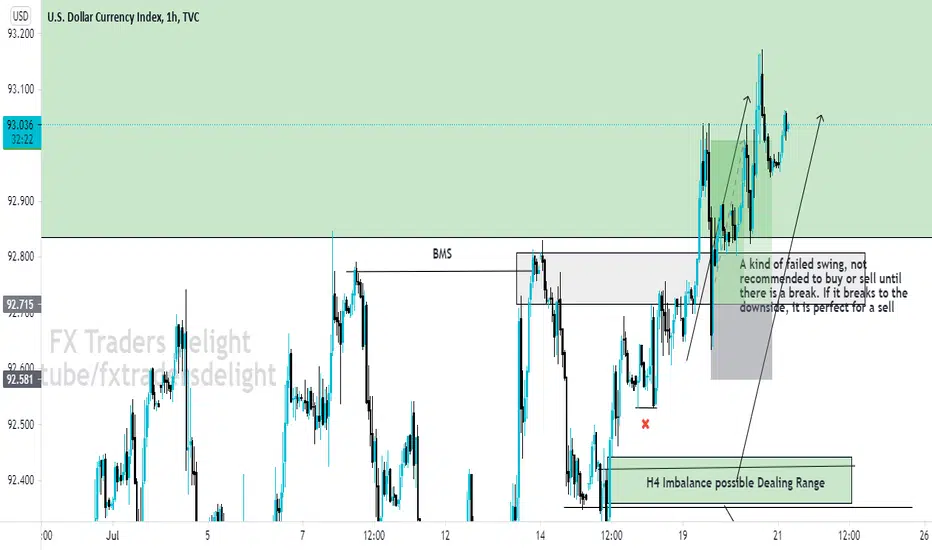
DXY Forex Forecast and Analysis - Smart Money Concept - AFTERThis is the aftermath of the DXY projection that was made on Monday. We see that price has traded into the daily order block as expected. So there might be a reaction at this level.


NZDUSD top-down analysis Hello traders, this is the full breakdown of this pair. We will take this trade if all the conditions are satisfied as discussed in the analysis. Smash the like button if you find value in this analysis and drop a comment if you have any questions or let me know which pair to cover in my next analysis.
