Market next move . Breakout Exhaustion (Fakeout Risk)
The price has just broken out of the consolidation box.
However, volume is not significantly surging—a true breakout is often confirmed with strong volume.
A fake breakout could lead to a sharp reversal back into the box.
---
2. Overbought Conditions
Given the sharp rally leading into the consolidation, indicators like RSI are likely in overbought territory.
Price may need to cool off before any sustainable move higher.
This could trigger a pullback to retest the support around 33.10–33.20.
---
3. Rising Wedge Formation Potential
If the uptrend continues with narrowing price action, it could form a rising wedge—a bearish reversal pattern.
This might lead to a drop toward $33.00 or lower.
---
4. Strong Resistance Around $34.00
Psychological and historical resistance at the $34.00 level could halt or reverse upward movement.
It might trigger profit-taking or short-selling pressure.
---
5. Macro Catalyst Risk
With the U.S. news symbol shown (likely an upcoming economic release), the bullish structure could quickly be invalidated.
A hawkish Fed or strong U.S. data may pressure silver lower due to USD strength or rising yields.
Forextradingzones
Market next move . False Breakout Risk (Bull Trap)
While the chart suggests an impending breakout, the market may be setting a bull trap:
Watch for a brief move above the consolidation zone that quickly reverses.
This could lure in buyers before a sharp downturn.
2. Volume Analysis Contradiction
Volume in the consolidation box seems to be decreasing.
A strong breakout typically needs a volume surge, which is currently absent.
Lack of commitment from buyers might suggest indecision or exhaustion.
3. Bearish Divergence Possibility
If you overlay an RSI or MACD indicator:
It might show bearish divergence (price making higher highs, indicator making lower highs).
This often precedes reversals.
4. Key Resistance Ahead
The area just above the consolidation box (around 3,320–3,340) could act as strong resistance based on historical price action.
Price might reject this zone rather than continue higher.
5. Fundamental Risks
Upcoming U.S. economic data (as hinted by the U.S. icon on the chart) may trigger unexpected volatility.
Hawkish Fed tone or strong dollar news could push gold down unexpectedly.

Market next move
Bearish Disruption to GBP/USD Analysis:
1. Support Weakness:
The price action within the red box shows multiple bearish candles, suggesting the zone is under pressure.
A break and close below this box could invalidate the bullish thesis.
2. Exhaustion Signals:
After a sharp rally, the market often consolidates or corrects. The current stall near 1.3400–1.3420 could indicate buying exhaustion.
The latest candle shows a strong bearish push into the support, hinting at potential for deeper decline.
3. Decreasing Volume:
Recent green candles had falling volume, which shows lack of conviction by buyers.
Meanwhile, red (bearish) candles show rising volume, signaling increased selling pressure.
4. Failed Breakout Setup:
If this bounce fails and price closes below 1.3380, this will form a false breakout or bull trap, triggering stop hunts and aggressive shorting.
5. Macroeconomic Headwinds:
GBP is sensitive to UK data and BoE policy. Any hawkish Fed or weak UK numbers may lead to a USD rebound, pushing GBP/USD lower.

Market next move
Bearish Disruption to the EUR/USD Analysis:
1. Strong Resistance Zone (Red Box):
Price is struggling to hold above the resistance area. Several candles have long upper wicks, signaling rejection and selling pressure.
This may form a double-top or even a bull trap.
2. Volume Anomaly:
The upward price move shows decreasing volume, which is a classic signal of weak momentum. Without increasing volume, breakouts often fail.
3. Overextended Rally:
The pair has already made a sharp move up from below 1.1300 to near 1.1340. This type of parabolic move can lead to a snapback correction.
If bulls cannot decisively break resistance soon, profit-taking may trigger a short-term retracement.
4. Bearish Divergence Potential:
If RSI or MACD indicators are available, watch for bearish divergence (price makes higher highs while indicators make lower highs). This would reinforce downside risk.
5. Fundamental Pressure:
If any upcoming U.S. economic data (like PMI, FOMC minutes, etc.) is strong, it could boost USD and push EUR/USD down from this resistance.

Market next move Bearish Counter-Analysis:
1. Resistance Zone Saturation:
The red box shows repeated tests of the resistance area around $33.14–$33.20. This can suggest exhaustion instead of momentum.
Multiple failed attempts to break this zone can result in bearish rejection.
2. Volume Divergence:
The volume appears to be declining even as price approaches resistance. This divergence can imply a lack of buyer strength, which is a red flag for a bullish continuation.
3. Possible Bull Trap:
A sharp move above resistance followed by a quick drop back inside (false breakout) could trap long traders.
This may be followed by a sharp sell-off toward the previous support level (~$32.60–$32.80).
4. Candlestick Patterns:
Watch closely for bearish candlestick patterns like doji, shooting star, or bearish engulfing in the red box. Their appearance would strengthen a bearish reversal case.
5. MACD/RSI (if available):
If the RSI is overbought or MACD shows a bearish crossover, it would reinforce the possibility of a downward retracement.

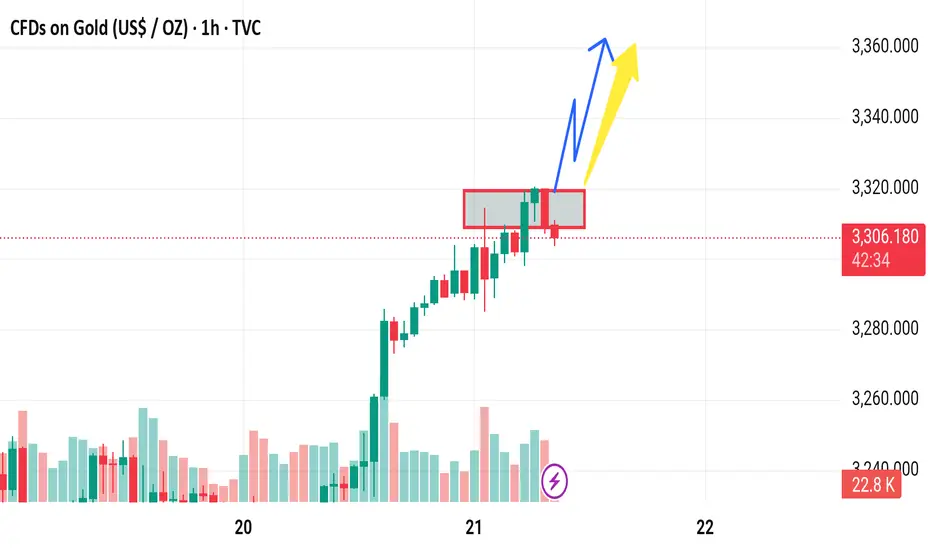
Market next move Bearish Disruption Analysis:
1. Weak Breakout Confirmation:
Although price broke above the red consolidation zone, it quickly pulled back within the range, suggesting a false breakout or bull trap.
The current red candle closing back into the range hints at bullish exhaustion.
2. Volume Divergence:
Note the declining volume on the recent upward push compared to the initial breakout on the 20th.
Lower volume during a breakout typically signals lack of conviction, weakening the bullish case.
3. Resistance Cluster:
The price is stalling just above the 3306 level — possibly facing resistance from previous highs or round-number psychological resistance.
Bears may take control if price fails to hold above 3300.
4. Potential Bearish Scenario:
Price re-enters the consolidation range and breaks below it.
Target zones could be:
3,290 (local support from the range base)
3,270 (previous minor support)
Further down toward 3,250 if momentum builds.
Market next move 1. Resistance Zone Already Tested
The price is currently testing a resistance zone (highlighted in red). Historically, prices have reversed from such levels unless there's a strong breakout catalyst. Without a clear breakout and volume confirmation above this zone, a reversal is plausible.
Bearish View:
If price fails to close decisively above 3,320–3,325, it may indicate a double top or false breakout setup, leading to a correction back toward 3,275 or lower.
---
2. Volume Divergence
Look at the declining volume bars while price pushes upward. This is a bearish divergence, suggesting weakening momentum behind the rally.
Bearish Implication:
Without increasing volume, the current move may lack the strength to sustain higher levels, opening the door for a pullback.
---
3. Overbought Short-Term RSI (not shown)
Assuming an RSI or momentum oscillator is present (often used with this type of analysis), there’s a high likelihood it is nearing overbought levels based on recent price action.
Bearish Risk:
Overbought conditions often precede short-term pullbacks or consolidations.
---
4. Potential Fake Breakout (Bull Trap)
The blue and yellow arrows suggest a breakout and continuation. However, a fakeout above resistance (bull trap) could lure buyers in before a reversal.
Disruption Scenario:
Price spikes above the resistance zone briefly, then sharply reverses and closes below the red box, leading to a fast drop as trapped longs exit.

Market next move Disruptive (Contrarian/Bullish) View:
1. Higher Lows Formation:
The price is consistently forming higher lows, which could indicate building bullish momentum, not weakness.
This could suggest a breakout attempt through the resistance zone rather than a rejection.
2. Volume Analysis:
Volume seems to be stabilizing (and even increasing slightly) on green candles approaching resistance.
This might indicate accumulation rather than distribution — a possible prelude to a bullish breakout.
3. Short-term Bull Flag/Pennant:
The price pattern just before entering the red box may resemble a bull flag, a continuation pattern.
If it breaks the flag upwards, it could target levels around $2,600+.
4. Failed Bearish Setups:
The earlier sharp drop was quickly recovered, showing buyer interest below $2,500.
This invalidates the strength of previous selling pressure.
5. Psychological Level at $2,500 Holding:
ETH is hovering just above the key $2,500 psychological support.
Holding above this level increases the likelihood of testing and potentially flipping resistance to support.

Market next move 1. Weak Momentum Into Resistance
The candles near resistance are small-bodied and lack strong bullish volume.
Disruption: This signals buying exhaustion. Price could consolidate or reverse sharply, especially if buyers fail to defend this level.
---
2. Resistance Zone Saturation
The resistance zone (highlighted in red) has already been tested multiple times.
Disruption: This could either lead to a breakout or—more likely in a weak volume context—a liquidity trap and reversal, as market makers use the expectation of a breakout to trap long positions.
---
3. Potential Double Top Pattern
Look closely at the two peaks around the resistance zone. They resemble a developing double top.
Disruption: If price fails to break out convincingly and starts dropping, this double top may trigger a fall back to $105,000 or even lower.
---
4. Bearish Divergence Possibility
While not shown on this chart, in cases like this, it's common for momentum indicators (like RSI or MACD) to show bearish divergence.
Disruption: Even if price hits slightly higher highs, a divergence could signal that momentum is fading and a deeper pullback is incoming.
---
5. High Sell Volume on the Spike (May 19)
That long wick candle with high volume around May 19 suggests strong seller interest above $107K.
Disruption: Buyers could struggle again in this zone, especially if that volume spike was from whales distributing.

Market next move 1. Overconfidence in Breakout:
The chart predicts a clean breakout, but the resistance zone has already been tested multiple times, indicating seller strength.
Disruption: Price might fake out above resistance and sharply reverse (bull trap).
2. Volume Confirmation Missing:
The breakout prediction lacks strong volume spike confirmation.
Disruption: Without increasing volume, any breakout attempt might fail and lead to a false breakout.
3. Short-Term RSI/Overbought Conditions (Not visible here):
If RSI or similar indicators are approaching overbought, it increases the chances of a pullback rather than immediate continuation.
4. Liquidity Sweep Risk:
Price may intentionally break the resistance to trigger stop-loss orders before reversing sharply (common in crypto markets).
Disruption: A stop-hunt move followed by a retrace to $105,000 or lower.
5. Macroeconomic or External Event Sensitivity:
If an external catalyst (e.g., Fed speech, ETF news, regulatory action) emerges, it can easily invalidate the bullish scenario.

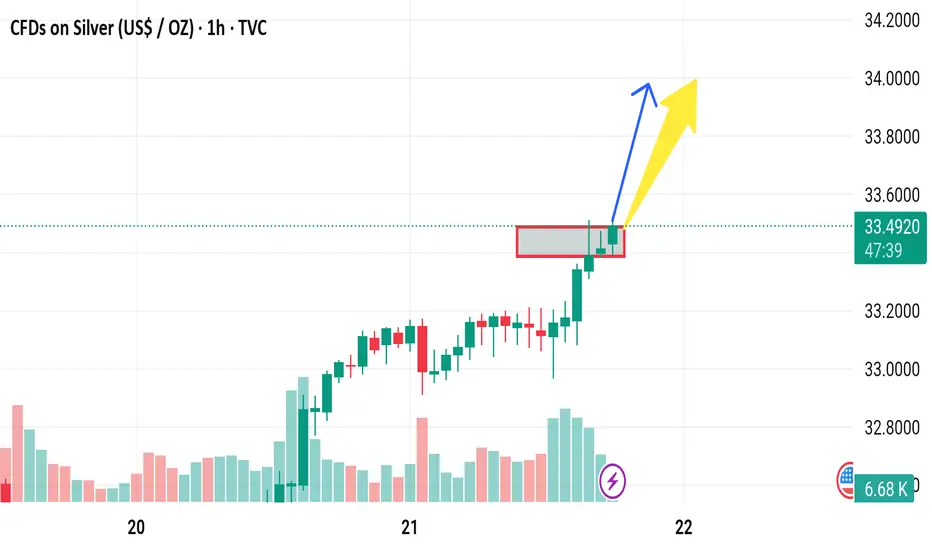
Market next move 1. False Breakout from Resistance Zone
Disruption: The price is testing a resistance zone (marked red box). If it fails to hold above this zone and falls back below 32.70, it could signal a bull trap.
Impact: This could invalidate the projected upward move and initiate a drop toward 32.20 or lower.
---
2. Divergence Warning
Disruption: If momentum indicators (RSI, MACD—not visible here) show bearish divergence while price climbs, it’s a warning sign of weakening buying pressure.
Impact: This often precedes a pullback or reversal despite bullish chart patterns.
---
3. Lack of Volume Confirmation
Disruption: The breakout is not supported by a significant increase in volume (volume bar is relatively modest).
Impact: Weak volume may mean the breakout lacks conviction and can reverse quickly.
---
4. Overhead Liquidity Zone Near 34.04
Disruption: The projected target of 34.0448 could act as a liquidity magnet, but also a selling zone where large orders may get filled.
Impact: Price might spike into that area and reverse sharply.
---
5. Macroeconomic Uncertainty
Disruption: Unexpected Fed comments, inflation data, or geopolitical shifts can cause Silver to defy technical expectations.
Impact: Could result in abrupt volatility that wipes out structured setups.

Market next move
1. Red Zone Retest Failure
Disruption: If the price breaks back below the red highlighted zone (around 3,265–3,270), it may indicate a false breakout.
Impact: This would invalidate the bullish continuation and could lead to a sharp decline toward 3,240 or even lower.
---
2. Low Volume on the Breakout
Disruption: The breakout rally appears strong, but if upcoming candles show declining volume, it may suggest weak momentum.
Impact: A drop in volume could precede a reversal or sideways consolidation instead of the projected move to 3,306.
---
3. Double Top or Bearish Rejection at 3,306
Disruption: The price could reach the 3,306 target and form a double top, leading to bearish rejection.
Impact: This could be the start of a downtrend or extended consolidation.
---
4. Overbought Conditions
Disruption: If momentum indicators like RSI or Stochastic (not shown on chart) are in overbought territory, this could suggest a pullback is likely before continuation.
Impact: May lead to a deeper retracement than expected.
---
5. Macroeconomic or News Catalyst
Disruption: Unforeseen macro events (e.g., interest rate announcements, geopolitical tension) could cause sudden shifts against the technical outlook.
Impact: Could override technical structure entirely.

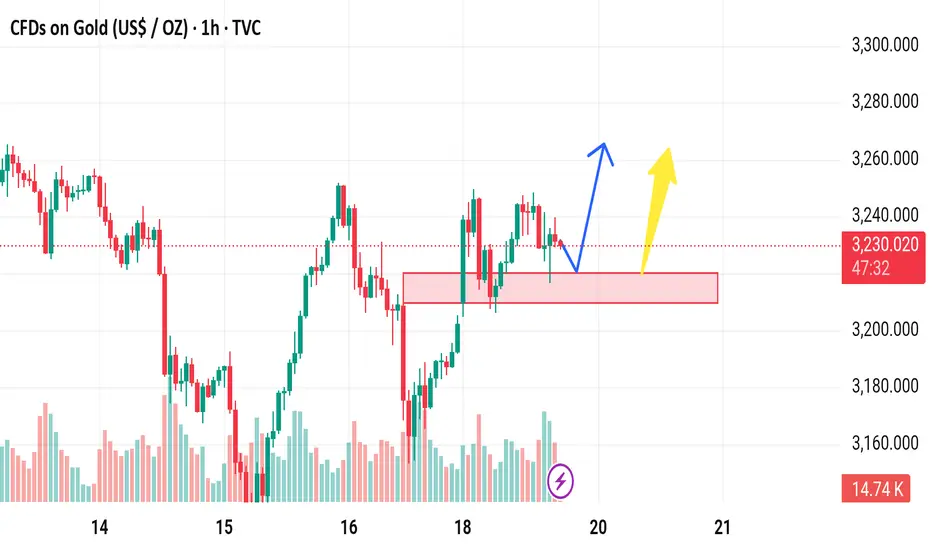
Gold next move The price is currently at a prior resistance level (~3,229) which may act as a supply zone. The market has already failed to break above this level multiple times in the past, indicating strong selling pressure.
2. Volume Divergence
If we analyze the volume at the most recent peaks, there's a possibility of lower buying volume despite higher prices—this could signal weakening bullish momentum.
3. False Breakout Risk
The chart suggests a possible pullback to the red demand zone before continuation. However, if the price fakes out into the zone and fails to hold above ~3,210, this could trigger a deeper selloff.
4. Double Top Formation Risk
There appears to be a potential double top pattern around 3,250–3,260, which may signal a bearish reversal if neckline support (~3,210) is broken.
5. Macroeconomic Influence
Unless supported by strong fundamentals (e.g., dovish Fed signals, rising inflation), any bullish breakout might lack fuel to sustain a rally beyond resistance.
Disruptive Bearish Scenario:
Price breaks below the red demand zone (~3,210).
Retests it as resistance.
Targets the next major support zone near 3,175–3,180.
EURUSD: 5th Wave pendingThe pair is rising impulsively and currently about to conclude it's 4th wave (Circle) and break the previous high under wave-5 circle. The confirmation for the same will come above 1.36.

CAD JPY Entry Setup 1 hour timeframe CAD JPY Entry Setup
Bearish break and retest
Candlestick confirmation: Doji and clow below
Risk to Reward: 1:3

Is There the Best Time to Trade Forex in the UK?Is There the Best Time to Trade Forex in the UK?
Grasping the nuances of forex market hours is essential for traders aiming to optimise their strategies. Operating continuously from Sunday evening to Friday night, the currency market accommodates participants across various time zones without being anchored to a singular physical location.
For those in the UK, recognising when to engage can dramatically influence outcomes. This FXOpen article discusses the pivotal currency trading sessions that may be optimal for UK-based traders.
Understanding Forex Market Hours
Understanding currency exchange market hours is crucial for anyone involved in the global foreign exchange market. Although you may already know this, let us remind you.
The forex market operates on a 24/5 basis, opening during weekdays and closing at weekends. This round-the-clock trading is possible because it’s not tied to a physical location; instead, it relies on a decentralised network of banks, businesses, and individuals exchanging currencies across different time zones.
For traders in the UK, knowing the best forex trading hours can be key to effective trading. The currency market is broadly divided into four main 9-hour-long windows, each starting at different times to cater to traders across the globe. The forex session times UK traders need to be aware of are:
- Sydney Session: 9:00 PM GMT - 6:00 AM GMT
- Tokyo Session: 11:00 PM GMT - 8:00 AM GMT
- London Session: 8:00 AM GMT - 5:00 PM GMT
- New York Session: 1:00 PM GMT - 10:00 PM GMT
Note that during British Summer Time (BST), some of these times are shifted forward by one hour.
These forex market trading times are essential to know, as they indicate when liquidity and volatility are likely to increase, potentially offering favourable market conditions.
The Optimal Times to Trade Forex in the UK
In navigating currency trading, UK-based traders should be aware of two key sessions: London and New York. These periods are optimal forex market hours in the UK, offering greater volumes, volatility, and liquidity. They’re also the periods that see the most releases for three of the major economies: the UK, Eurozone, and the US.
The core forex trading times in the UK are anchored around the London session, which is central to global forex market operations due to London's key position in the financial world. The London trading session time in the UK commences at 8:00 AM GMT (winter time).
This period, ending at 5:00 PM GMT (winter time), is pivotal as it accounts for roughly half of the forex transactions globally, making it a prime trading time due to the high liquidity and the potential for more pronounced price movements.
Likewise, the London-New York trading session time in the UK can be especially advantageous. It’s a crucial overlapping window occurring from 1:00 PM to 5:00 PM GMT (winter time), offering an avenue for traders seeking to maximise their potential returns due to the surge in activity and high-profile economic releases from the US.
During this window, the US stock market opens at 2:30 PM GMT. This secondary opening can also have a notable effect on US dollar-based pairs.
Economic Releases and the Impact on Trading Times for UK Traders
Economic releases and central bank announcements significantly influence UK forex trading times, often driving prices higher or lower. Many UK economic releases—affecting GBP currency pairs—are scheduled around 7:00 AM GMT. This timing offers traders opportunities to engage in trends post-release during the early hours of the London open.
However, some UK data and plenty of Eurozone data are released between 8:00 AM GMT and 10:00 AM GMT, periods typically characterised by increased liquidity and volatility, providing fertile ground for traders.
Likewise, many high-profile US economic announcements—non-farm payrolls, inflation statistics and employment data— are made between 1:00 PM GMT and 3:00 PM GMT. Given the US dollar's dominance on the world stage, these releases can present significant trading opportunities.
Although activity tends to quiet down after London closes, the late hours of the New York session still offer potential entries, albeit with generally lower volatility and volume.
Notably, Federal Reserve interest rate decisions are announced at 7:00 PM GMT with a press conference held after that can cause outsized price movements. The same can be said for the Bank of England and European Central Bank’s interest rate decisions at 12:00 PM GMT and 1:15 PM GMT, respectively, and their subsequent press conferences.
The Worst Time to Trade Forex in the UK
The worst times to trade forex in the UK often occur after 8:00 PM GMT, during the tail end of New York’s hours, when liquidity and volume significantly decrease. This reduction in activity can lead to less favourable trading conditions, including wider spreads and slower execution times.
Additionally, while the Asian session forex time in the UK, partially overlapping with the Sydney session, runs from 11:00 PM to 8:00 AM GMT, it presents challenges for UK traders.
Despite offering trading opportunities, especially in Japanese yen, Australian dollar, and New Zealand dollar-based pairs, the volumes during this period are substantially lower compared to the London and New York sessions. The Tokyo session forex time in the UK accounts for particularly unsociable hours anyway, so many UK traders are unlikely to engage in currency trading during this period.
Trading the London Session: A Strategy
The Asian-London Breakout Strategy leverages the unique dynamics between the calmer Asian session and the volatile London session. It involves setting buy/sell stop orders at the high and low points of the Asian period’s range, aiming to capture movements as London opens at 8:00 AM GMT.
With stop-loss orders placed above or below the range and a strategic approach to take profit – either at the end of the London session or by trailing a stop loss during the day – traders can potentially capitalise on the surge in activity. To delve deeper into this strategy and other session-based setups, consider exploring FXOpen’s 3-session trading system article.
The Bottom Line
Understanding forex trading hours and leveraging optimal times are pivotal for achieving favourable outcomes in currency trading. Luckily, UK-based traders are well placed to take advantage of the many opportunities the currency market presents, given their ability to trade both the London and New York sessions.
For UK traders seeking to navigate the complexities of markets with a trusted broker, opening an FXOpen account can provide all of the tools and insights necessary for effective trading.
FAQs
When Do the Forex Markets Open in the UK?
Forex opening times in the UK start at 8:00 AM GMT (winter time) and at 7:00 AM GMT (summer time) when the London session begins, marking the start of significant trading activity due to London's central role in the global currency arena.
What Time Does the Forex Market Open on Sunday in the UK?
The forex market opens on Sunday at 9:00 PM GMT (winter time) and at 10:00 PM GMT (summer time) in the UK, coinciding with Sydney’s opening and marking the beginning of the trading week.
What Time Does the Forex Market Close on Friday in the UK?
The forex market closes at 10:00 PM GMT (winter time) and at 9:00 PM GMT (summer time) on Friday in the UK, concluding with the end of the New York session and wrapping up the trading week.
Can You Trade Forex on Weekends?
Currency trading on weekends is not possible as the market is closed. Trading resumes with the opening of the Sydney session on Sunday at 9:00 PM GMT (winter time) and at 10:00 PM GMT (summer time).
This article represents the opinion of the Companies operating under the FXOpen brand only. It is not to be construed as an offer, solicitation, or recommendation with respect to products and services provided by the Companies operating under the FXOpen brand, nor is it to be considered financial advice.

CAD JPY BUY Trade Setup 2 hour timeframe On the 2 hour timeframe CAD JPY has broken a key structure level forming a Higher high and higher low uptrend pattern, we need to wait for a retest of the higher low level for the completion of a Bullish Break and Retest pattern, also this level align with the Fib Retracement zone 0.618-0.50
Entry will be based off candlestick confirmation on the retest level.
Patience Patience ⏰👌🏻

Xauusd surely fly XAU/USD trades near a fresh weekly high of $2,929.65, with higher highs in sight. The bright metal benefited from the broad US Dollar’s (USD) weakness, the latter affected by tepid United States (US) data and President Donald Trump’s massive tariffs on trade partners.
President Trump addressed Congress late on Tuesday and played down the potential negative effects of his latest round of tariffs. “. There'll be a little disturbance, but we're okay with that. It won't be much,” Trump said, adding that reciprocal tariffs on trading partners will come into effect

Xauusd confirm buy tradeXAU/USD, in the meantime, retains the $2,900 mark but retreated from an intraday peak of $2,927.91. The daily chart shows the pair is up for a second consecutive day, with another leg north still in doubt. XAU/USD is currently battling to overcome a mildly bullish 20 Simple Moving Average (SMA) while the 100 and 200 SMAs recovered their upward slopes far below the current level. Technical indicators, in the meantime, advance with moderated strength and within neutral levels, not enough to confirm a higher

Gold surely fly confirm trade read the caption Markets remain risk-averse as a global tariff war seems inevitable, with US President Donald Trump affirming 25% tariffs on Canada and Mexico effective on Tuesday while he already signed the order to raise China tariffs to 20%.
In response, China’s Commerce Ministry and the Canadian prime minister’s office confirmed retaliatory tariffs on the US, triggering a tit-for-tat situation, which could translate into a full-fledged trade war

Gold weekly expected move read the caption The metal resumes higher in wave ((iii)). Up from wave ((ii)), wave i ended at 2766.3 and wave ii ended at 2744.78. Wave iii higher ended at 2798.55 and wave iv pullback ended at 2788.43. Expect wave v higher to end soon which completes wave (i) in higher degree. Then the metal should pullback in wave (ii) in 3, 7, or 11 swing to correct cycle from 1.28.2025 low before it resumes higher again. Near term, as far as pivot at 2730.23 low stays intact, expect dips to find support in 3, 7, 11 swing for more upside

Gold dipping now keep hold short read the caption Gold price stands tall near fresh record highs after closing Thursday well beyond the symmetrical triangle target of $2,785 or the previous all-time high of $2,790.
The 14-day Relative Strength Index (RSI) is currently near 68, suggesting that there is more room to the upside before Gold price enters the overbought territory at 70

Gold will buy that's confirm read the caption The dismal mood somehow eased ahead of Wall Street’s opening, with the three major indexes now trading in positive territory. Gains however, are modest as investors gear up for the Federal Reserve (Fed) monetary policy announcement. The Fed is undergoing a two-day meeting, which will conclude on Wednesday. Officials will announce their decision afterwards, with officials widely anticipated to keep interest rates on hold. Whereas the accompanying statement and Chairman Jerome Powell’s speech are dovish or hawkish and will decide the market’s direction
