XAU/ USD) bullish trend analysis Read The ChaptianSMC Trading point update
analysis for XAUUSD (Gold vs. USD) on the 2-hour timeframe appears to suggest a bullish continuation setup after a correction. Here's a breakdown of the idea:
Key Points from the Chart:
1. Rising Channel:
The price is moving within an ascending channel.
After a breakout and strong rally, it is currently in a flag or wedge-like correction pattern.
2. Correction Zone:
The price is consolidating downward inside a small descending wedge (a bullish pattern), potentially forming a bull flag.
This is typically a sign of continuation after a strong upward impulse.
3. Support Zone:
A 4H support level is marked around 3,301.416, which aligns with the lower boundary of the flag pattern.
This is a potential buy zone for price to react and bounce.
4. Target Point:
The target is projected at 3,404.254, implying a breakout to the upside if the support holds.
5. RSI Indicator:
RSI is currently around 65, with previous values near 80, suggesting a slight cooldown but still in bullish territory.
A slight drop in RSI might occur before the next bounce.
6. EMA 200:
The EMA 200 is well below current price (around 3,137), indicating a strong bullish trend.
Mr SMC Trading point
Possible Trade Idea:
Entry: Around the 3,301–3,305 support area.
Confirmation: Wait for a bullish reversal pattern (engulfing candle or strong bounce).
Target: Around 3,404 (as per the marked target zone).
Stop Loss: Below the support zone (e.g., below 3,295), depending on risk tolerance.
Pales support boost 🚀 analysis follow)
Foryourpage

EUR/USD) resistance level rejected) Analysis Read The ChaptianSMC Trading point update
updated chart provides a more refined bearish outlook for EUR/USD. Here's the idea behind this analysis:
---
Market Structure Overview:
Resistance Level: ~1.14292
Mid Support Zone: ~1.13500
Major Support (Target Point): ~1.12658
Current Price: 1.13787
---
Indicators:
EMA 200 (1.12174): Price is above the 200 EMA, indicating an overall bullish bias, but that may be weakening.
RSI (14): Around 54.37, slightly bullish but neutral—no strong momentum.
---
Trading Idea:
1. Short-Term Bullish Move:
Price is expected to rise to test the resistance level around 1.14292.
2. Bearish Reversal at Resistance:
From there, a rejection is anticipated, leading to a drop back to the mid support (~1.13500).
3. Break Below Mid Support:
If the price fails to hold the mid support zone, a breakdown is likely to continue toward the target point at 1.12658, which aligns with the previous big support level.
Mr SMC Trading point
---
Strategy Suggestion:
Sell Setup 1: At resistance (~1.14292), with confirmation like bearish candles or divergence on RSI.
Sell Setup 2: On breakdown and retest of the 1.13500 support zone.
Take Profit: Target at 1.12658.
Stop Loss: Above 1.14300 or above the most recent swing high.
---
Pales support boost 🚀 analysis follow)

Bitcoin Bearish Reversal Setup: Rising Wedge Breakdown Targeting1. Entry Point:
Marked around $86,853, this is where a potential short (sell) trade might have been initiated.
2. Stop Loss:
Placed above $88,783, protecting the trade in case the market goes against the position.
3. Target Point (Take Profit):
Aiming down toward $74,443.76, suggesting a large bearish move is anticipated.
4. EMA Indicators:
30 EMA (Red Line) at ~$84,271: Indicates short-term trend.
200 EMA (Blue Line) at ~$83,496: Indicates long-term trend.
Price is currently trading above the 200 EMA but slightly below the 30 EMA, showing mixed short-term momentum.

USD/JPY) demand and supply analysis ); Read The ChaptianSMC Trading point update
shows a bearish setup for USD/JPY on the 1-hour timeframe. Here’s a breakdown
---
1. Trend Context:
Downtrend: The pair is clearly in a bearish channel, forming lower highs and lower lows.
200 EMA (~146.297) is above price and sloping down — confirms bearish bias.
---
2. Key Zones Identified:
Supply Zone (~144.800–145.200): A strong area of resistance where sellers may re-enter. If price returns here, it’s a potential short setup.
Demand Zone (~142.800–143.100): A possible reaction point where short-term buyers may provide a bounce.
Target Point (~141.168): A projected target if the downtrend continues and demand zone fails.
---
3. Expected Scenarios:
Primary Bearish Move:
Price may react from current levels or from the demand zone.
A pullback to the supply zone is expected before continuation downward.
Then, sell-off toward the target zone around 141.168.
Alternate Play:
Price could bounce between the demand and supply zones a bit more before breaking down.
---
4. Indicators:
RSI (~46.37): Shows room to the downside before oversold, aligning with bearish momentum.
Mild bullish divergence in RSI recently, suggesting potential for a small pullback or bounce.
Mr SMC Trading point
---
Summary of Idea:
This is a sell setup:
Sell entries: Ideal around the supply zone (144.8–145.2).
First target: Demand zone (~143.0)
Final target: 141.168
Invalidation: Break above 146.30 (200 EMA and channel resistance).
pales support boost 🚀 analysis follow,)

XAU/USD) Flag Analysis Read The ChaptianSMC Trading point update
Analysis presents a bullish outlook for XAU/USD (Gold vs USD) on the 1-hour timeframe, based on Smart Money Concepts (SMC). Here’s a breakdown of the key elements:
---
Key Analysis Points:
1. Order Block + Key Support Zone:
Price recently tapped into a bullish order block around the $3,166.74–$3,208.62 zone.
This area is also marked as a "key support level", suggesting a strong demand zone.
The confluence of the Fair Value Gap (FVG) and order block gives this zone higher validity for potential reversal.
2. Bullish Market Structure:
The chart shows higher highs and higher lows, indicating a bullish trend.
Price action broke above a small consolidation, showing bullish momentum is resuming.
3. Projected Target:
The target point is set at $3,283.01, suggesting about a 55-point upside from the current price.
This target sits above a previous high, indicating anticipation of a liquidity grab or breakout.
4. RSI (Relative Strength Index):
RSI is at 57.94, which is a neutral-to-bullish zone. It supports the idea that there's still room for price to move up before being overbought.
5. EMA 200 (Exponential Moving Average):
The price is well above the 200 EMA, confirming a bullish bias in the higher timeframe.
Mr SMC Trading point
---
Possible Strategy:
Long (Buy) Entry Zone: Between $3,166–$3,208 (ideal near the order block/FVG).
Target: $3,283
Stop Loss: Below the order block, ideally below $3,166 to avoid getting wicked out.
---
Final Thoughts:
This is a well-structured bullish setup based on institutional concepts like order blocks and FVGs. The price is aligned with the trend, and RSI supports more upside. However, watch for any major news catalysts (especially with those economic event icons shown).
Pales support boost 🚀 analysis follow)

USD/JPY Bullish Reversal Setup – Long Entry at 141.964 Targeting ahemdsaeed25: USD/JPY Long Setup – Eyeing 150.537 Target"
"Potential Bullish Reversal on USD/JPY"
"Swing Trade Alert: USD/JPY Long from 141.964"
"USD/JPY Breakout Play – Buy Zone Identified"
Let me know your tone preference (technical, casual, professional, etc.) and I can tailor the title further.
ahemdsaeed25: This chart is for the USD/JPY (U.S. Dollar / Japanese Yen) pair on the 1-hour timeframe, and it's displaying a bullish setup with a clear trade idea. Here's a breakdown of the analysis:
Key Components:
Current Price: Around 142.574.
Entry Point: 141.964
Stop Loss: 140.547
Take Profit / Target Point: 150.537
Reward-to-Risk Ratio: Favorable (approximately 5.94% upside, large potential move).
Indicators:
EMA 50 (Red Line): 142.798 — acting as near-term dynamic resistance.
EMA 200 (Blue Line): 144.699 — major resistance and a trend filter (downward trend visible).
Zone Analysis:
Support Zone (Purple Box near 141.964 - 140.547): This is the accumulation/buy zone.

Gold (XAUUSD) Trade Setup: Bullish Breakout Toward $3,637 TargeCurrent Price: $3,309.18
EMA 30 (Red Line): $3,265.00
EMA 200 (Blue Line): $3,163.35
Trend Direction: Strong uptrend (price above both EMAs)
Timeframe: 1-hour (short-term analysis)
📍 Key Levels
Entry Point: Around $3,266.63 (just above EMA 30)
Stop Loss: Around $3,265.00
Target (EA Target Point): $3,637.23
Potential Profit: +$365.01 or +11.16%
🔍 Technical Patterns & Zones
Rising Channel: Price is moving within a rising wedge or channel, indicating bullish momentum but with narrowing range — a potential reversal signal if broken.
Support Zone: Highlighted purple box around the entry point; likely a demand zone.
Resistance Zone: $3,637.23 area marked as the EA Target Point — previous resistance or Fibonacci extension level.
✅ Bullish Signals
Price is consistently making higher highs and higher lows.
EMAs are aligned in a bullish formation (short EMA above long EMA).
Clear breakout above consolidation range recently.
Trade setup shows favorable risk-to-reward ratio.
⚠️ Risks / Caution
Rising wedge can sometimes break down — watch for volume drop or divergence.
Potential pullback to the entry zone is expected (indicated by the arrow).
News Events: Symbols below the chart indicate upcoming USD economic data, which could bring volatility.
📈 Strategy Summary
Buy on pullback to $3,266.63 with tight stop at $3,265.00.
Target: $3,637.23 — potential 11% gain.
Risk: Minimal if stop is respected, tight stop-loss.

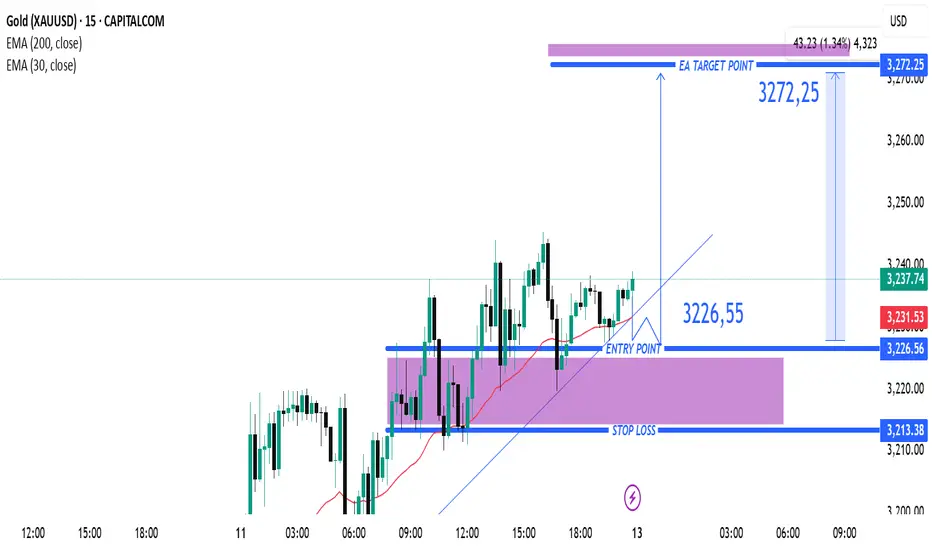
Gold (XAUUSD) 15-Min Buy Setup: Bullish Breakout with High Risk-Instrument: XAUUSD (Gold vs. US Dollar)
Timeframe: 15 minutes
Indicators:
EMA 200 (Blue): 3,170.78 (long-term trend indicator)
EMA 30 (Red): 3,231.53 (short-term trend indicator)
---
Key Levels:
Entry Point: 3,226.55 (highlighted with a blue arrow and line)
Stop Loss: 3,213.38 (purple zone bottom)
Target (Take Profit): 3,272.25
---
Trade Setup:
Type: Long (Buy) Position
Risk-to-Reward Ratio:
Risk: ~13.17 points (from 3,226.55 to 3,213.38)
Reward: ~45.7 points (from 3,226.55 to 3,272.25)
R/R Ratio: Approximately 3.5:1, which is favorable
---
Market Context:
Price is curren
Silver (XAG/USD) Bullish Trade Setup: Entry, Target & Stop-Loss Entry Point: ~32.35619
Take Profit (Target Point): 33.31252
Stop Loss: 31.87803
EMA 200 (Blue): 31.65932 – indicating long-term trend support.
EMA 30 (Red): 32.28304 – indicating short-term trend.
Current Price: 32.38220
The price is above both EMAs, which is typically bullish.
---
Analysis
1. Bullish Bias:
Price has broken and is holding above the entry zone.
Both EMAs are aligned in a bullish configuration (short-term EMA above long-term EMA).
The market structure shows higher lows and sideways consolidation, suggesting potential for a breakout.
2. Risk-Reward Ratio:
Risk (Entry to Stop Loss)

DXY Bullish Reversal Setup – Long Entry from Support Zone TowardEMA 30 (Red Line): Currently at 99.700 — tracks short-term trend, and price is hovering near this level.
EMA 200 (Blue Line): At 100.935 — indicates long-term trend, acting as dynamic resistance above.
📈 Trade Setup
✅ Entry Point:
Price: 99.699
Rationale: This level has been tested multiple times, forming a support zone. A bounce here signals a potential long entry.
🎯 Target Point (Take Profit):
Price: 102.738
Distance: ~3.04 points or 3.43% potential move upward.
Note: Marked as EA TARGET POINT, which suggests a calculated area possibly based on previous resistance or algorithmic strategy.
🛑 Stop Loss:
Price: 98.624
Reasoning: Just below the defined support zone (highlighted purple area), ensuring protection against downside breakouts.
📊 Risk-to-Reward Ratio
Entry: 99.699
Target: 102.738 → Gain of ~3.04
Stop: 98.624 → Risk of ~1.08
R/R Ratio: ~2.8:1 — favorable setup
📌 Overall Sentiment
This chart indicates a bullish reversal setup from a strong support zone, possibly targeting a mean reversion or trend reversal toward the 200 EMA and beyond.
However, keep in mind:
The price is currently below both EMAs, so the trend is still bearish.
The trade is counter-trend, relying on support holding and momentum shifting.

Gold (XAUUSD) Bullish Breakout Setup – Targeting 3,394.56 After EMA 30 (Red Line): Currently at 3,109.56
EMA 200 (Blue Line): Currently at 3,064.85
Price is above both EMAs, indicating bullish momentum in the short and long term.
📈 Trade Setup:
Entry Point: Around 3,162.15
Stop Loss Zone: Below the purple support box around 3,109–3,141 (right above the 30 EMA)
Target (Take Profit): 3,394.56 — marked as "EA TARGET POINT"
📊 Strategy Outlook:
Bullish Setup: The price recently broke out of a resistance zone (purple area) and retested it, confirming the breakout.
The risk-to-reward ratio appears favorable, as the target is significantly higher than the stop loss.
The upward price projection suggests confidence in a strong bullish continuation.
⚠️ Things to Watch:
Volume confirmation and price action near the entry level.
If price closes below the 30 EMA, it may invalidate the setup.
Always consider broader macroeconomic or fundamental factors when trading gold (e.g., USD strength, interest rates, geopolitical tension).

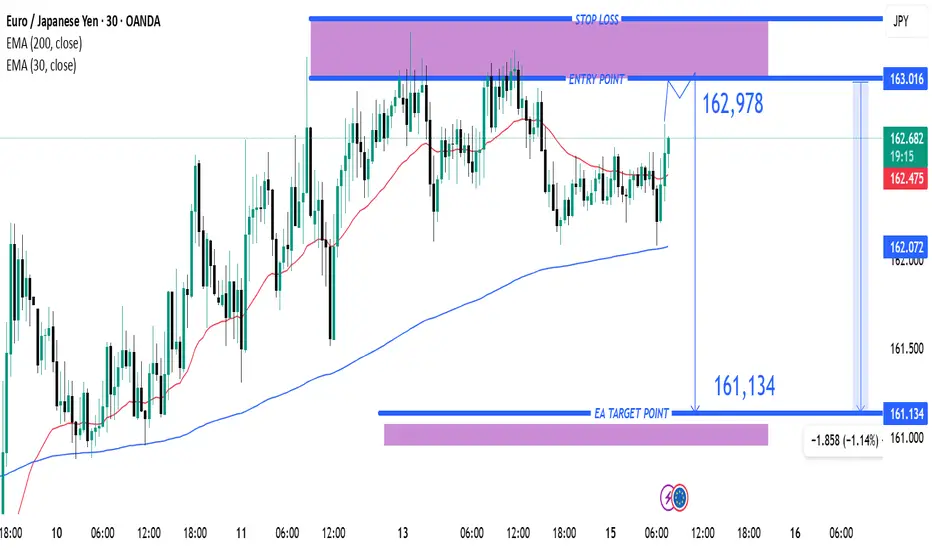
EUR/JPY Short Setup – Bearish Reversal Targeting 161.134 with TiEMA 30 (red): Currently at 162.470
EMA 200 (blue): Currently at 162.071
Trade Setup:
Entry Point: Around 162.978
Stop Loss: Slightly above 163.016 (highlighted in purple zone)
Target (Take Profit): 161.134 (labeled as “EA TARGET POINT”)
Analysis:
Trend: The pair has been trending upwards recently, as shown by the price staying above the 200 EMA.
Current Price: 162.604, just below the proposed entry.
Risk/Reward:
Risk: ~3.8 pips (entry to stop loss)
Reward: ~184.4 pips (entry to target)
This implies a favora
EUR /USD) resistance level rejected support level Read The ChaptSMC Trading point update
analysis of the EUR/USD currency pair on a 1-hour timeframe, and it presents a potential bearish setup. Here's a breakdown of the idea:
Key Elements:
Resistance Zone (around 1.14182):
The price is currently approaching a marked resistance area. The analysis suggests this could be a turning point where price may reverse.
Projected Movement (Black Arrows):
The chart predicts a double top formation or a rejection from the resistance level, followed by a strong move downward.
Target Point:
The drop is expected to reach the key support zone around 1.10942, aligning with a previous structure and a potential liquidity zone.
EMA 200 (around 1.10389):
Price remains well above the 200 EMA, suggesting the trend is still bullish overall, but the setup targets a potential correction or short-term reversal.
RSI Indicator (~60):
RSI is above 60 but not overbought yet. This supports the idea that there's room for one more push up into resistance before a drop.
Mr SMC Trading point
Summary of the Idea:
1. Watch for price reaction around 1.14182.
2. If there's a clear rejection or double top, a short position may be considered.
3. Target area is around 1.10942.
4. The setup assumes a corrective move in a broader bullish trend.
plase support boost 🚀 analysis follow)

GBP/JPY) Bearish analysis Read The ChaptianSMC Trading point update
GBP/JPY 2-hour chart outlines a clear bearish setup within a well-defined downtrend. Here's a breakdown of the trading idea:
---
Technical Overview:
Downtrend Channel:
The pair is respecting a downward-sloping channel, with repeated rejections at the upper boundary, confirming bearish control.
Resistance Zone (~187.8 - 188.5):
Price has reached a highlighted resistance area that aligns with previous swing highs and trendline resistance — marked with red arrows for prior rejections.
Bearish Projection:
The analysis anticipates a rejection from this resistance zone followed by a downward impulse move. A pullback is expected, but continuation toward the target support zone around 179.150 is likely.
Target Zone (~179.150):
This level lines up with previous price action and matches the measured move (blue vertical box), adding confluence.
EMA 200 (around 190.36):
Price is well below the 200 EMA, reinforcing the bearish structure and trend bias.
RSI Indicator (~52):
RSI is slightly above 50 but not bullish — this neutral reading suggests the pair has room to drop if resistance holds.
Mr SMC Trading point
---
Trading Idea Summary:
Bias: Bearish
Entry Zone: 187.8 – 188.5 (resistance)
Confirmation: Bearish candlestick pattern or rejection signal
Target: 179.150
Invalidation: Break and close above 190.365 (above EMA 200 and prior highs)
---
plase support boost 🚀 analysis follow)

WTI Crude Oil Bearish Reversal Setup – Short from Resistance ZonEntry Point: 62.66 USD
Stop Loss: 65.26 USD
Target Point (Take Profit): 55.09 USD
Indicators:
EMA 200 (blue): 60.92 USD — long-term trend indicator
EMA 30 (red): 60.75 USD — short-term trend indicator
Analysis:
1. Bearish Setup:
The price is approaching a key resistance zone marked by the purple shaded area near 62.66.
The strategy is to short from this level, anticipating a drop to the 55.09 target area.
2. Risk/Reward:
Risk (SL - Entry): 65.26 - 62.66 = 2.60 USD
Reward (Entry - TP): 62.66 - 55.09 = 7.57 USD
Risk-to-reward ratio: ~1:2.9, which is favorable.
3. Support/Resistance Confirmation:
Multiple touches at the resistance zone (or

XAU/USD) Bullish trand analysis Read The ChaptianSMC Trading point update
technical analysis of Gold (XAUUSD) on a 2-hour timeframe, with a bullish outlook. Here's a breakdown
1. Trend & Structure:
Uptrend Channel: Price is moving within a clear upward channel, respecting the trendline.
Higher Highs and Higher Lows: Indicates strong bullish momentum.
2. Key Zones:
Key Support Level (Yellow Box): Around $3,158.49 – this is the "safe entry point" if price pulls back.
First Entry Point: Around $3,222.76 – likely a breakout entry above a local resistance.
Target Point: $3,378.01 – a projected bullish target based on continuation.
3. Indicators:
RSI (14): Currently above 70 (overbought zone), but still climbing. There's bullish strength, but a pullback may occur soon.
200 EMA: Positioned below current price, confirming the bullish bias.
Mr SMC Trading point
4. Expected Scenarios (2 Paths):
Bullish Continuation: Price keeps rising, respecting the uptrend and hitting the target.
Pullback and Bounce: Price may retrace to the support zone or trendline, then bounce back up to target.
Summary of Idea:
This is a buy setup:
Buy at breakout above $3,222.76 (First Entry)
Safer buy at $3,158.49 (Support Re-test)
Target: $3,378.01
Watch RSI for pullback clues.
Pales support boost 🚀 analysis follow)

ETH/USD Bearish Reversal Setup – Targeting $1,470 After ResistanPair: Ethereum / U.S. Dollar (ETH/USD)
Exchange: Coinbase
Timeframe: 15 minutes
Indicators:
EMA 30 (red line): ~1635.82
EMA 200 (blue line): ~1585.79
🟣 Key Levels & Zones
Resistance Zone (Purple Rectangle Top): Around $1,647 – previously tested and rejected.
Support Zone (Purple Rectangle Bottom): Around $1,470 – marked as the "EATARGET POINT".
Current Price: ~$1,645
📉 Bearish Breakdown Setup
Chart Pattern: There’s a potential double top or distribution zone forming near the resistance.
Projection: The price is expected to break below the smaller support zone and drop to the target zone around $1,470.67, representing an 11.13% drop.
Measured Move Tool: Indicates a bearish price target if the price breaks down from the current consolidation.
✅ Confluence
Price is currently hovering under resistance.
EMAs show short-term bullish momentum but could flatten if breakdown confirms.
Support near $1,635 is being tested – a break below could trigger the expected drop.
⚠️ Trading Implications
Short Setup: A trader might look to enter short around $1,647 if breakdown confirmation occurs.
Stop Loss: Just above the resistance zone (~$1,650+).
Take Profit: Near $1,470 zone.

USOIL Short Trade Idea – Targeting $55.05 from $61.00Entry Point: ~61.00 USD
Stop Loss (SL): 64.77 USD
Target (TP): 55.05 USD
Risk/Reward Ratio: Favorable
Risk: ~3.77 USD
Reward: ~5.95 USD
Approximate R/R ratio: 1:1.58
🧠 Strategy Insight
Trend Context:
Prior to the entry zone, price shows a strong downtrend.
The price retraced upward into a resistance zone (highlighted in purple).
The setup suggests a short position anticipating rejection from this zone.
Indicators:
Moving Averages (red & blue):
Likely 50 EMA and 200 EMA showing bearish alignment (price mostly under both).
Resistance Zone:
The purple shaded region represents a supply zone, where price previously reversed.
Entry Zone Analysis:
Entry just below a recent rejection candle.
It's a conservative spot to catch a move back in the direction of the dominant trend.
Target Zone (55.05):
Likely based on a recent support level or demand zone from earlier price action.
Matches previous lows.
🔁 Possible Scenarios
✅ Bearish Scenario (Ideal Outcome):
Price gets rejected from the resistance zone and continues the downtrend toward the target at 55.05.
❌ Bullish Scenario (Risk):
Price breaks above 61.00 and continues toward 64.77, invalidating the short setup.

USD/JPY Bearish Reversal Setup – Short from Resistance ZoneCurrent Price: ~146.252
EMA 30 (Red): ~146.573
EMA 200 (Blue): ~146.662
The price is below both EMAs, suggesting short-term bearish momentum.
📉 Trade Setup:
Entry Point: 146.551 (marked on the chart)
Stop Loss (SL): 148.514 (above resistance zone)
Take Profit (TP): 142.374 (marked as “EA TARGET POINT”)
Risk/Reward Ratio (RR): Approx. 1:2.5+
📌 Zone Analysis:
Resistance Zone: 147.6 – 148.5 (highlighted in purple)
Previous highs rejected from this level multiple times.
Sellers appear to be defending this zone strongly.
Support Zone: 142.3 – 143.0
Previous accumulation zone marked for the TP.
🧠 Bias & Interpretation:
Bearish Bias: Confirmed by:
Price rejection from resistance.
Below both EMA 30 & EMA 200.
Bearish engulfing patterns near the resistance zone.
Potential Strategy: Short from 146.551 targeting 142.374 with tight SL at 148.514.
⚠️ Watch for:
Any bullish crossover between EMA 30 and EMA 200 could shift momentum.
False breakouts above the resistance zone before actual reversal.
Key U.S. or Japan news that may cause volatility.

GBP/USD Bullish Breakout Setup – Entry, Target & Stop Loss AnalyEMA 200 (blue line): 1.28423 – typically used to define long-term trend direction.
EMA 30 (red line): 1.28253 – shorter-term trend indication.
Currently, the price is above the 30 EMA and slightly above the 200 EMA, suggesting short-term bullish momentum with potential for trend reversal or continuation.
🟪 Key Zones and Levels:
Entry Point Zone: Around 1.28242–1.28423 (highlighted in purple).
Stop Loss: Set slightly below the purple demand zone at 1.27931.
Target (EA TARGET POINT): Marked around 1.29809.
🧠 Trade Setup Summary:
Risk/Reward: Good – aiming for a ~1.19% gain (~152.5 pips), with a relatively tight stop loss.
Structure:
The price has broken above a consolidation range (demand zone) and retested the zone (potential bullish retest).
EMA crossover could soon occur if the 30 EMA crosses above the 200 EMA, confirming bullish sentiment.
✅ Bullish Confirmation Signs:
Higher lows forming.
Break and retest of previous resistance (now support).
EMA proximity breakout is occurring.
Strong bullish candles near the entry level.
⚠️ Things to Watch:
If price closes strongly above 1.2860–1.2870, that could signal momentum continuation.
Failing to hold 1.2824–1.2800 might invalidate the setup and trigger the stop loss.
Watch for fundamental events (economic news, especially from UK/US) that could cause sudden volatility.

EUR/USD Bullish Breakout & Retest Setup – Targeting 1.10955Instrument: EUR/USD
Timeframe: 30-Minute
Indicators Used:
EMA 30 (Red): 1.09821
EMA 200 (Blue): 1.09698
Key Levels Identified:
Entry Point: 1.09695
Stop Loss: Around 1.09067
Resistance Zone: ~1.09911
Target Zone: ~1.10918 to 1.10955
Projected Gain: ~147.3 pips (1.35%)
Price Action Analysis:
Bullish Breakout:
The price broke out from a consolidation zone (marked in purple).
A bullish trend is forming as price moves above the 200 EMA.
EMAs Alignment:
The 30 EMA is currently above the 200 EMA, indicating a potential bullish trend continuation.
However, price is slightly below the 30 EMA now, suggesting some short-term pullback or resistance.
Retest at Entry Zone:
Price retested the entry zone at 1.09695 after the breakout and is now hovering near it.
This retest is healthy for confirming support before another move up.
Trade Setup Insight:
Entry Strategy: A long (buy) entry at or around 1.09695.
Stop Loss Placement: Below the previous support zone near 1.09067 to manage risk.
Target Strategy: Aiming for the resistance zone around 1.10918–1.10955 for profit booking.
Conclusion:
This looks like a bullish continuation setup with a favorable risk-reward ratio. The confluence of:
EMA support,
Price structure (breakout & retest),
and defined resistance/target zone

BTC/USD) rejected point analysis Read The ChaptianSMC Trading point update
This chart presents a bearish short-term technical analysis for Bitcoin (BTC/USD) on the 2-hour timeframe. Here’s a breakdown
---
Key Observations:
1. Downtrend Structure:
Price is forming lower highs and lower lows.
A clear downtrend is marked on the chart.
2. Rejection Zone:
The yellow highlighted area near $83,800–$84,000 is labeled as a “rejected point.”
Price touched this zone and got rejected again, confirming resistance.
3. 200 EMA (Exponential Moving Average):
The 200 EMA is at $82,291, acting as dynamic resistance. Price is currently below it, reinforcing bearish momentum.
4. Support Level / Target:
The yellow box at the bottom around $74,559 is marked as the support zone and target level.
This is the previous low and aligns with the lower boundary of the descending channel.
5. RSI (Relative Strength Index):
RSI is showing a potential bearish divergence and is pointing downward, suggesting weakening bullish momentum and a likely move lower.
Mr SMC Trading point
---
Trade Idea:
Bias: Bearish
Entry: Around $81,300–$82,000 (after rejection confirmation)
Target: $74,559 (support level)
Stop-loss: Could be placed just above the rejection zone, around $84,000
---
Pales support boost 🚀 analysis follow)

Gold (XAU/USD) 15-Min Short Setup: Bearish Reversal from ResistaEntry Point: $3,127.10
Stop Loss: $3,141.53
Target Point (Take Profit): $3,080.62
Technical Indicators:
EMA 30 (red line): $3,111.98 – showing short-term trend
EMA 200 (blue line): $3,056.92 – showing long-term trend
Setup Explanation:
This is a short/sell setup based on the following:
The price action has hit a resistance zone near $3,127 and shows signs of rejection.
The setup assumes that the price will reverse from this zone and head lower.
The Risk-to-Reward Ratio appears decent, aiming for a move of about -1.45% (-$45.34).
Current Status:
Price is currently around $3,119.69, below the entry point.
A slight bounce
