BTC Macro Cycle Still Intact Key Retest Zone Before Final LegBTCUSDT has sustained a well structured bullish formation since early 2024, consistently reacting to key trendline levels with precision. The initial major impulse started from the $38,545 region, rallying towards the $73,660 high, where the market faced rejection and confirmed a critical resistance zone. Several retests followed within the upper structure, with each rejection forming part of a larger consolidation before a decisive breakout occurred.
The most recent breakout above the $101K mark has confirmed renewed strength and continuation of the bullish cycle. We now expect a projected retest between the $106K–$110K zone, which should serve as the springboard for the next impulsive move. If this retest holds, the setup remains valid, and the bullish leg is expected to extend towards the confluence resistance zone around $123,420, $136,000, and $149,450. This upper range is likely to act as the final target area for the current cycle before any significant macro correction sets in.
The most strategic re-accumulation opportunity lies around the $100,000–$101,000 region, which aligns with the anticipated retest zone and key structural support. A successful hold in this range could offer a high probability entry ahead of a strong continuation move.
Feel free to share your insights on this setup. Let's engage in the comments and grow together. Your likes and support are greatly appreciated.
Thank you for taking the time to go through this!
Fractal

AAPL fractalThis whole year has been sort of a fractal for 2020 through 2022 for AAPL. Kind of crazy if you look at it. Lots of 5 wave falling wedges this year, and actually 2022 was one big falling wedge, sort of.
Expecting one more drop and then it's bull market back on. Can't believe I'm saying that but that's what the charts say.


Did the Black Swan prophets take note?The stock market crash of March/April 2025 looks almost like an exact replica of the COVID crash.

XRP vs XVG 8 Year Triangle Fractal Comparison 05 2025Logarithm. Time frame 1 month. Linear chart for clarity. Two cryptocurrencies of the super hype of altcoins in 2017 (the final alt season of the cycle before last). XRP is ahead of XVG. The structures are similar, but if XVG breaks through the triangle upwards like on XRP, then work with the first target, observing risk management. You can leave 5-10% of the position for the second target, but this is not necessary. As for XRP, everything is as before... local update in the XRP idea.
XVG Secondary trend (part) Resolution of the triangle 8 years 05 2025
XRP/USD Main trend 28 07 2022

Gold’s Multi-Decade Supercycle: $13,000 Is Not a Meme, It’s MathThis is not just a chart — it’s a map of the global financial psyche, spanning over 50 years of inflation, war, debt, and monetary decay.
What you're seeing is the multi-decade logarithmic structure of gold, starting from under $40 in the early 1970s to projections reaching above $12,000 and even $13,000 in the coming decades.
Each impulse, each correction, and each consolidation phase corresponds not only to technical patterns but to shocks in the global system:
📈 Key Historical Milestones:
1970s – Oil Crisis / End of Gold Standard → First explosion to $873
2001–2011 – War & Debt → From $254 to $1,900
2011–2018 – Lull Before the Storm
2020+ – Pandemic, ETF Adoption, Rate Chaos → New breakout in progress
Now, price is respecting a decades-long logarithmic growth line, with clear projected fractals suggesting:
🎯 Projected Price Milestones (Based on Structure):
Phase Target
Current Range Completion ~$3,800–$4,300
Mid-Term Expansion ~$5,800–$7,700
Final Supercycle Top ~$12,600–$13,000
This chart doesn’t claim time precision — it outlines magnitude. And magnitude matters when trust in fiat is collapsing faster than central banks can lie.
🔥 The Real Message:
Every dip in this chart was political calm.
Every pump was systemic collapse.
If you're waiting for gold to “correct,” maybe the world needs to break first.
⚠️ Disclaimer:
This is not financial advice or a recommendation to buy or sell.
It’s a macro-technical exploration of long-term capital flow and systemic risk.
Stay sharp. Stay solvent. Stay golden. 🪙
Trade safe and stay profitable.

Bitcoin H4 just flipped the script — again.Bitcoin H4 just flipped the script — again.
Wicked below $103K, reclaimed with force.
Now pushing toward $106K+ — buyers stepped in hard.
Break and close above $106.8K?👉 That’s the trigger for new highs on this leg.
Momentum is back. Structure is alive.

Trap to trapBTC has faked a breakout above its range. As usual, this turned out to be a bull trap, but the volume already suggested that this pullback would also be a trap, with the real breakout to follow. We may see it now.

ETH + ALTSEASON | NEW All Time Highs Soon ??This would have been the first time that BTC made a new ATH during a bullish cycle, but ETH didn't - are we too hasty?
Very interesting to compare the two side by side and see that ETH has much more to gain than BTC:
The BTC new ATH update can be found here:
______________________
BINANCE:BTCUSDT BINANCE:ETHUSDT

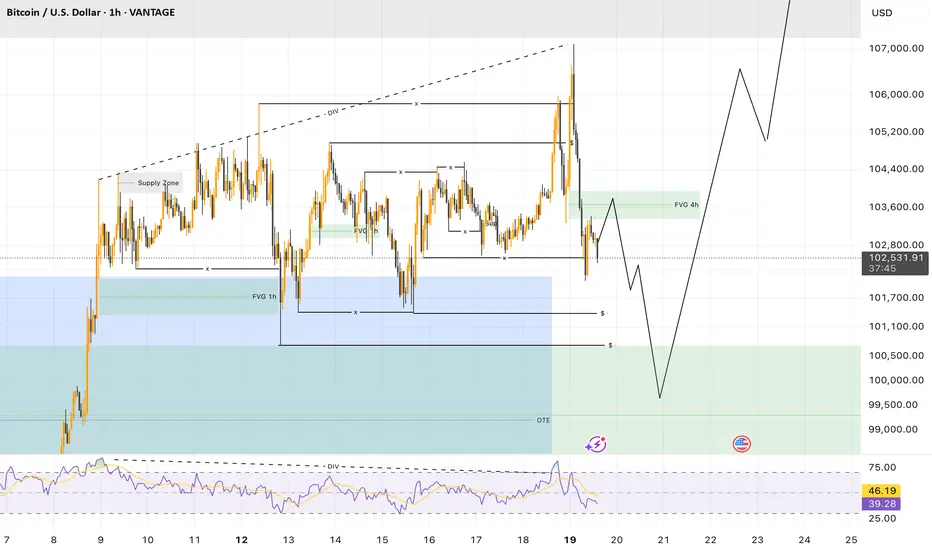
Bitcoin (BTC/USD) – 1H Analysis🧱 1. Market Structure : Accumulation Pattern Still in Play
Bitcoin is still evolving within a clean accumulation structure at the highs. Despite a seemingly flat consolidation, recent price behavior clearly signals manipulation, typical of a reaccumulation phase.
➡️ On Sunday, the market triggered a bullish fakeout : price briefly swept the range highs before getting immediately rejected, a clear sign of liquidity grab followed by institutional repositioning.
🎭 2. Manipulation & Hidden Intent
This type of reaction (instant north sweep + rejection) suggests that the market :
Is not yet ready to break out for good,
Prefers to trap breakout traders,
And aims to remain in a smart compression phase.
Moreover, the accumulation continues above the Bear OTE zone, indicating ongoing buyer pressure, though still discreet.
📉 3. Retracement Hypothesis: Return to 100K $?
A likely scenario includes :
A retrace to the 50% mark of the Bear OTE (around $96,300–$100,000), which also holds a weekly FVG,
A quick liquidity sweep to the downside,
Followed by a final north-side swing that could unlock a new ATH.
This would form a classic structure :
Accumulation → Manipulation → Explosive Expansion
✅ Conclusion
📌 The current range remains constructive, even if lengthy.
BTC continues to build within a high-stakes setup. The market shows clear signs of prepping for a major breakout, but may still :
Trap the impatient (bullish fakeout),
Flush out southern stops (deep retest toward 100K),
Then unleash a powerful breakout to the upside.
🔥 As long as $100,000 holds, the setup remains strongly bullish mid-term.
🎯 Target: Reclaim the ATH, then extend towards $115K–$120K.
EurAud..Daily Volume Imbalance fillGood day traders, I’m back with another great idea on EurAud and what I like about this setup, is that we can also learn from it.
On our daily TF we have a clear volume imbalance since price opened on Monday with a gap and it failed to fill the gap last week meaning it might happen this week where price can fill the gap. On the chart I’m showing you the high/low of the volume imbalance but you can add the midpoint of that gap too if you wish to do so. Price tried filling that gap but we can see it failed to do so because price did not even get to the midpoint of the VI, after it touched the lower quarter of the VI, it pushed lower showing weakness in price.
Jumping to the present TF 4H here we can see that we have a bullish flow in price but out structure remain bearish. Going into the new week we wanna see price continue in its original structure to Atleast our first presented FVg that has been noted on the chart. Currently price is inside an inverted FVG which again supports our narrative. We can expect price to fill the 1st.PFVG on Tuesday the latest before it can move higher and for the week we want to see price close above the volume imbalance.

BTC Medium Term and Local Work for 2025 18 05 2025Logarithm. Time frame 3 days. Everything is shown extremely accurately, according to technical analysis, logic based on cyclical repetition, and liquidity consolidation zones as a result of price and trading movements. This trading idea, with precise reversal zones and targets, will last you for 31 weeks. That is, for 7 months.
The previous trading idea BTC/USD Triangle. Medium-term and local work , published on 7 06 2024, it lasted me almost 1 year. It has 63 local work updates (I don't spam with new trading ideas on principle). So, nothing will get lost, you can follow everything, read, possibly use it as training material on a live chart, as a whole explanation of local work, what is really happening on the market, profit/loss potential, always before the price movement, and not after the fact. I show what is, that is, a chart and potential work from the position of a trader, not a crypto marketer.
🟣 Local and medium urgent now
1️⃣💸 The bullish triangle itself (which is not there yet, I have depicted it on the chart for you) acts as a stop and consolidation zone (zone “psychology 100”, reset in trend No. 1). This is the easiest to manipulate and the most probable scenario. This will just be the summer consolidation. Instead of it, there may be:
2️⃣💸 Rising wedge , but more in shape like a triangle (essentially a wedge, there is a meaning of a triangle, but it was formed on aggressive pump news), with a large short liquidity takeout, and not very good logic of the TA movement after that... But, this is a bullish scenario, although quite aggressive.
3️⃣ Working out the bearish targets of the triangle (non-corrective price movement within its canvas). Stopping the decline in the designated zone and reversal upward (continuation of the trend). I emphasize the importance of not fixing the price below the zone of targets of the local corrective decline, which will not break the trend.
4️⃣💸 Double top (or triple). Double top as in 2021 in the distribution zone. This is the least likely scenario, but the most negative, as it breaks the trend. But, this is the least likely scenario, primarily because of the altcoins.
Altcoins in 2021 and now.
4️⃣In 2021, when Bitcoin formed a double top, they (altcoins) were in “space”, that is, in their distribution zones (+500-1000% of the average price of the set).
🔽Now everything is the other way around, they are in capitulation zones (most of them) or in their long-term accumulation channels :
Liquid -90-93%
Medium liquid -93-96%
Low liquid -96-98% or some are already scams or on the verge of it...
Some altcoins have pumped up earlier. That is, they left their long-term accumulation zones earlier. For example: SUN, XRP, DOGE, PEPE, SOL and so on... But there are very few of them, as distributing (raising the price, holding it and selling, inspiring to buy expensive when everything is cheap) in a bearish altcoin trend is very irrational, and you need a lot of money to go against the general market trend.
Main trend (most of it, chart since Binance Exchange foundation) for clarity on a large time frame of this local zone for work.
BTC Primary trend. Secondary — expanding triangle.

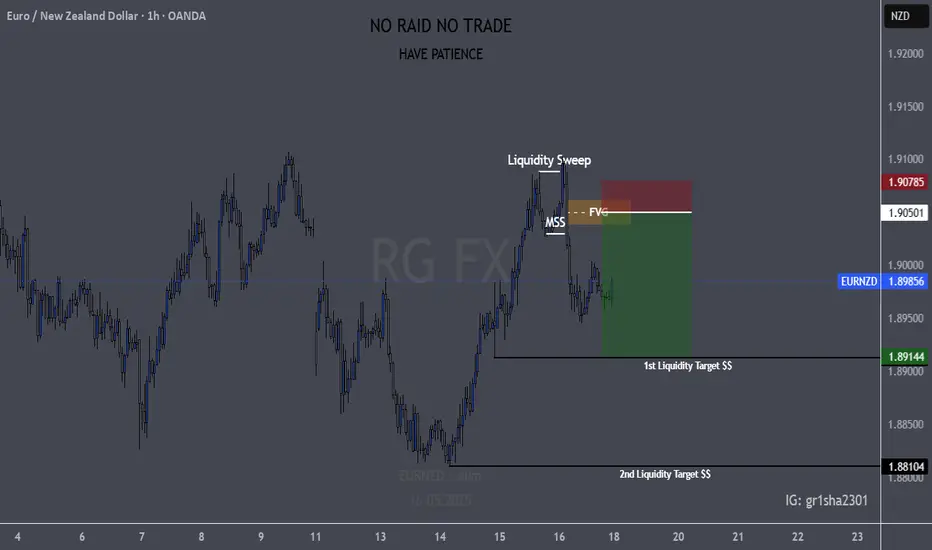
EURNZD 1hr Potential Sell setupWe have a 1hr liquidity sweep with MSS, which has created FVG for our entry. Both TP targets are the main liquidity levels marked. We'll just have to wait and see if the trade will trigger and if it plays out.
BTC | New ATH Incoming | + 135% ??A very interesting fractal from 2021 lead to a 135% increase - and a new all time high.
Bitcoin has been following similar patterns to the bullish twin-peaks in 2021. After a multi-month correction, the price proceeded to increase another 135% over the next few months. Some weeks fast, and some weeks sideways.
Is it possible that BTC follows a similar pattern - and increase another 135%, all the way to 170k?
Hec, I'd even be happy with just a 100% ! That would lead us up to around 149k, which can also be considered a phycological resistance zone.
While you're here! Check out this post on PEPE:
_________________
BINANCE:BTCUSDT

DXY 1W Forecast until the end of MAY 2025Up-trend will resume and last until the end of February 2025 topping no higher than 114. Current bottom is in at 105.9
Hence, it shouldn't fall below.
After February a consolidation period of 1,5 months will trap price action between the bottom of 122.16 and upper level of 114.9
The spring squeezed during consolidation will provide enough energy for further upwards movement starting in the end of April 2025. This will ignite a chain of devaluation of national currencies followed by epidemic inflation across the globe. This will finish/cool-down at DXY reaching the mark of 148.
New reality after May 2025?

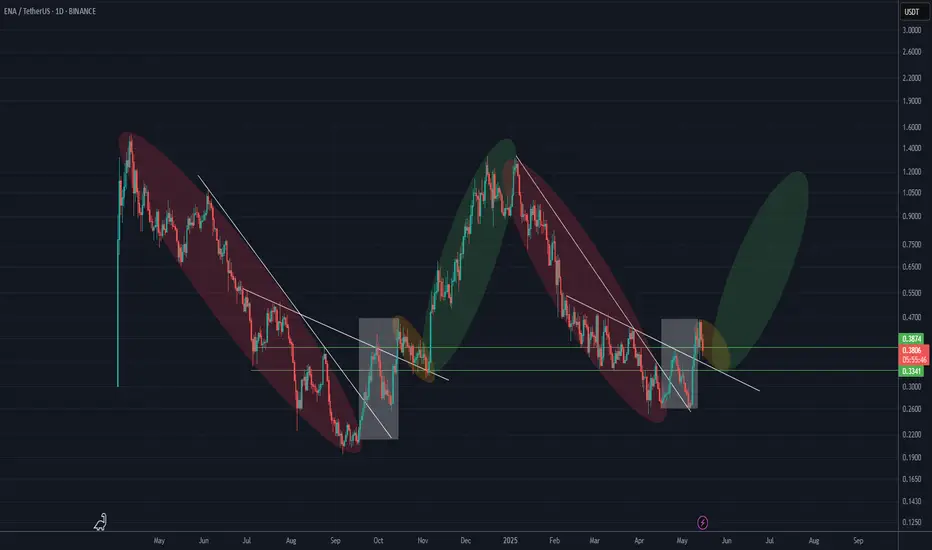
ENA is repeating a bullish fractal (1D)Look at the red, white, yellow, and green boxes in order, and then pay attention to the white trigger lines. You’ll notice that the previous phases | the end of the bearish trend (red box), followed by a bullish move for breakout (white box), then a pullback (yellow box), and finally the main bullish move (green box) | are now repeating.
Also, the price is currently sitting within the trading range marked by the two green lines, which is a key area. After the pullback is completed, a bullish wave is expected to begin, potentially reaching at least around the previous all-time high (ATH).
For risk management, please don't forget stop loss and capital management
Comment if you have any questions
Thank You
GME - Uncertainly certainThe future is simply bright, from a top down view, GME is executing on the turnaround, by betting on Bitcoin. Simple as that, the future trajectory of this stock will be heavily tied to the Digital Gold, which is a good thing.
This turnaround also exposes Gamestop to future volatility events happening in the Cryptocurrency world. Up or down, once the pile of coins gets big enough, GME will benefit... Or go through intense selling periods (à la MSTR).
My proposed targets are :
- $65 August 2025
- $137, January 2026
- (-60% heavy correction through most of 2026)
- $174+, January 2027 this date being my personal MOASS date : January 27th 2027.
Confident in the leadership, confident in the market short and medium term. Those two factors could launch us into the second leg of this bull market, we may see GameStop perform exceptionally well, even on words and promises. Thankfully video games will sell themselves (GTA 6), consoles will too (Switch 2), but GME is finally about to become a lot more than that.
Don't sleep on it because it's a meme stock, these perform the best when the market goes banana on stimulus and deflation. If everything hits at the right time, then this 21% drop on SPX we've gone through in March and April of 2025 was the best dip buy ever.
GME forever bottomed in 2020, and since they started executing on the turnaround, the ceiling has been truly raised, although it was always high from the get-go :D
I must say, about that $174+ I honestly think, it's much much higher than that, I'm expecting this target to be busted through quite easily, ultimate target : $501. If, and if we get there, early 2027, I'm looking at a quite fantastic event, some kind of big news will shake up the markets, but GME, with a little bit of help from BTC could go through inversing main indices.

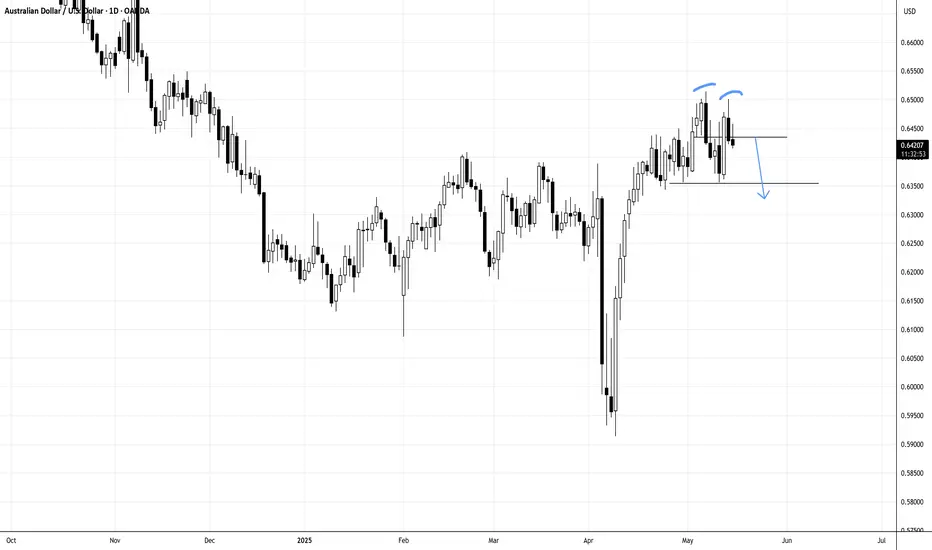
AUDUSD IN DOUBLE TOP, MAY REVERT TO ITS MEAN...AUDUSD
N.B!
- AUDUSD price might not follow the drawn lines . Actual price movements may likely differ from the forecast.
- Let emotions and sentiments work for you
- ALWAYS Use Proper Risk Management In Your Trades
#audusd
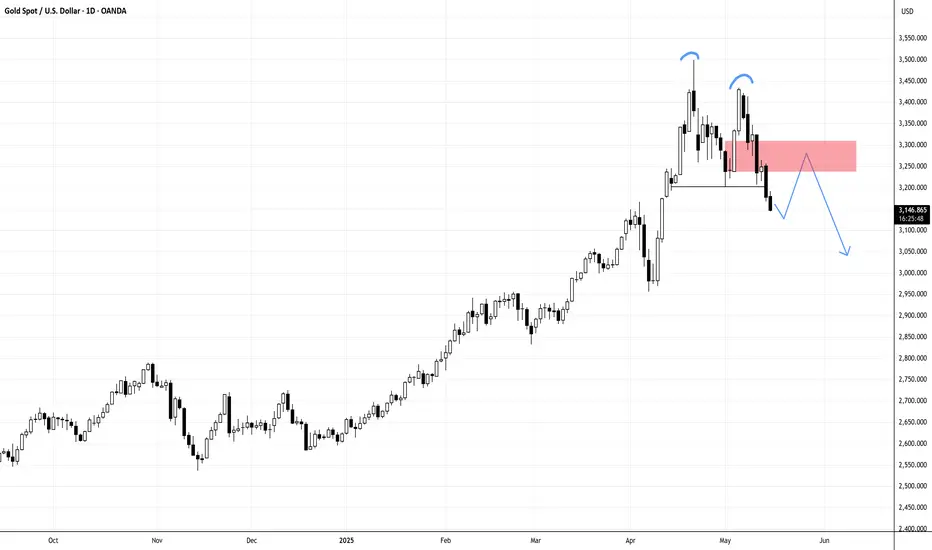
Gold Bearish Outlook Will Drag Price Further Down!Gold has just closed below a low (making lower high and lower low); a price pullback above 3,200 will likely cause XAUUSD price to further go down...
N.B!
- XAUUSD price might not follow the drawn lines . Actual price movements may likely differ from the forecast.
- Let emotions and sentiments work for you
- ALWAYS Use Proper Risk Management In Your Trades
#gold
#xauusd
DKNG | $50 UpdatePrice is set to head towards $50. Would like to see a pullback near bullish volume just after we push a little higher.

EURUSD/M15
💫 The Euro structure is bearish in the higher time frame, while we have a bullish trend in the intermediate time frame.
👈 According to the marked zones on the chart, if the price returns to the green zone and we see a trigger, we can enter a sell position targeting the lower green zone.
👈 Given the bearish structure of the higher time frame, we anticipate further decline. However, for lower targets, we will wait for the price's reaction to the lower zone, which will confirm the trend change in the intermediate time frame.
⚠️ Please note that if you enter a sell position, your first target should be the lower green zone.
⚠️ Be cautious: If the price touches the lower green zone without returning to the upper zone and then moves back up, the upper zone is invalidated, and no further positions should be taken in that area.
#Eurusd/M15

DYM New Update (3D)It seems a fractal pattern is repeating. The red boxes represent the drop waves, while the green boxes indicate the sideways waves.
It appears that the second drop wave, with over a 92% decline, has ended, and the price has entered a trading range phase.
The price corrections can be considered as opportunities for buy/long positions, and the top of the red box can be regarded as the peak of this wave.
For risk management, please don't forget stop loss and capital management
Comment if you have any questions
Thank You

$DXY Up, M2 Money Supply DownWhen the DXY goes UP,
M2 Money Supply goes DOWN.
Remember the 12-Week Lead correlation with CRYPTOCAP:BTC
