Fractal

$75K BIT COIN: ReboundSo, since my last forecast we've finally after a few weeks reached the $75K mark. Is the bloodshed over? No.
Price is respecting areas where pivots happens based on the data thus far it is moving in a sellers market profile since it made its sharp decline on entering February 2025. At the end of February it was confirmed with the selloff that took it down to$78K and has a sharp bounce reaction as the buyers were getting squeezed the pressure was on there was profit taking also causing a selloff ripple effect.
Now finally having just tapped below $75K and briefly bounced, is the nightmare over? Based on the economic outlook my take is, we're not done with down momentum. I would expect price to dabble inside the two black horizontal lines and try to balance itself in this area $70-$65K. But that doesn't mean it cannot continue to bomb dive to a psychological price level $50K which makes total sense after hitting $100K.
Understand that all other coins have lost nearly or more of their value. If you were on the sidelines and cashed out at the highs consider yourself smart or lucky or both-- that was a good move. But are you considering buying at what some consider this to be a 'discount selloff' to buy the dip and HODL once more for a return to ATH?
Crypto tends to do its run during Fall/Winder. Is it smart to buy now or wait more mid-summer to start loading up the boat?
What are your thoughts!

BTCUSDT - The condition for the continuation of the upward trendToday I am here with another analysis. Thank God, so far, about 85% of the analyses I have presented on the Trading View platform have reached their goal, and I expect that with your support and introducing this page to your friends, I will be able to focus on newer analyses with more energy.
So let's move on to Bitcoin analysis.
Before this analysis, I had published several other analyses about Bitcoin, one of which is still open and I am waiting for it to reach its goal, which you can see on the right side of this article.
But this analysis is from another perspective on Bitcoin conditions.
Maybe my opinion is a further decline in price, but this market is a market of possibilities. It is possible that the impact of a piece of news will shock the market so much that the price can move strongly upwards. So, in the current economic conditions and Trump's presidency, everything is possible!
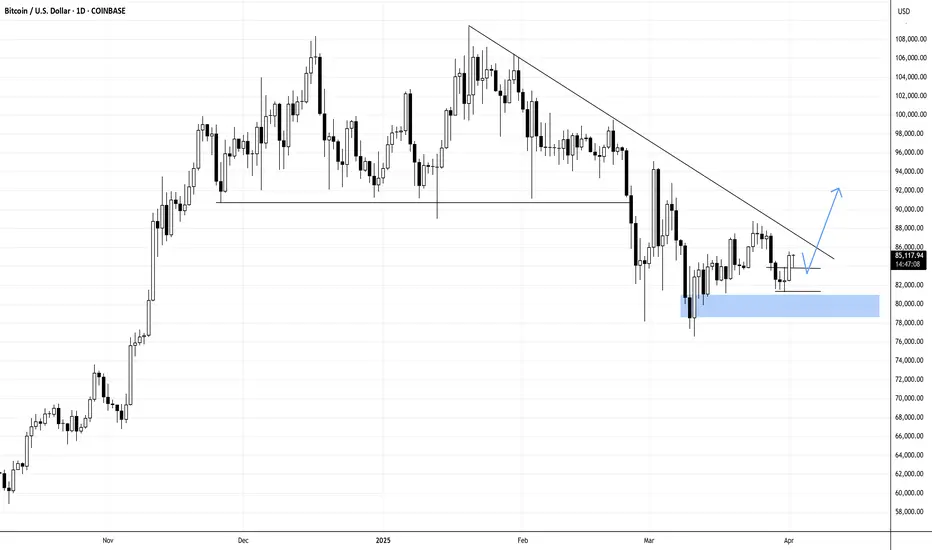
But technically, my view is still more decline, but what technical conditions make us say that Bitcoin will continue its upward trend and will no longer make a new high?
Everything is clearly marked on the chart. For Bitcoin to have a shift structure, it needs to break $94,416.46 on the higher timeframe, even with a shadow. Then we can think about buying with more certainty, but in this situation, I think it is risky to buy blindly and wait for the price to rise immediately.
If you are buying in spot (not futures) and you intend to buy in the medium to long term, I think buying steps can be very good even in this price range and lower. But if you are buying and selling in futures (which I do not recommend at all), you should look for a point with high probability.
My personal opinion and my view is more of a price drop, but this does not mean that the bull cycle is over because we have not yet seen signs of a bear market on higher timeframes such as weekly and monthly.
I hope you enjoyed this analysis
Please support me by following my page
be profitable

USDJPY BUY BIASUJ started the week bullish thus i'm looking forward to buy possibilities until a clear change in trend happens.

$BTC Retests 50WMA For The First Time in 217 DaysAs expected,
CRYPTOCAP:BTC retested the 50WMA for the first time since September 2024 (217 days ago).
₿itcoin historically has outsized reactions when this happens.

2022 NQ Bear Market Fractal scenarios Index has declined more than 20% and we've failed RSI 40 on weekly, indicating a bear market has started. Best case scenario, I could see it bottoming around 16,666/15000 and recovering very quickly with a blow-off top +100% in less than a year, similar to 2000, topping around 30k-33k.
Bear markets typically last 3M-3Y, with most ending in a year or less. This one topped mid Q1, so mid Q2, Mid-May, might be a great time to buy, if only for a few weeks. Bottoming there after 3M would fit close to orange pattern, or stretch it 3M to bottom mid Q3, October.
Green pattern is the only 1:1 with 2022 top to present, with a bottom around 1Yr and then blue and green are steeper variation bottoming a little later, mid 3Y.
Pink is more of a 2000 top with 3Y bear market, but would just be a recession.
Red is worst case scenario; great depression followed by rapid hyperinflation that sends markets screaming with exponential gains just to outrun inflation.
You can stretch the scales on idea to zoom in and out and see the patterns better, or try drawing your own.
Linked are my ideas from 2022 top. There is more confirming TA, but removed for clarity on an already busy chart.

ADA might be repeating the 2025 US elections price actionThis repeating pattern makes you wonder if we are living in a simulation.

HYPEUSDshort selling set up, cancel trading if break strong high.
DISCLAIMER:
what I share here is just personal research, all based on my hobby and love of speculation intelligence.
The data I share does not come from financial advice.
Use controlled risk, not an invitation to buy and sell certain assets, because it all comes back to each individual.

QQQ: Tariff ReactionNASDAQ:QQQ As China strikes back with a 34% tariff on U.S. goods starting April 10, the global trade landscape could see some serious turbulence. This follows Trump's tariff moves, and the market's already feeling it: QQQ’s daily chart shows capitulation volume on the table, suggesting a potential bounce— IF tariffs ease.
But until these trade tensions subside, it's likely to be a rocky ride. Tariffs push prices up, inflation lingers, and the Fed finds itself boxed in. The outcome? A market crash, recession, and stagflation—yet, there's still hope for a bounce, depending on how these factors play out.
Manage the levels with us at ChartsCoach.

YM / Dow Jones - long term perspectiveOn the CBOT_MINI:YM1! weekly/monthly/quarterly chart, nothing is looking out of the ordinary as of right now.
No matter what timeframe you're looking at, all timeframes have to go through cycles of rise and fall, and this current panic is just a normal red candle on the quarterly/monthly charts.
After this monthly/quarterly pullback, I'm still expecting a push higher to reach at least 48k before any longer term weakness should set in, if at all.
I see $34k-$38k as a mid-term discount zone, with 42-48k as a mid-term premium zone, with 48k as a magnet of sorts for price to draw toward.
I have 2 scenarios I'm currently watching for:
MID-TERM PULLBACK: Bull market stays intact, Trump ISN'T actually Hitler :-), price sweeps under $38k and sets up bounce back toward 48k from there.
LONG-TERM PULLBACK: World falls apart, Trump IS actually Hitler :-), bear market commences, multiple quarterly red candles, price does a deep pullback to $27.5k before rebounding from there.
SCENARIO 1 (seems most likely):
SCENARIO 2 (seems very unlikely):
Mostly, I would just counsel people to have a plan. "If bull market stays intact, do XYZ. If bear market develops, do ABC."

DKNG Update | Second Fractal | Extended TargetsPrice action looks very similar to the '23 Q3 play where we saw a double bottom move taking off from $26 - $49 which is also the ABC move that carried the 3rd impulse wave of the original fractal.
We're still in correction wave 4 and are about to start wave 5 shortly from now to July.
It's possible we could see price action higher than $74 based on the new fractal overlay and with the help of the fib extension.

Tsla Lesson Tesla Stock Always Pay YOURSELFI say this time and time again and this is a PRIME EXAMPLE SO FAR.
🌍Now I suggested THAT IF YOU WERE A TESLA BULL that you might want to start to PAY ATTENTION TO THE STOCK TWO WEEKS AGO.
❓️"OK SO WHAT'S THE LESSON"❓️
I emphasise ALWAYS that TIME TRUMPS PRICE...
TESLA has been rather docile since its initial POP.
But take a look at the HIGHER TIMEFRAME WEEKLY CHART❗️
Whats clear to see is that although the PRICE RANGE hasn't been MASSIVE there has been plenty OF ⏳️TIME TO CAPITALISE AND PAY YOURSELF. £$€¥ 💰
Two 📈HIGHER CLOSES ON THE WEEKLY and the call made whilst the weekly looked EXTREMELY BEARISH📉
EVEN RIGHT NOW we are currently UP ON THE WEEK UNTIL NOW.
ℹ️ If you WERE UNABLE to STRUCTURE A TRADE TO TAKE advantage of this PRICE RANGE whilst DAY TRADING you may need to LOOK BACK and STUDY WHY NOT.
⚠️You could have paid yourself several times over already and even if TESLA was to seek lower prices from here you SHOULD HAVE BACKED SOMETHING ALREADY.
✅️AS ALWAYS TRADE YOUR PLAN & WAIT FOR YOU SIGNAL✅️

xauusd/M15
"In the specified lower range, I expect a buy upon observing a trigger up to the identified supply range. Additionally, I anticipate a breakout above the ceiling from that point. The best range for taking a buy is the identified lower range, where you can proceed with a trigger aligned with your style."

BITCOIN!BTCUSD!
N.B!
- BTCUSD price might not follow the drawn lines . Actual price movements may likely differ from the forecast.
- Let emotions and sentiments work for you
- ALWAYS Use Proper Risk Management In Your Trades
#ethusd
#crypto
#btcusd
IAG Airlines Group what next? $261 Reached & Breached! $172?🤔 IAG Airlines Group what next?
ℹ️ $261 Reached & Breached!
Will the $261 be regained and start to offer some support or is $172 NEXT?❓️❔️❓️
🌍 To be completely transparent I have no horse in this race at the moment BUT I really would like a serious flush to try and accumulate a long-term POSITION.
🟢SeekingPips🟢 is not interested at current price at all unless we start to see some SERIOUS VOLUME START TO COME IN TO PLAY

BTC @ ~$100k == GOLD @ ~$1kGold is always a good fractal to use for projecting Bitcoin.
Gold price action around the MIL:1K area is very similar to what we are seeing on BTC currently.
Flip $90k to support and it's go time for BTC.
1st target is ~$200k.
-@CryptoCurb

Research: Interconnected Scalable ComplexitiesIntegrating another fibonacci channel into a formerly discovered interconnected structure:
Direction defined by HH's: Mar '24 & Dec '24; Mapping to LL Nov '22 Price breaking over this channel is a signal of continuation of bullrun in a bigger scale (like 2016 BR).
Interconnected Fractals in respect to Phi:
My work revolves around understanding and interconnecting scalable complexities, forming the foundation for a probabilistic framework that accurately models the underlying patterns and relationships driving price movements over time. Achieving this requires analyzing how price historically reacts to key levels and projecting this consistency for a future price coverage. This research will be used to build an indicator that automatically generates these levels in Pine Script.
Please, confirm in comment section if you would like me to do traditional subjective TA over objective Fractal Analysis. I highly appreciate your involvement!


Tweet and ideaYou can use tweet and idea on ideas. For example, you can use Elon Musk tweets and ideas GameStop’s Bitcoin Bet Fails to Wow Traders.

Btcusdt/M15Bitcoin's structure is currently bearish, and after a retracement to approximately 87,000 units, it might experience an upward move if it can break through the upcoming zone. However, it is expected to continue its downward trend to touch its lower range once again.
💫 For those looking to purchase for long-term holding, it may be better to wait for lower price levels.
💫 For those interested in swing trading, you can consider entering step-by-step positions if the price returns to the previous lower zone before touching the upcoming range. Hold the position until the first target is reached or potentially until the main range mentioned, followed by updating the analysis.
💫 If the price breaks through the upcoming range, I will update the analysis for re-entry opportunities.
💥 I’d be happy to receive your reactions and support

Xauusd/M15Gold is structurally bullish, so it's better to exercise caution when taking sell positions and avoid trading against the trend as much as possible. In the 15-minute timeframe, when the price reaches the specified zones, you can enter buy positions based on your trading style by observing the trigger.

TESLA is up 47X vs the SPX. Can it do another 6.9X?An extraordinary unicorn enterprise, or a collection of companies and intellectual properties, led by the most prominent CEO in the history of public companies.
TESLA and ELON are impossible to overlook, and this chart has kept many observers on the sidelines for over 14 years. In the initial 6 to 9 years, Wall Street analysts and commentators failed to grasp the bigger picture, focusing excessively on the balance sheet and evaluating the company merely as an automaker. They completely missed the groundbreaking technologies being developed and advanced.
Today, we stand on the brink of fully autonomous vehicles becoming commonplace, artificial intelligence integrating into our everyday lives, and affordable space exploration becoming a reality, not to mention the myriad of other innovative technologies emerging from this remarkable company.
Individuals often enjoy predicting market peaks and labeling stocks as overvalued.
However, this chart comparing Tesla to the S&P 500 indicates that the stock may be gearing up for another surge to new heights.
Picture 10 million robotaxis cruising through our streets.
Envision a fleet of vehicles that not only generates income but also undergoes upgrade cycles, in contrast to traditional cars that face maintenance cycles, and are bogged down by Human operator's.
This development is poised to significantly transform the self-hailing ride-sharing market and the food delivery sector, potentially eliminating the role of human drivers.
In fact, Uber could very well become Tesla's largest client!

