DKNG Update | Crash AheadOne of the best fractal overlays I've seen with some Elliott Waves to go with it.
Price is still in a uptrend but with growing sellers It'll come to an end similar to the last fractal.
During the 3rd wave in the last pattern price experienced its first pullback at (B), and its second at correction wave 4 and the third after the last wave before we witnessed the last push in buyers.
This current cycle price is in a similar stage with a swing low at (b) meaning that we could see another run-up towards major resistance ($63).
This would be the final blow-off-top in general markets. TVC:RUT is already showing signs of weakness which works well with this TA example.
When the time is right I'll do another TA for the downfall. For now I'm bullish but for the horizon I'm very bearish.
Fractal

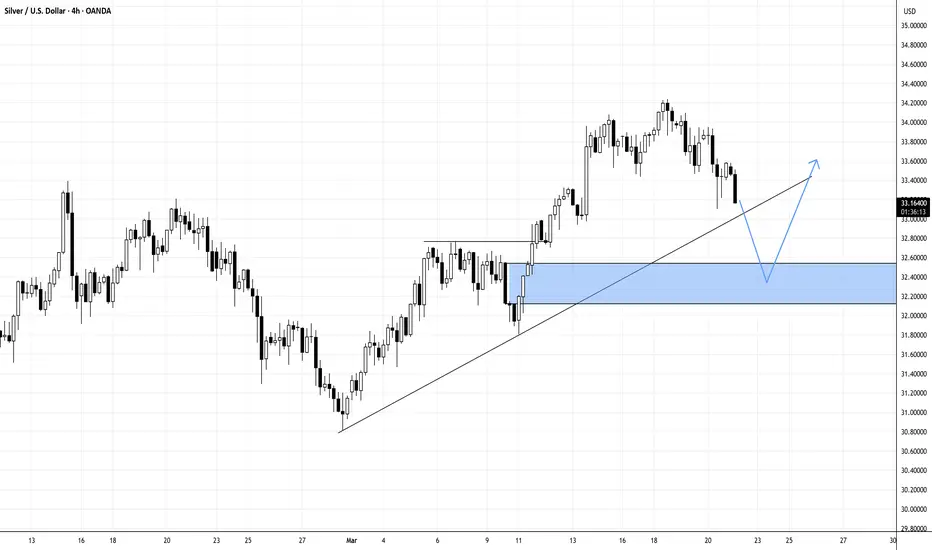
WILL SILVER DIP BELOW 32.6 BEFORE ITS RALLY TO TEST RECENT HIGH?Silver Price Movement...
N.B!
- XAGUSD price might not follow the drawn lines . Actual price movements may likely differ from the forecast.
- Let emotions and sentiments work for you
- ALWAYS Use Proper Risk Management In Your Trades
#silver
#xagusd
EURCAD Breakdown: Major Reversal Incoming? Watch This Setup!In this video, we analyze a high-probability trade setup on EURCAD, breaking down key market structure shifts and potential reversal zones. 📊
🔹 Massive impulse move into key resistance – Is a pullback coming?
🔹 Breakdown of bullish structure – Signs of a trend shift?
🔹 Key entry & exit points mapped out – Waiting for confirmation at 1.5595
🔹 Targeting major liquidity zones – Potential downside to 1.5523, 1.5400, and 1.5155
If price rejects our marked resistance zone, we could see a strong move downward, stopping out euphoric buyers and creating new trading opportunities. But what if it breaks above? We discuss both scenarios and how to react accordingly.
📍 Watch until the end for a full breakdown and trade execution strategy!
💬 Drop your thoughts in the comments! Do you see something different in this setup? Let’s discuss.
🚀 Like, share, and follow for more market insights!

Squawk! Bitcoin Longer, Larger, and Exponentially Growing Cycle!Squawk! Bitcoin Longer, Larger, and Exponentially Growing Cycle!
Bitcoins market cycle is expanding, lasting longer than most anticipate! As price channels widen over time, the scale of each move grows exponentially, extending both the peaks and the troughs! It’s Squawktasticly bigger!

it is about the time don't you think?risk reward 1 to 609
risking 16.67% to make 10,150%
might be the trade of my life.
do your own due diligence.
go deep into the technology.

XRP Update | $5Similar accumulation pattern to what we've seen last year December. Price action is holding up nicely above the 150d SMA on a daily TF with bullish closes also sitting above the 8d SMA.
Volume is looking very good too with price sitting above the value area.
I'm using the fibonacci extension to get a local target of $5.

WILL AUDUSD STRUCTURE LEADS TO A LONG TRADE?With AUDUSD making HH and HL with this bullish trend results into a long trade for the pair?
N.B!
- AUDUSD price might not follow the drawn lines . Actual price movements may likely differ from the forecast.
- Let emotions and sentiments work for you
- ALWAYS Use Proper Risk Management In Your Trades
#audusd

Trading Plan for the Day (March 18) | EUR/USDMarket Overview:
The EUR/USD pair is showing an upward impulse followed by a downward correction. With a higher probability of continued upward movement, the focus will be on identifying high-quality trade setups to capitalize on this idea.
🎯 Key Zones for Long Positions:
IDM (Initial Drive Momentum):
A critical support zone where price may bounce or consolidate.
If the price breaks IDM with a full-bodied candle, the path to IDM OB (Order Block) opens up.
IDM OB (Order Block):
A strong demand zone that could act as a target for long trades.
Manipulation within Order Flow (OF):
Watch for price action around the ascending order flow zone. If liquidity builds before IDM and gets swept, long positions can be considered at these levels.
📉 Alternative Scenario (Bearish Bias):
If the price drops deeper, it may target the ascending order flow zone located below PDL (Point of Demand Level).
This scenario suggests a potential retest of lower support zones before any upward continuation.
📊 Trading Plan:
Primary Focus: Monitor the interaction with IDM liquidity.
Breakout above IDM: Look for long opportunities targeting IDM OB.
Liquidity Build-Up: If price consolidates and sweeps liquidity before IDM, consider long entries at these levels.
Secondary Focus: If the price falls deeper into the ascending order flow, wait for confirmation of a reversal or consolidation before entering long trades.
⚠️ Risk Management:
Stop-loss should be placed just below the nearest key level to minimize risk.
Position size should ensure risk does not exceed 1% of the trading capital .
🎯 Note: The market is dynamic, and the current structure may evolve. I will adapt to what the chart shows and focus on high-probability setups.
📢 Wishing everyone a profitable trading day!

Trading Plan for the Day (March 19) | EUR/USD
Market Overview:
According to the current market structure, we can anticipate a continuation of the upward movement. The focus will be on identifying key zones of interest for potential long trades.
🎯 Key Zones for Long Positions:
Order Block (OB):
The price is currently testing the OB zone. However, since this zone has already been mitigated, the lower boundary of the OB becomes significant.
A retest of the lower part of the OB could provide a high-probability entry point for long trades.
Liquidity Zones Below OB:
If the price moves lower, watch for liquidity grabs in these areas.
A full-bodied breakout of liquidity would open the path to the IDM OB (Initial Drive Momentum Order Block) , which will be our next target.
📉 Short Positions (Low Probability):
Short trades are less likely at this stage, as the market structure suggests upward momentum.
To consider shorts, we would need to see liquidity building above the PDH (Previous Day High) and a break in the current structure.
Until then, I will focus on long opportunities unless there is a clear shift in market dynamics.
📊 Trading Plan:
Monitor the interaction of price with the lower boundary of the OB.
Retest Scenario: Enter long if the price confirms support at the lower OB boundary.
Liquidity Grab: If price moves lower and sweeps liquidity, wait for a breakout before targeting IDM OB.
Avoid short positions unless the price builds liquidity above PDH and breaks the structure.
⚠️ Risk Management:
Place stop-loss orders just below the nearest key level for long trades.
Ensure position size does not exceed 1% of your trading capital to manage risk effectively.
📢 Wishing everyone a profitable trading day!

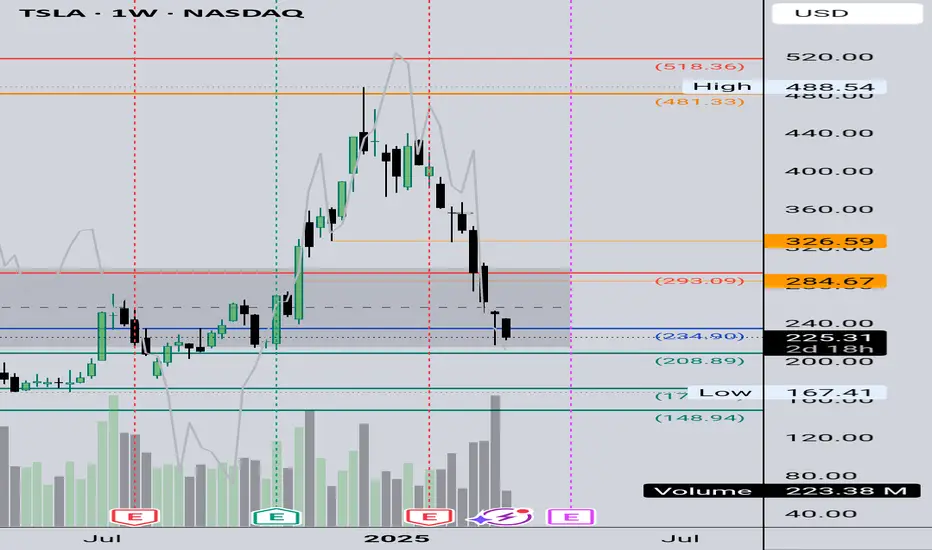
Tesla What Next? TSLA Buy Bargain OR Bust?✅️Now you guys know my thoughts on this and although TESLA has been beaten ⚫️black⚫️ and 🔵blue🔵 recently somehow there may be an opportunity on the horizon.🚀
ℹ️ The way I look at it is unless you think TSLA is dead forever and to be cast to the dustbin 🟢SeekingPips🟢 would be looking for a buying opportunity.
👌I don't know who coined the phrase first however it's one that 🟢SeekingPips🟢 loves and uses often it's
⭐️"BUY WHEN THERES BLOOD IN THE STREETS"⭐️
⚠️Now don't get me wrong it doesn't mean I will be loading up gun ho RIGHT AT THIS MOMENT but it certainly DOES MEAN I'M NOT A SELLER AND STALKING BUYING OPPORTUNITIES✅️
❓️What's you thoughts on Tesla❓️
Share your thoughts with 🟢SeekingPips🟢
AMD: Fibonacci Framework (Fractal Analysis RECAP)In this idea, I’d like to share a quick recap about my unconventional approach to understanding the chaos of the market.
Price movements don’t just mirror fundamentals, they also reshape them in continuity. Relating recent fluctuations to historic swings is crucial, because markets operate within a structured, evolving framework where past price proportions subtly wire the future. The interplay between bulls and bears doesn’t unfold randomly — it reflects recurring behavioral cycles encoded in historical patterns. Each swing carries the imprint of collective psychology, liquidity dynamics, and structural forces, which tend to repeat in varying scales. In Fractal Analysis, I recognize 2 key aspects of price dynamics: magnitude (price) and frequency of reversals (time).
For example, capturing the direction of past bullish wave can be used to define boundaries of future bearish waves. In logarithmic scale, the movements exhibit relatively more consistent angle (as percentage-based distance factors in natural growth).
To build structural framework, we need another 2 chart-based frames of reference because having multiple Fibonacci channels layered across cycle creates a collective framework of confluence zones, where price reactions become more meaningful. When several channels align or cluster around the same price levels, those zones gain credibility as potential support/resistance, because independent measurements are pointing to the same structural levels. This is why by analyzing price within a broader historical context, we gain perspective on where current price action fits within the larger market narrative.

XRP Next Move !... $4 XRPUSD Ripple Just A Matter Of Time? $€£¥This space seems a bit quite now but if you liked XRPUSD / XRPUSDT at $3 what has changed now?
When the hype is around thats the time to be ⚠️ cautious IMO.
When there is little attention of the said market thats when 🟢SeekingPips🟢 likes to get to work.
⚠️This time is NO different⚠️
NOT SURE WHERE THE NEXT LOW WILL FORM❓️
ME NEITHER❗️❕️❗️
🟢 You don't need to know❗️ You just need to HAVE A PLAN ✅️

SPY: Breakout from descending channel, rebound underwayThe SPY (ETF tracking the S&P 500) has just broken upward from a clearly defined short-term descending channel identified by the Adaptive Trend Finder (ATF) indicator. This indicator automatically detects the current dominant trend (here at 150 periods) with high relevance, as evidenced by the strong correlation highlighted by the indicator.
Prices are currently moving towards the Hull Moving Average (HMA), which acts as a dynamic short-term resistance. A confirmed close above the HMA (blue line) would strengthen the bullish scenario.
Fractals validated by the Williams Fractals Ultimate indicator also support this rebound, indicating a potential reversal towards the median line of the long-term channel defined by ATF (1200 periods).
Monitor the relative volume (RVOL), currently low, to confirm the bullish recovery. An increase in volume would strengthen the conviction of a sustained upward movement.

Trading Plan for the Day (March 18) | XAU/USDMarket Overview:
Gold (XAU/USD) is trading near historical highs, indicating strong buying pressure. However, a potential candlestick pattern could signal a short-term correction.
🎯 Plan for the Day:
Short Positions (Short-Term):
I will consider entering short trades if a bearish candlestick pattern forms (e.g., pin bar or engulfing pattern).
Target: The nearest liquidity zone on the M15 timeframe.
Risk-to-Reward Ratio (RR): Greater than 1:5.
Long Positions (Short-Term):
If the price "sweeps" the liquidity at IDM (Initial Drive Momentum), I will consider entering a short-term long trade.
Target: The next liquidity zone on the upside.
📊 Chart:
Attached is a chart with key levels marked: historical highs, IDM, and nearby liquidity zones.
⚠️ Risk Management:
Stop-loss will be placed just beyond the nearest key level.
Position size is calculated to ensure risk does not exceed 1% of the trading capital.

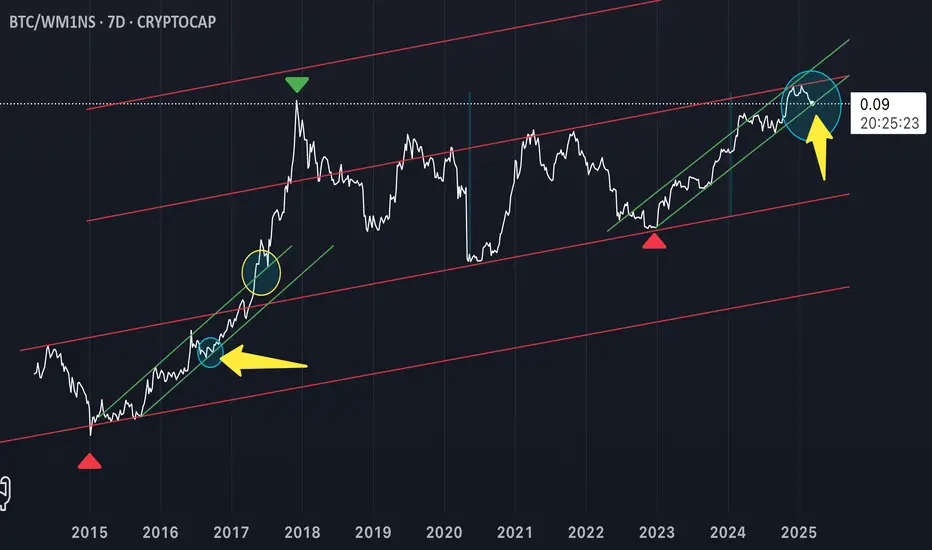
Where is Bitcoin?Squawk! Currently Bitcoin is at the 2nd yellow arrow! Compare to the first arrow for the roadmap my Squawky friends!
Devastating Fractal (Zoomed out / actualised)So I've made this sketchy idea regarding this fractal.
Short term failed, but now we here
That's why I updated it, still last phase is a mess regarding previous levels.
MM and Cartel I love you.
My last 3 ideas are all structure inspired by this structure in 2021-2022
BET

Devastating Fractal I think the market is still playing this fractal, will update later another chart, but Pics below
We are just after second green EMA touch

Gold Update | $3,200Strong uptrend and a similar fractal pattern like the last setup. Price is at the 5th wave and 3rd secondary wave.

EURUSD Local shortHTF - Short. Waiting for test 4h imb, than looking for reaction or ignoring this zone. but price will take this lvl

Bitcoin Green Channel Are Telling!Waiting for Bitcoin to meaningfully breakout up through this 2nd green channel and confirm, followed by a steeper angle of attack move up! BTC/ WM1NS 7 Day Chart.
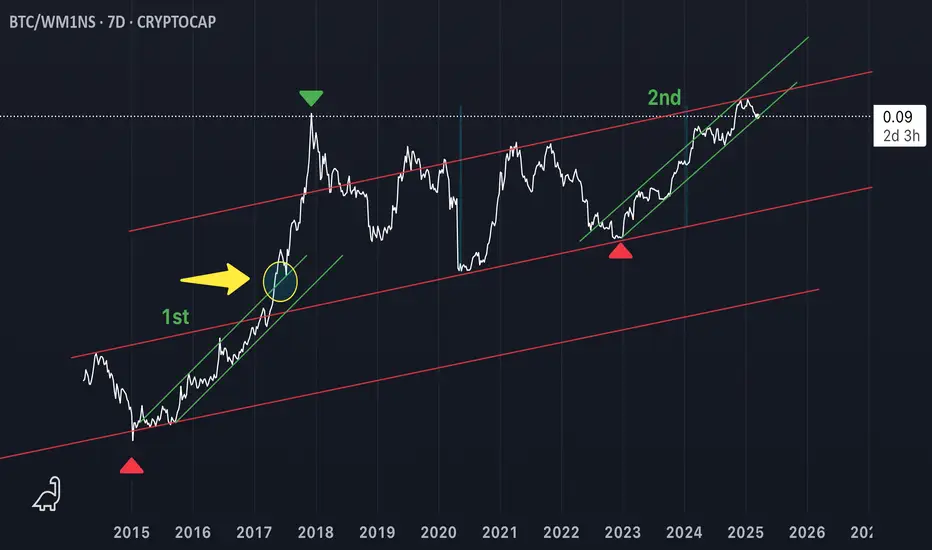
Bitcoin green channels are telling!Waiting for Bitcoin to breakout from the 2nd green channel and confirm meaningfully off of this channel top, higher at a steeper angle of attack! BTC/WM1NS 7 Day Chart

XAU/USD 17-21 March 2025 Weekly AnalysisWeekly Analysis:
Swing Structure -> Bullish.
Internal Structure -> Bullish.
In my analysis dated 27 October 2024 I mentioned (below) that price could potentially print higher in order to reposition CHoCH. This is exactly how price printed. CHoCH positioning has been brought significantly closer to current price action.
The remainder of my analysis and bias remains the same as analysis dated 09 February 2025.
Price has printed a further bullish iBOS.
Price is currently trading within an internal low and fractal high. CHoCH positioning is denoted with a blue dashed line.
Price Action Analysis:
In my analysis dated 27 October 2024, it was noted that the first sign of a pullback would be a bearish Change of Character (CHoCH), indicated by a blue dotted line. Price's consistent upward momentum had repositioned previous CHoCH much closer to recent price levels as expected for weeks. Current CHoCH positioning is quite a distance away from price, therefore, it would be viable if price continued bullish to reposition ChOCH.
Note:
It is highly unlikely price will "crash" as many analysts are predicting. My view is this is merely a corrective wave of the primary trend.
Given the Federal Reserve's dovish policy stance alongside heightened geopolitical risks, market volatility is likely to remain elevated, influencing intraday price swings.
Price could also be driven by President Trump's policies, geopolitical moves and economic decisions which are sparking uncertainty.
Weekly Chart:
Daily Analysis:
Swing -> Bullish.
Internal -> Bullish.
Price printed as per analysis dated 16 February 2025 by price targeting weak internal high priced at 2,956.310. However, The pullback was not substantial. Nonetheless, due to time spent I will classify this as an iBOS.
Price is now trading within an internal low and fractal high.
Expectation is for price to print bearish CHoCH to indicate, but not confirm bearish pullback phase initiation. CHoCH positioning is denoted with a blue dotted line.
Note:
With the Fed maintaining a dovish policy stance and the continued rise in geopolitical tensions, we should anticipate elevated market volatility, which may impact both intraday and longer-term price action.
Price could also be driven by President Trump's policies, geopolitical moves and economic decisions which are sparking uncertainty and the repricing of Gold.
Daily Chart:
H4 Analysis:
-> Swing: Bullish.
-> Internal: Bullish.
Previous analysis and bias was not met as price did not target weak internal low.
Price has printed a bullish iBOS followed by a bearish CHoCH.
Price is currently trading within an established internal range.
Intraday Expectation:
Price to either trade down to discount of 50% internal EQ, or Daily/H4 demand zone before targeting weak internal high priced at
Note:
With the Federal Reserve's dovish stance and persisting geopolitical uncertainties, heightened volatility in Gold is expected to continue. Traders should proceed with caution and adjust risk management strategies in this high-volatility environment.
Price could also be driven by President Trump's policies, geopolitical moves and economic decisions which are sparking uncertainty.
H4 Chart:

Gold Trading Positions and AnalysisFor gold trading, a position that can give good profit is to buy at 2955 with a stop at 2950, plan for a stop of 3000 and a final target of 3009 and from these areas look for opportunities to start a correction.
