Integrating Modified ElementEarlier identified angle that maps growth cycle.
It has a strong frame of reference because:
Building blocks are arranged into their Fib orbit.
Direction of Cycle of Highs and Lows match
To validate the angle we can extend to the left to confirm prices respected that angle.
We can see it interconnects entire previous fractal cycle confirming angles credibility and therefore can be further utilized for building predictive modeling.
Relating
⬇︎
Applied
Fractal
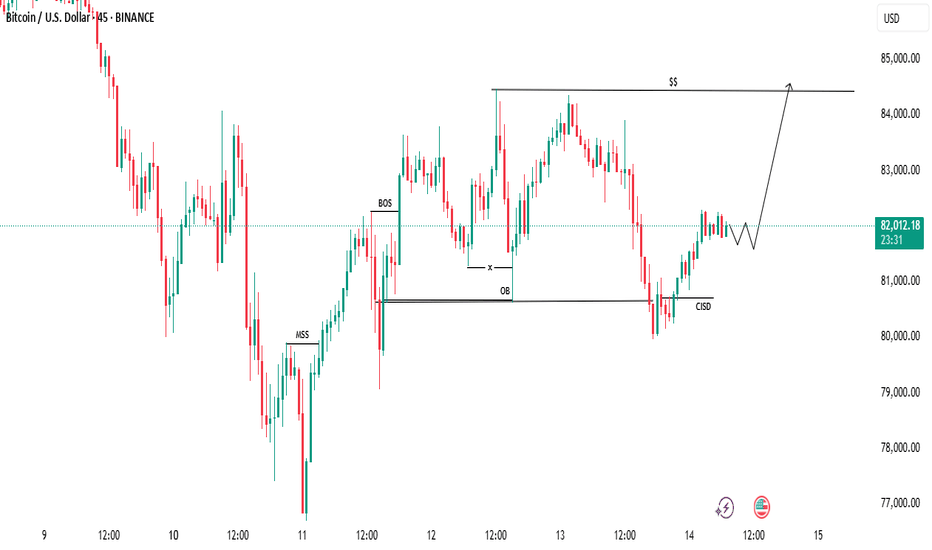
BTC Market Update: Upside Move ImminentBTC Market Update: Upside Move Imminent
Bitcoin has successfully grabbed downside liquidity, setting the stage for a potential upside move.
Key Insights:
- The market has formed a Confirmation of Inverse Strength Distribution (CISD), indicating a bullish reversal.
- The marked swing highs are being tested, and a breakout above these levels could confirm the uptrend.
- The target zone of $84,400 is now in sight, with the market poised to challenge this level.
Trading Hypothesis:
- A sustained move above the marked swing highs could propel BTC towards the $84,400 zone.
Ethereum Price Prediction
In this analysis, I present my personal forecast for Ethereum’s future price movement based on technical analysis. This is not financial advice, but rather my own perspective on the market. Always do your own research before making any trading decisions. INDEX:ETHUSD BINANCE:ETHUSDT OKX:ETHUSDT GATEIO:ETHUSDT
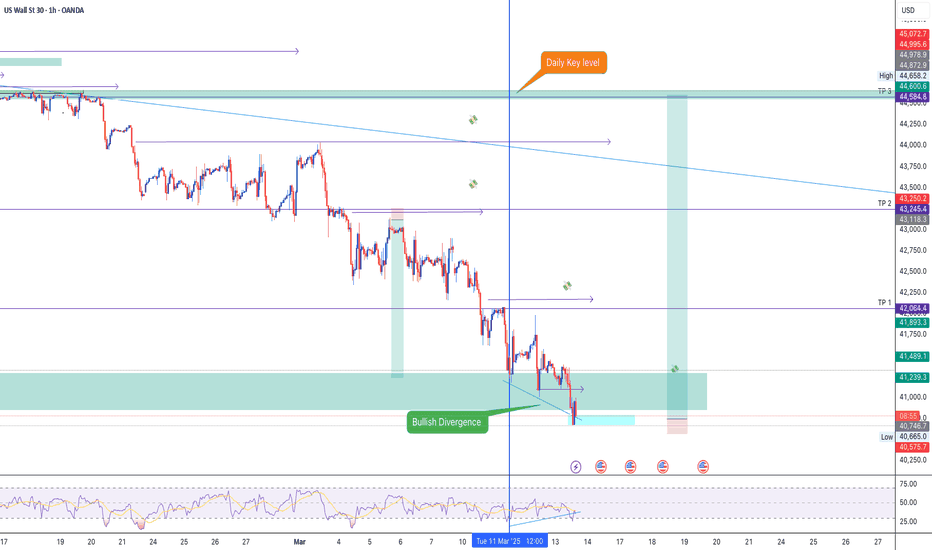
US30 BUYOANDA:US30USD
We entered our last US30 position early, but we got a 400-pip move in the process. This is still a key level on the daily. I'm entering from this zone when price begins to consolidate to show signs of support. Until then, use the alerts to notify you if price creates a lower low on the 2-hour time frame. Again, if this area builds support, there is a good chance that we will see a retest of the daily highs. We also have a bullish divergence printed on the chart as well. This rejection could be the start of the bull run to retest the key level on the daily time frame.
If price continues to fall, wait on a solid close beneath the lows then enter the sell on the rest of structure.
Short positions are in trouble, how to get out of trouble?Bros, gold accelerated to above 2980 today under the stimulation of news. If you hold a short position in gold, you must be in a trading dilemma, so how to get rid of the trading dilemma has become the current primary goal.
First remember the key node, Thursday. Under normal circumstances, Thursday and Friday are the nodes most likely to cause market changes! And from the candle chart, it is just pulled back to the high area with the stimulation of news. From the regional conversion, we can clearly see that according to the current momentum of gold, it will only reach the area around 2980-2982 (there may be a technical false breakthrough). It is difficult to rise to the vicinity of the 3000 mark in one fell swoop.
If you still have sufficient margin levels to help you get out of trouble, you might as well consider adding more positions near 2980 to continue shorting gold, effectively raising your average cost price. After gold falls back, you can choose to close all short positions and turn losses into profits. However, because gold has risen sharply, we must lower our expectations for the extent of gold's retracement. If gold retraces to the 2940-2930 area, we can consider closing our positions, so that we can turn losses into profits! And I predict that gold will enter a correction market tomorrow at the latest!
Trading means that everything has results and everything has feedback. I have been committed to market trading and trading strategy sharing, striving to improve the winning rate of trading and maximize profits. If you want to copy trading signals to make a profit, or master independent trading skills and thinking, you can follow the channel at the bottom of the article to copy trading strategies and signals
GBPJPY - MASSIVE Swing Potential Buy - Happening Now (March)This is a longer term swing idea.
Top down analysis from HTF indicates that:
- Push lower on JPYX Yen index
- Retrace higher on XXXJPY pairs
- Divergence in the Yen pairs, confirming a low
- Price Action has created a lot of liquidity on the downside, which has been taken, signifying upside.
Comment below if you have questions. Happy to help.
Peaceful Trading to you all.
BTC UPDATE!!!BTC Update: Rejection from Daily Bearish FVG
The current market has encountered a rejection from the daily Bearish Fair Value Gap (FVG), indicating a potential reversal in the upward momentum.
Key Insights:
- The rejection from the daily Bearish FVG suggests a shift in market sentiment.
- We anticipate a downward movement in BTC, targeting the $80,200 - $79,100 range.
Market Analysis:
The daily chart indicates a failed attempt to break above the FVG, leading to a potential bearish reversal. With this rejection, we expect sellers to regain control, driving the price towards the aforementioned support zone.
Trading Considerations:
- Short-term traders may consider positioning themselves for a potential downward move.
- Long-term investors should monitor the price action closely, adjusting their strategies as needed.
Stay informed and adapt to changing market conditions!
Bitcoin Full InterconnectednessIn fractal analysis the randomness of price levels can be justified with the chart's historic HL coordinates.
We'll use the old structure below as a base for further cycle breakdown.
There are another two fib lines derived from angled trends, the fibs of which rhyme with chaos behind price action and cycle formation:
Steep fibs determine timing of high volatility change:
Note that they rhymed with other fib local wave measurement:
2013 ATH ⇨ Covid19 low related to pre-covid local high determines exact levels of support and resistance during the correction of pandemic fueled bullrun
What also deserves attention here is that direction of fibs which acted as support around 2019 and covid19 drop produces curve which mimics the support levels of 2023 growth.
So crossing below the support curve would be seen as first sign of bear market. Till that it has a time for growth justified by chart-based parabolic curve.
2 fibs derived from chart shows a decade of price & time interconnectedness which adds validity of the colored base structure.
This is important for scaling the fractal and estimating the boundaries of growth distinctive to the historic cycles.
US30 BUYOANDA:US30USD
We caught a massive sell on US30. At this moment, price is retesting a Key-Level on the Daily time frame. The break beneath the 41,736.5 area seems to be a huge liquidity grab while also retesting this structural level. If price fails to break this zone, there is a big chance that we will see a retest of the highs over the month. We enter this trade at the lows, and we're already in profit. Let's see how it holds up.
FPI: Irony Behind The DeclineFibonacci interconnection between Higher Low, Higher High and series of Lower Highs and Lower Lows. The side of breakout from this narrowing formation will determine the direction of trend. The fibonacci lines derived from the structure covers the limits of breakout wave.
If the price resumes its downtrend, I can only assume the market is still digesting the impact of deteriorating fundamentals. When I first learned about the situation, I could hardly believe it. Essentially, the anti-immigration and protectionist policies Nebraska’s farm owners voter for, have triggered a labor exodus, as migrant workers in masses preemptively abandoned farms to avoid impending ICE crackdowns. This sudden labor shortage lowered rental income potential and more importantly affected land valuations — both of which are fundamental drivers of financial performance. At the same time, the fact that the farms depend on fertilizers 90% of which come from Canada - adds another layer of uncertainty amid ongoing trade tensions. This raises the risk of input cost spikes that could further erode profit margins. As operating costs rise and productivity declines, farmland becomes an increasingly unattractive asset class, prompting investors to reassess the value of agricultural holdings. The result is a broad collapse in prices — ironically driven by the very political and economic decisions that were believed to protect these rural businesses. If this isn’t something out of parallel universe, I don’t know what is.
The Daily Edge - 11th Mar 2025 Price breaks consolidation lows, but shorts remain on hold.
Market Context:
- Monday closed below the last three days of consolidation, signaling potential downside.
- No short entries taken yet as price hasn’t reached our POI at 2935-2940.
- Price retraced to 50 percent levels on both 4H and Daily, sitting in discount, not an ideal short zone.
- Major news events this week:
- CPI on Wednesday
- PPI on Thursday
- Expect deceptive price action leading into the releases.
Current Plan:
- Tracking a Market Maker Sell Model on 15M.
- Watching for a 3.5 - 4 range expansion from initial consolidation, aligning with our short POI at 2935-2940 (see attached TradingView chart).
- If price breaches 2930, we look for weakness at 2935-2940 for shorts.
- Short target is the previous daily low at 2830.
What’s Next:
- No trades until price reaches our POI. Avoiding trades in the middle of the range.
- Staying cautious of pre-news manipulation. CPI and PPI could trigger fake moves before a real breakout.
- Waiting for a clean setup. If structure shifts, we adapt.
Key Reflection:
How does waiting for price to trade into a high-probability zone improve execution and reduce unnecessary risk?
Trade with clarity and control. Hand-drawn charts keep you calm and focused. Join the PipsnPaper community today.
MSTR | Back to 120s / Double Digits | FractalPrice action blew off to a high around $540 and since then closed back under the historical close.
The goal here is to see price action consolidate under resistance in the preparation for a major sell-off
To invalidate all of this I would like to see more of an accumulation pattern back above major resistance, but if we see an increase in aggressive selling then price will be hunting for at least $120.
Price action also looked a bit familiar to the 2021 sell-off with the same blow-off-top and a ABC pattern breakdown
After the C sell-off price retraced back to B and then finally flushed out back to major support
Current price action has pretty much done the first phase and we should expect some consolidation before the next big move.
EURUSD - Next target: Last swing of the three-drive patternGiven the bullish order flow on the lower timeframe and the decreasing strength of bullish candles on the upper timeframe, we are likely to see another attempt to form the last swing of the three-drive pattern on the 4-hour timeframe.
The price is expected to move higher after the correction on the 15-minute timeframe to more penetrate the daily order block.


