S&P500: Reasons of DeclineThe S&P 500 has been experiencing a clear downtrend, characterized by a progression of lower highs and lower lows meaning that each attempt at a rebound is met with increased selling, preventing the market from establishing a meaningful recovery.
The current formation suggests that bearish sentiment is still dominant, with investors possibly looking for further downside support levels before a potential reversal. Until we see a shift in this downtrend structure, such as series a higher lows followed by a higher highs, the market is likely to remain under pressure. Another confirmation would be a breakout from line that connects ATH and 2 lower highs.
Main factors in play:
Geopolitical instability affecting investor confidence.
Tariffs and trade wars increasing costs for businesses and consumers.
Weakened global alliances leading to market uncertainty.
Rising economic risks impacting corporate earnings and economic growth expectations.
Protectionist policies can backfire
U.S. tariffs negatively impact the economy by increasing costs for businesses and consumers, disrupting trade relationships, and fueling economic uncertainty. Recent tariffs on imports from trading partners like Mexico and Canada raise prices on goods such as automobiles, energy, raw materials, and food, leading to inflationary pressures that hurt both companies and consumers. Businesses reliant on imported components face higher production costs, forcing them to either absorb the costs, reducing profitability, or pass them on to consumers, decreasing demand. Retaliatory tariffs from affected countries further compound the issue by making U.S. exports less competitive abroad, harming industries like agriculture, manufacturing, and technology. The threat of supply chain disruptions and escalating trade conflicts creates market volatility creating discouraging investment climate and prompting sell-offs in equities. Additionally, fears of a broader economic slowdown due to weakened global trade relations further erode investor confidence, contributing to stock market declines.
Impact of recent geopolitical shift
The S&P 500 likely fell in response to the geopolitical instability and uncertainty stemming from recent events. Investors tend to react negatively to signs of weakening U.S. leadership on the global stage, especially when it leads to disruptions in alliances and strategic partnerships that have historically provided economic and military stability. Seeing the U.S. aligning with autocracies while European and NATO allies are preparing for a future without American leadership introduces concerns about global security and long-term economic consequences. Furthermore, the perception that adversaries of free world may become more aggressive, potentially escalating conflicts, obviously adds to market anxieties. Investors fear that heightened geopolitical tensions could lead to disruptions in trade, energy markets, and global supply chains, all of which can negatively impact corporate earnings and economic growth. As a result, market participants likely sold off equities in favor of safer assets, leading to a decline in the S&P 500.
This demonstrates how political decisions can have far-reaching effects on financial markets and beyond.
Fractal

$SPX Fractal IdeaI've been watching this 2023 fractal play out very similarly since Summer '24.
It would mean a drop around 5,500 by late March/early April before continuation of the uptrend into late 2025.

GPBUSD ShortA sell at previous weeks high to fill some of the inside gap. Overall still in bullish mode but maybe needs to create efficiency to keep the run going.


$BTC Futures FractalTaking a closer look at BTC CME chart in late 2020, after a high of $14,000 Bitcoin Futures corrected and rallied back up (with a gap) to $12,000. After another 21% correction (almost closing the gap) we started to rally to all time high. Looking at the current chart today we have a very similar set up.
From a major correction, and then a rally (Gap up) we have closed the gap. If the timing is exactly the same... (unlikely).., well see another rally to new all time highs.
First target is still $130,000.

Bitcoin: Rejected HighBy referring historic price dynamics, I'll attempt to explain future possible swings and their limits structurally.
But first it would be nice to drop a few words on recent history.
As you remember price has broken below the triangle which caused the selloff establishing a bottom. The new Lower Low's can be referred through line that starts from triangle's low point. That line happens to be parallel to triangle's top side. Also we can see that recent uptrend locally stopped at line that covers lowest points of the triangle pattern.
The fact that a particular angle explains a considerable number of support and resistance points, justifies the use of fibonacci channel as one of the elements for future price anticipation.
The interconnected structure that you see in interactive chart factors in the coordinates newly established LL, the rejected LH and support levels of the broken triangle.

Potential short trading positionPersonally, I consider the marked area as a potential zone for a price reversal
Of course, considering the trend, it comes with risk

$BTC Closes Above WMA20 - Cue Trump Pump 2.0Last time CRYPTOCAP:BTC claimed the WMA20 signaled the US election Trump Pump.
BTC has once again closed above the WMA20.
Cue the Trump Pump 2.0 🚀
(please)

EUR/GBP: Locked in & Waiting for the Perfect FlipWe’re sitting pretty inside a refined 30M order block, but patience is key. The game plan is set—waiting on a clean CHoCH flip to confirm bullish intent.
What I Need to See:
✅ Inducement taken—weak hands swept.
✅ 30M OB mitigation—price needs to respect structure.
✅ 5M confirmation entry—once the market tips its hand, I strike.
No guessing, no forcing—just letting the market show its cards. If it all lines up, I’m catching this move with precision.
#Forex #EURGBP #SmartMoney #CHoCH #Inducements #PrecisionTrading
Bless Trading!

USD/JPY 30M - Let the Market Come to MePatience is the name of the game. Price has been making strong moves up, but I’m not chasing. I see the bigger play setting up.
✔️ Inducement marked – Liquidity sitting right above, waiting to get swept.
✔️ Demand Zone Locked In – 148.800-149.000 is where the real game begins.
✔️ Waiting for the Pullback – Let price dip, clear out weak hands, and show its hand before I step in.
No FOMO, no chasing—just precision. If it mitigates properly and confirms, I’ll be ready to strike. Stay sharp.
#Forex #USDJPY #SmartMoney #Inducements #TradeWithPatience
Bless Trading!

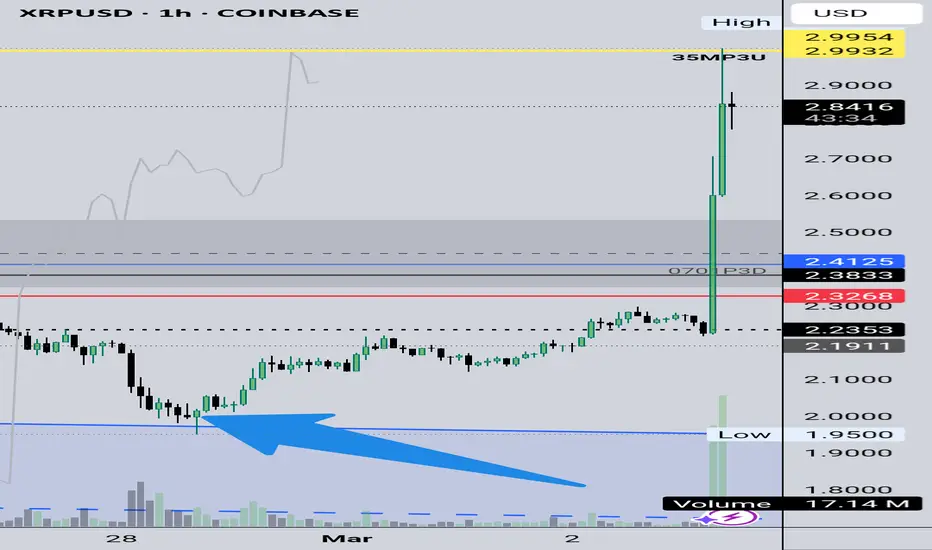
Xrp to the MOON? SeekingPips Long Buying XRPUSD ALL DAY!⭐️ Now today I have tons of messages asking me about XRP ⭐️
❗️Ladies and gentlemen 🟢SeekingPips🟢 has been long bias for the past 4 years at least and especially long XRPUSD All year on this platform with plenty of before the fact TRADE CALLS .🚀🚀🚀
✅️ Now you know I wanted another dip below the shaded area mentioned last week on Saturday 22 February.
(Go Back & See For Yourself)
✅️ We got what we wanted and even a momentary sub $2 XRP
I hope you were filled on your LIMIT ORDERS.
⚠️ My exact words were "Just for the records tho sub $2 I fill my pockets"
❓️NOW WHAT❔️
🌍It's VERY EASY , knowing that over 90% of so called TRADERS LOOSE MONEY in the markets and ALSO that they ENTER THE MARKET IN A RUSH WITHOUT MUCH OF A PLAN but they will sit in a LOOSING POSITION for far TOO LONG and EVEN CLOSE THEIR POSITION as soon as they have a SLIGHT PROFIT.🌍
ℹ️ Your job can be VERY SIMPLE.
With knowing the above all one has to do to CAPITALISE ON THIS INFORMATION is the EXACT OPPOSITE.
⚠️You DON'T HAVE TO BE A GENIUS to make MONEY in the market but you do have to HAVE A PLAN and ACT ON IT RELIGIOUSLY ⚠️
$Algo Has PotentialAlgorand has been a major laggard so far during this cycle, I believe this is due to the major interest in other tokens like SOL.
However, while investors and traders have been focusing on meme coin pump & dumps, the Algorand Community has been building. Focusing on Utility as a long term goal.
Transaction Speed
Algorand managed to handle 34,008 transactions in a single block in less than three seconds. This achievement is notable not only for its speed but also for its flawless execution, as it boasted a 100% success rate. This milestone highlights the blockchain’s robust capabilities, making it an attractive option for both developers and investors.
Algorand Staking
1. Pure Proof-of-Stake (PPoS) vs. Traditional Proof-of-Stake
Algorand uses a Pure Proof-of-Stake (PPoS) model, unlike Delegated PoS (DPoS) or Nominated PoS (NPoS) used by networks like Solana, Polkadot, and Cardano.
In Algorand’s system , every ALGO holder automatically participates in securing the network, while in other PoS systems, users must delegate to validators or run their own nodes.
2. No Slashing
Many PoS chains (Ethereum, Polkadot, Cosmos) slash a portion of a validator’s stake if they act maliciously or go offline.
Algorand does not have slashing, meaning users don’t risk losing their ALGO due to validator misbehavior.
3. Low Entry Barrier
On Algorand, anyone with ALGO can participate in consensus; there's no need for delegation or minimum staking requirements like on Ethereum (32 ETH) or Solana.
In contrast, other PoS chains require significant amounts of tokens to run a node or be selected as a validator.
4. Staking Rewards Have Changed
Algorand used to offer automatic staking rewards just by holding ALGO in a wallet, similar to Cardano’s model.
However, as of 2022, the automatic staking rewards were phased out, and instead, staking incentives now come through governance participation and DeFi protocols.
5. Governance Staking Model
Instead of passive staking, Algorand introduced governance staking, where users commit ALGO to governance for a fixed period and vote on protocol decisions.
This model is similar to lock-up staking on chains like Polkadot but focuses more on decentralized governance rather than securing the network.
6. Instant Finality & Faster Block Production
Algorand’s PPoS achieves instant finality (blocks are final once added) compared to Ethereum or Cosmos, which rely on probabilistic finality and can be reverted in rare cases.
This ensures faster transaction confirmation and higher security.
7. Staking via Liquid Staking & DeFi
Since traditional staking was removed, ALGO holders now stake through DeFi protocols like Folks Finance or AlgoFi (before its shutdown).
Liquid staking options allow users to stake while still using their ALGO in DeFi, similar to Ethereum’s Lido (stETH).
In conclusion, the future of $ALGORAND looks bright in the long-term. Although I do believe we do see ATH this cycle, It seems we are currently in last point of support of the wycoff accumulation cycle , only time will tell.
This is not financial advice, just an observation of a digital asset with long term potential.

DXY to Retest $108 - Slight Pain May Lay AheadDXY fractal from 2017 is playing out nicely.
Looks like it will retest $108 mid-March and break $106 in early April (hopefully before).
This lines up perfectly with the Global M2 (12-Week Lead) liquidity injection.

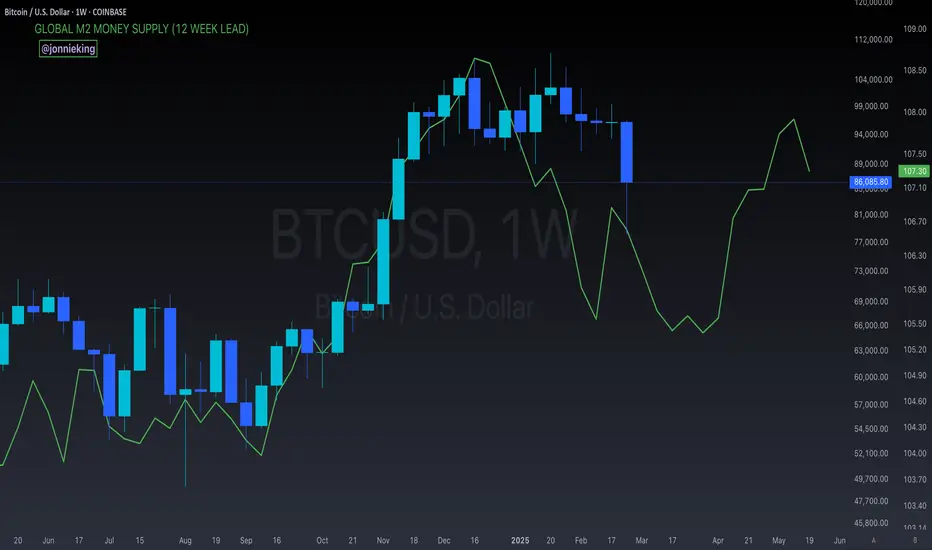
$BTC with Global M2 Money Supply (12-Week Lead)Shows a big liquidity injection coming in early April.
Might be a bit bumpy until then 🎢
BTC retrace of 30% beginning of 2025? Historical Data suggest that #BTC could retrace by about -30% down to the 75K mark before continuing its rally throughout 2025. I am keeping an eye out for the repetition of this pattern.

SPY FractalJust publishing this here to see if this SPY Fractal actually plays out.
Purely shits n giggles.

Tesla Approaches Key Support: What Comes Next?NASDAQ:TSLA is currently at an interesting moment on the daily chart. Until recently, the uptrend was well-defined, with strong projection legs and corrections within a healthy behavior. But now, we have a slightly different situation. The last upward leg was intense, but the current correction has already surpassed the 66% retracement level and is approaching a significant support zone that has held the price multiple times in the past.
What stands out at this moment is not just the existence of this support, but how the price reached it. There is a technical concept that suggests that the greater the speed and distance the price has traveled to reach a support, the more relevant that support tends to be. This happens because markets do not move indefinitely in a straight line. When a sharp and extended downward move occurs, sellers tend to lose momentum, and buyers may step in to try to hold the price.
On the other hand, this deep correction also highlights an important point: even if the support holds temporarily, a continuation of the uptrend does not seem to be the most likely scenario at this moment . With such an extended retracement following a strong upward move, it becomes difficult to imagine the price simply breaking the previous high and resuming a clear bullish structure. The more probable scenario is either a period of consolidation or even a transition into a reversal.
This does not mean that support cannot create short-term buying opportunities. It might, but in this case, trades within this period tend to be more challenging because if we are entering a consolidation phase, price movements could become more erratic and less predictable. A bullish leg within a consolidation is very different from a bullish leg within a strong trend – targets become shorter, price movements can lose fluidity, and predictability decreases.
So, regardless of what the market decides to do from here, what we can interpret so far is that the strength of the uptrend has faded, and NASDAQ:TSLA may be entering a more lateralized movement or even a transition into a downtrend. The support level might create a reaction, but it is unlikely to sustain a return to the uptrend without first going through a phase of rebalancing. The price will always dictate the next moves, and all we can do is interpret the signals it has left behind.

BE ALERT AUDJPY IN SUPPORT ZONE.Audjpy in support zone of Daily Timeframe if Any Daily Candle Give Us Confirm To Prices Go Up Market Will Go Their Rest Lequidity Areas To Hunt Or Fill The FVGs Of Sell Side.
Tip! Trading, like any high-performance endeavor, requires skill, focus, and discipline. Those who are in it for the money alone aren’t likely to focus on the process of being a good trader.

What Is Accumulation Manipulation Distribution - ICT Power Of 3 Accumulation Manipulation Distribution Helps Retail Traders To Follow The Moves Of "Smart Money" Large Financial Institutions.

BTC Trade✅ After testing POI 1W (FVG) & triggering FL 1D ($89,100), we got a 4H VC → Taking a LONG position targeting the nearest FVG 1D zone
📈 Plan:
Expecting liquidity pool formation & its raid as price delivers.
Watching for VC 1D buyer formation—if confirmed, targeting 1W TF levels.
⚠️ Risk Factor:
50% FVG 1W ($85,480) remains unfilled → Potential sweep before upside continuation.

ETH Analysis (SMC)After yesterday's breakdown, I think price can recover itself and fill imbalance gap that create. Also fibo can be good resistance zone for price, if price through fibo zone, waiting for CHoCH.

EURUSD ANALYSIS ENGULGING THEORY BASEDEurusd currently in mid 2 zone if market go upside we can see down fall our that first level or if market go down then we can see buy from these 2 levels that i mentioned in chart lets see what will happen.
Note ! dont trade without knowledge becouse your harder money market will not see and dont put your whole amount in trade takecare.

GOLD SELL market will be reversall sellGOLD SELL market will be reversall
Gold price edges lower during the Asian session on Tuesday and erodes a part of the overnight move up to a fresh all-time peak. A further USD recovery from its lowest level since December 10 prompts profit-taking around the XAU/USD amid slightly overbought conditions.
