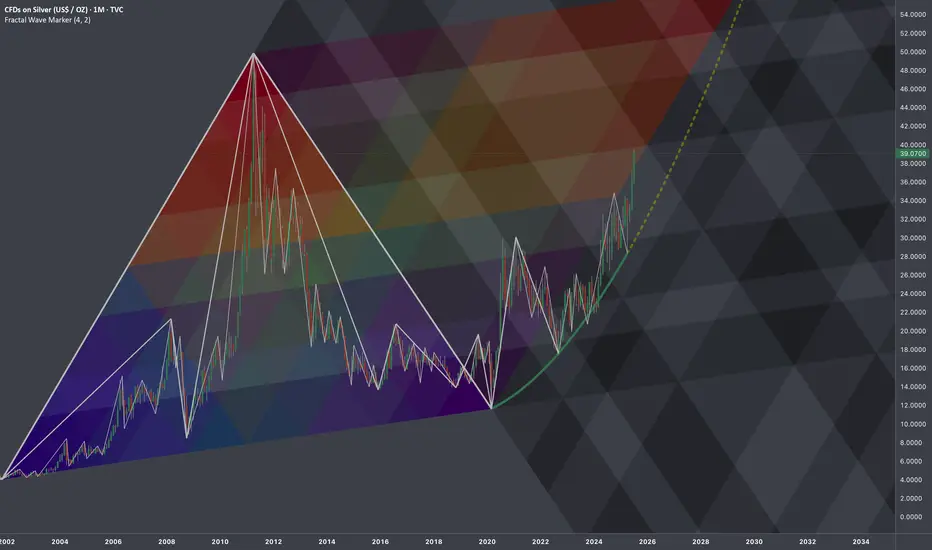
$SILVER: Fractal Geometry (Cycle 2001-2020)Research Notes
Working out probabilistic texture using multiple fibonacci channels on just 3 coordinates of fractal cycle (late 2001 - 2020) on linear scale (on log chart it would still be relevant, so you can switch to view with right click on price scale for selection).
To describe behavior of price and key levels on smaller scale starting from covid we'll use
L-H-L:
Using coordinates to express surface area of broken cycle with fibs mimicking rise, fall and side mapping cycle:
I'd look for patterns of bullish exhaustion only after price crosses the curve.
Fractal
After Breaking Downward Trend, GBPUSD Ready for Upward Rally!GBPUSD
N.B!
- GBPUSD price might not follow the drawn lines . Actual price movements may likely differ from the forecast.
- Let emotions and sentiments work for you
- ALWAYS Use Proper Risk Management In Your Trades
#audusd

$XAUUSD: Macro InterconnectionsResearch Notes
Linking historic surface area and coordinates of consistent geometric expressions to document and learn more about the "texture" of self-organizing processes. The topology assumes that current price is a result of all history together that took to make the price end up where it is.
The fastest shortcut to figure out fractal hierarchy of waves and general direction is through Fractal wave marker .
Since angle of highs cycle is broken and price stayed above it for long time. That means it would be better to strip the chart starting from the lower levels, in order to get better coordinates for structural basis.
FWM helps to spot that distinctive part of broken waves that enables visual orientation in the rhythm. They manifest in its closest formative across cycles.
The angle that links the pattern through the time can have deterministic property, therefore we can use that direction for fibonacci channels to fill the gaps.
The fact that on log scale the bits from bullish phase of cycles contracted on price scale, I'd orientate with thin fibonacci channels (that is based on angle of lows of macro-cycle applied to previous ATH.
There are some other interconnection that are being tested.

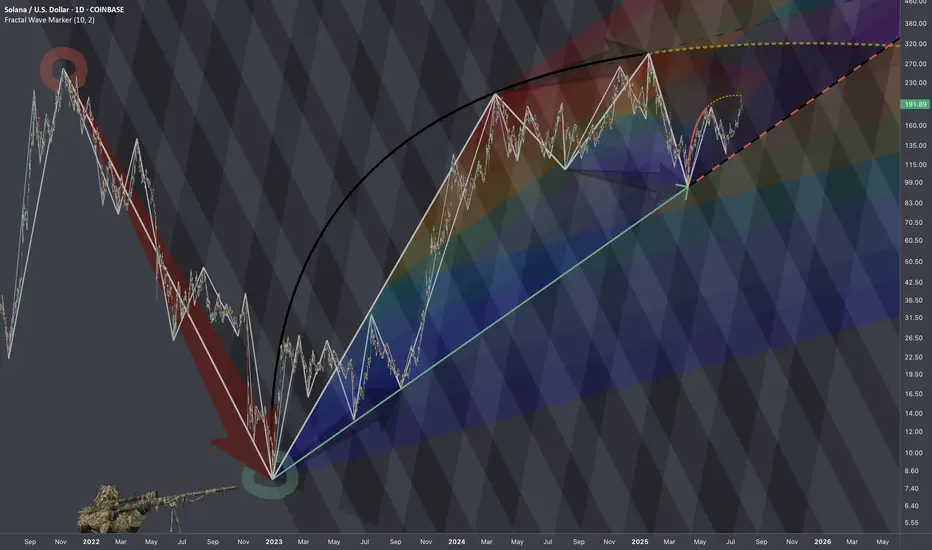
$SOLUSD: Scaling LawsResearch Notes
Progressions here are evident so I'll use the historic bits and organize them into structure that would determine the levels inside dark highlighted zone of the local scope.
If we scale back, it's hard to avoid the massive drop that structurally can serve as reference point.
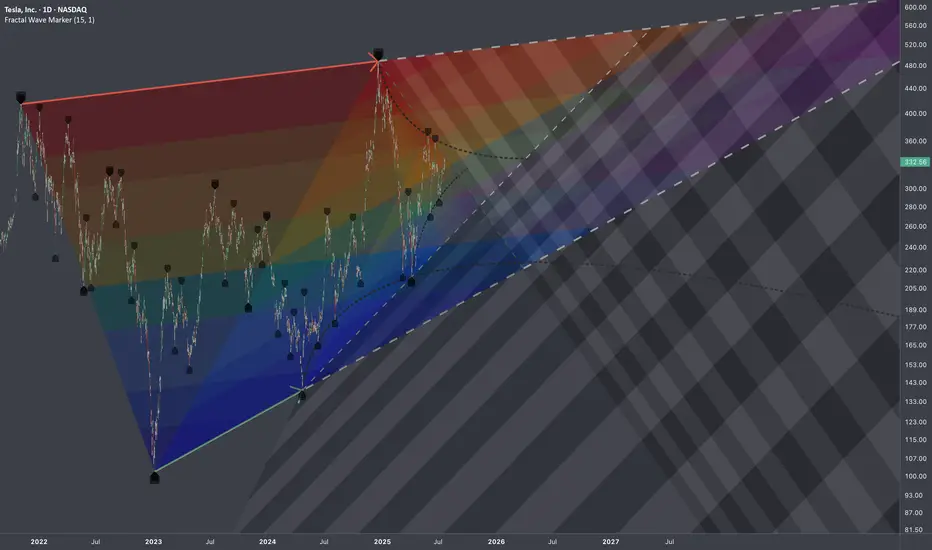
$TSLA: Multi-Scale DensityResearch Notes
Identified structural compressions happening within two periods:
This set has provided a perfect opportunity to study exponential fibs with growth rate starting from phi^1/4 applied to area of expression of squeeze.
Geometrically, gives a better sense of a continuity than regular fibs.
GBPUSD - Next buy from demandLooking here for potential further buying momentum to the upside.
Will see how this plays out tomorrow

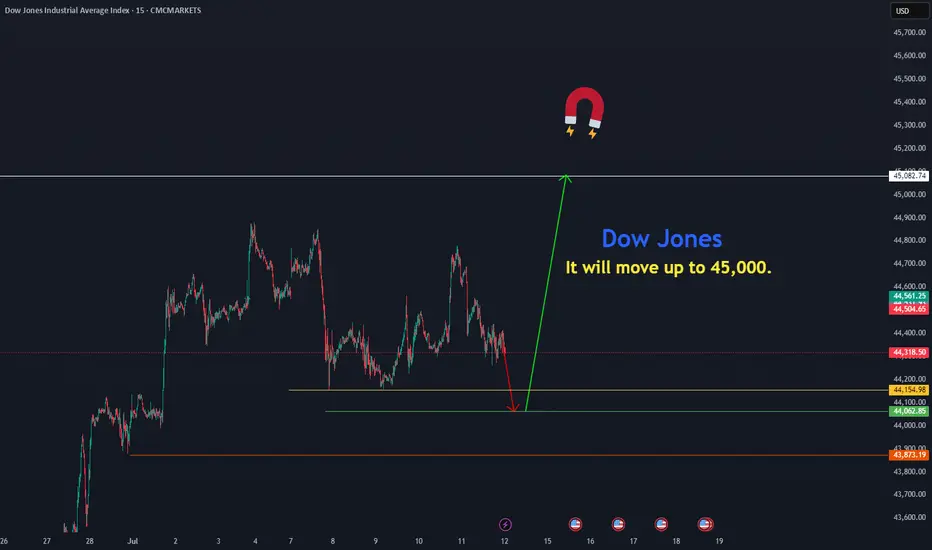
Dow Jones move upThe Dow Jones is resuming its rally toward 45,082 from the price zones of 44,154.97 and 44,000.
CMCMARKETS:US30
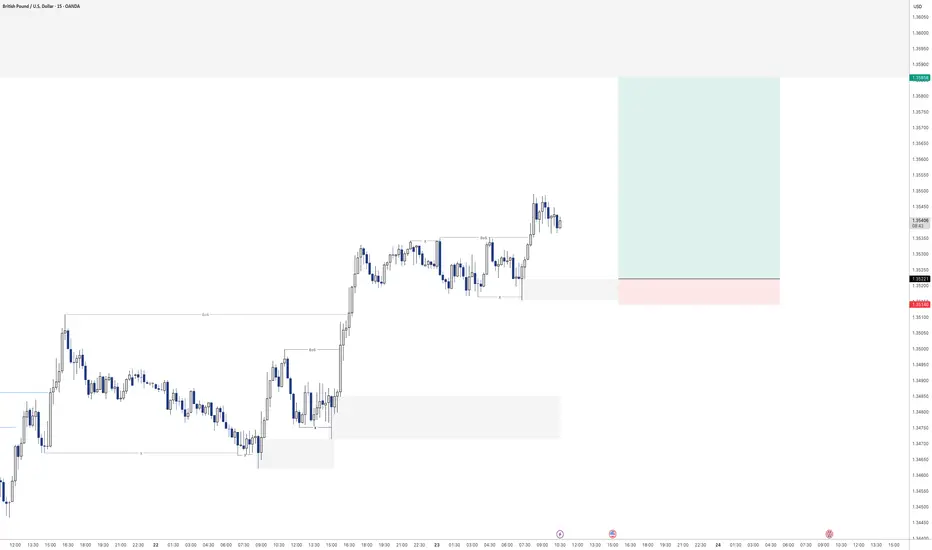
GBPUSD - Buying continuationLooking to keep buying the bullish orderflow on the 15min.
Had a nice sweep of liquidity before creating a new high. Will see how this one plays out over the day
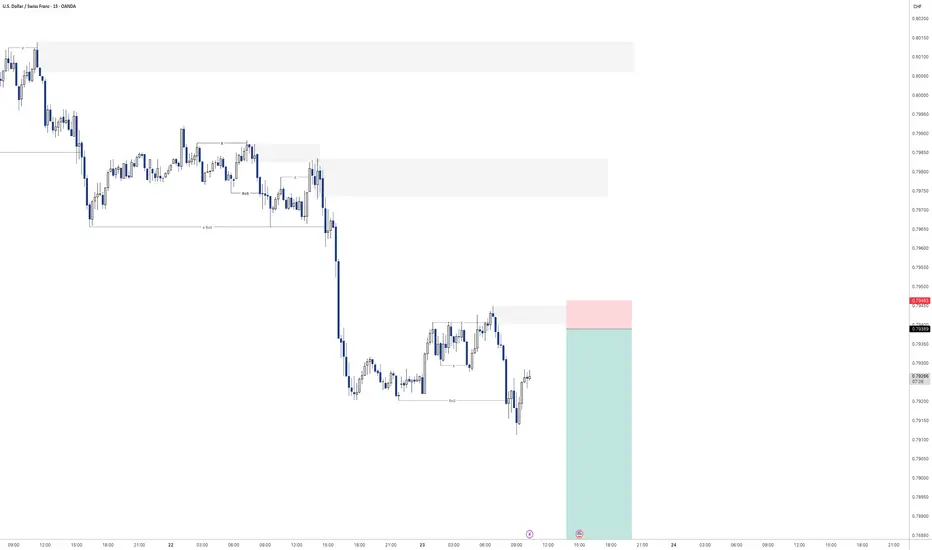
USDCHF - Sell off continuation?Looking for continuation of the selling pressure here on USDCHF
Will see how we play out for the rest of the day
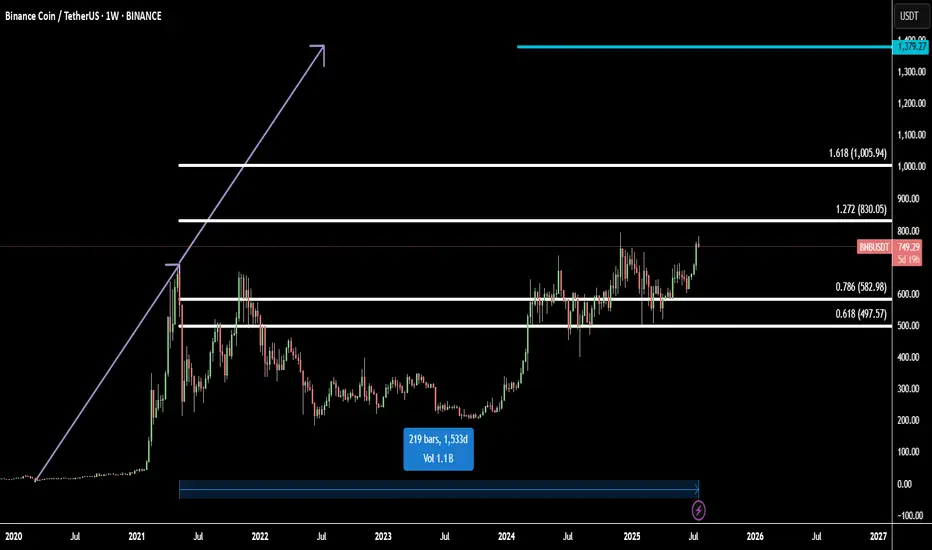
BNB Ready for All-Time High: Fibonacci + 1533-Day FlagBinance Coin (BNBUSD) is setting up for a major breakout, approaching its all-time high with strong momentum.
Technically, BNB has completed a 1533-day flag accumulation — a rare, long-term fractal consolidation that often precedes explosive moves. This massive base acts as a launchpad for the next bullish leg.
Using Fibonacci extensions, we identify two major upside targets:
Target 1: 1.272 Fib – 830.05 - the first resistance and profit zone
Target 2: 1.618 Fib – 1005.94 - key bullish extension from breakout range
Final Target: 1379.27
The final target is projected using fractal symmetry from previous bullish expansions, aligning with the broader market cycle and BNB’s historical price action.
This setup suggests a high-probability move toward new all-time highs and beyond, supported by strong technical structure and breakout energy.
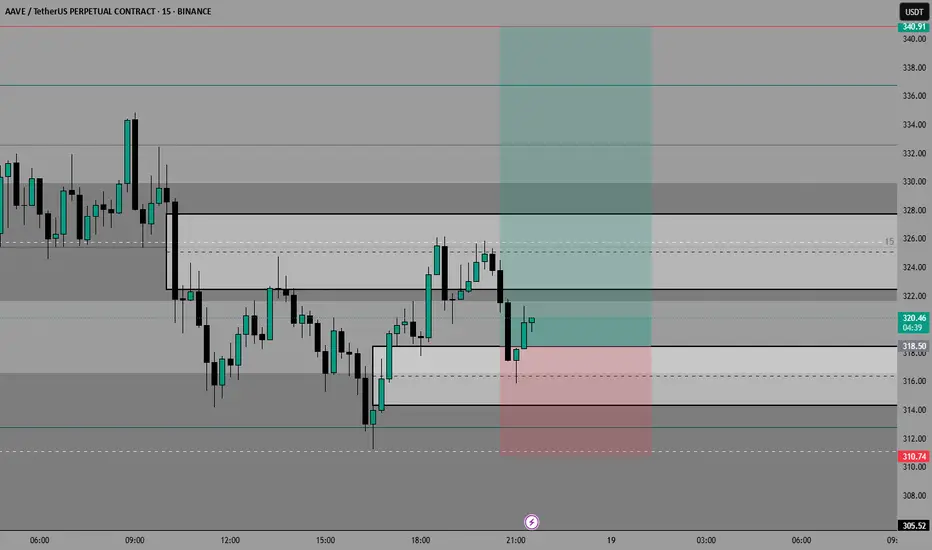
AAVE IDEA JUL/18/25Let’s try another one over the weekend.
We’re aiming for that LQ on the HTF, but we’ll catch some partials along the way
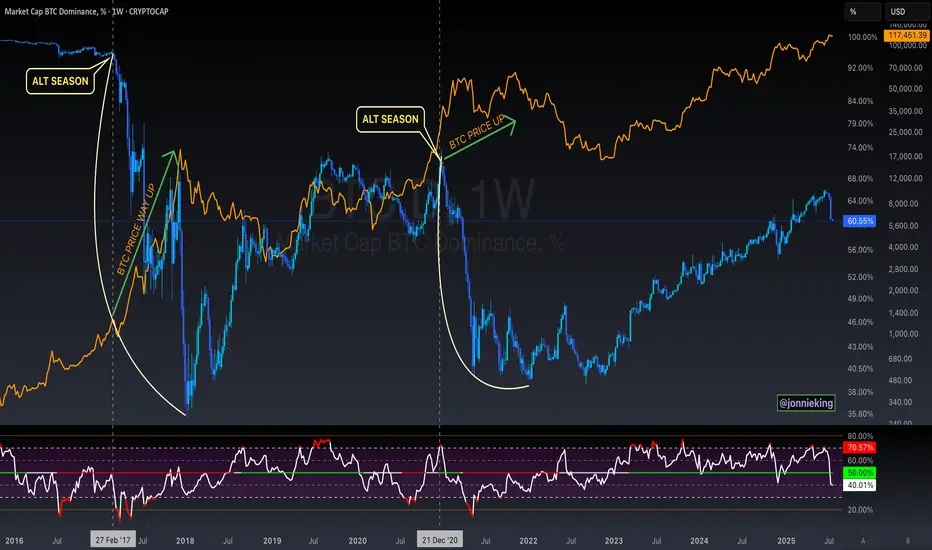
$BTC Will Go Up Alongside Alt SeasonSomeone posted on one of my tweets the following:
" Jonnie my bro, the only problem for me right now is that btc didnt top yet. You also talked how btc shoud top around 200k range. Alt season can only come when btc reach top"
MYTH DEBUNKED ✅
CRYPTOCAP:BTC does NOT need to top in order for Alt Season to commence.
Both can and will occur in tandem 🤝
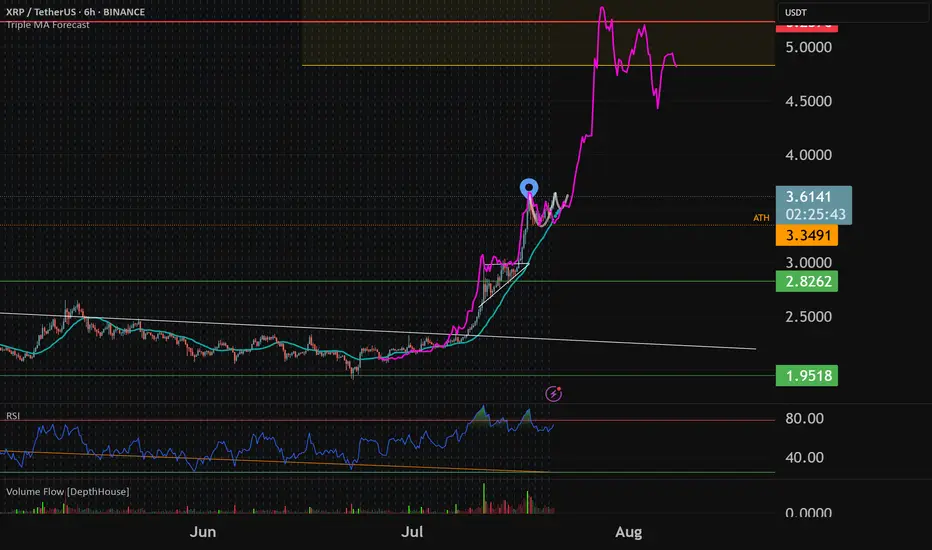
$XRPUSD: Limits of Expansion🏛️ Research Notes
Documenting interconnections where historic area and coordinates of formations are used to express geometry of ongoing cycle.
If we scale out the chart back starting from roughly 2016, we can see more pretext like how the price was wired before decisive breakout from triangle.
Integrating fib channel to the angle of growth phase of the previous super-cycle, so that frequency of reversals match structural narrative.

XRP To $5-$5.25Typical XRP breakout pattern. Expect cup and handle consolidation to keep forming this week before a quick move to $5 before th end of the month. From there i expect a broader market correction but final pt's around $6-7
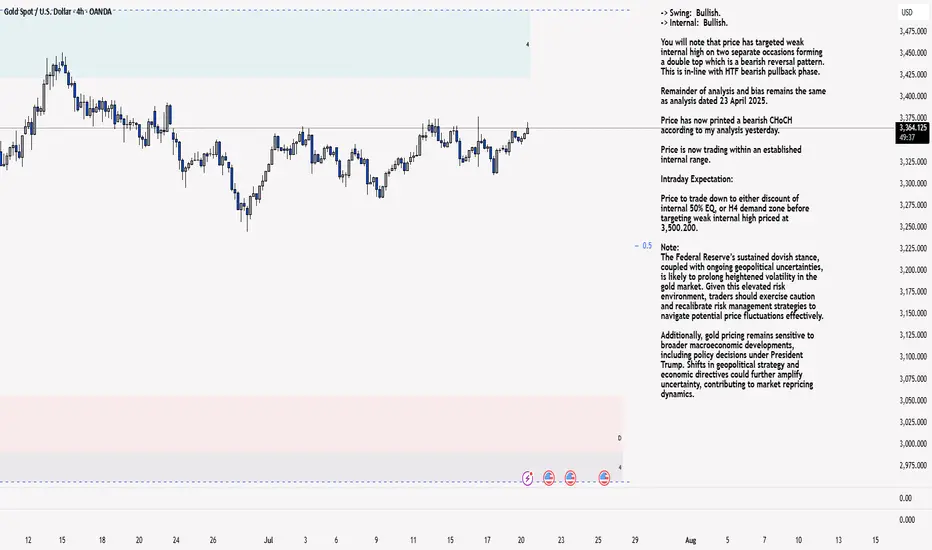
XAU/USD 21 July 2025 Intraday AnalysisH4 Analysis:
-> Swing: Bullish.
-> Internal: Bullish.
You will note that price has targeted weak internal high on two separate occasions forming a double top which is a bearish reversal pattern. This is in-line with HTF bearish pullback phase.
Remainder of analysis and bias remains the same as analysis dated 23 April 2025.
Price has now printed a bearish CHoCH according to my analysis yesterday.
Price is now trading within an established internal range.
Intraday Expectation:
Price to trade down to either discount of internal 50% EQ, or H4 demand zone before targeting weak internal high priced at 3,500.200.
Note:
The Federal Reserve’s sustained dovish stance, coupled with ongoing geopolitical uncertainties, is likely to prolong heightened volatility in the gold market. Given this elevated risk environment, traders should exercise caution and recalibrate risk management strategies to navigate potential price fluctuations effectively.
Additionally, gold pricing remains sensitive to broader macroeconomic developments, including policy decisions under President Trump. Shifts in geopolitical strategy and economic directives could further amplify uncertainty, contributing to market repricing dynamics.
H4 Chart:
M15 Analysis:
-> Swing: Bullish.
-> Internal: Bullish.
H4 Timeframe - Price has failed to target weak internal high, therefore, it would not be unrealistic if price printed a bearish iBOS.
The remainder of my analysis shall remain the same as analysis dated 13 June 2025, apart from target price.
As per my analysis dated 22 May 2025 whereby I mentioned price can be seen to be reacting at discount of 50% EQ on H4 timeframe, therefore, it is a viable alternative that price could potentially print a bullish iBOS on M15 timeframe despite internal structure being bearish.
Price has printed a bullish iBOS followed by a bearish CHoCH, which indicates, but does not confirm, bearish pullback phase initiation. I will however continue to monitor, with respect to depth of pullback.
Intraday Expectation:
Price to continue bearish, react at either M15 supply zone, or discount of 50% internal EQ before targeting weak internal high priced at 3,451.375.
Note:
Gold remains highly volatile amid the Federal Reserve's continued dovish stance, persistent and escalating geopolitical uncertainties. Traders should implement robust risk management strategies and remain vigilant, as price swings may become more pronounced in this elevated volatility environment.
Additionally, President Trump’s recent tariff announcements are expected to further amplify market turbulence, potentially triggering sharp price fluctuations and whipsaws.
M15 Chart:
ETHUSD: Multi-Scale LevelsResearch Notes
Price is getting close to connected tops (after which rejections happened).
If we scale out, there is larger narrative Giving vital points of reference.
The dynamics look like part of various progressions at the same time. For example, to answer why price grew from sub-2k levels in the first place, I would pay attention to how it had been falling. Even if price breaks above white line, the ongoings cycle still inherits the prolonged timing.
Interconnection of levels with structural significance:
⬩At smaller scale, fibonacci channel adjusted to the angle of the first small cycle
⬩Scaling out the structure from previous cycle to relate to the levels of local scope.
⬩The final frame of reference covers the case where price expands breaking domestic range.

ALtseason-2025: where to exit?I have 2 metrics when I'm going to exit the market (with my profit):
1. When BTC.D falls to 40%;
2. When (Total3-USDT)/BTC = 1, in other words, when the amount of money in the altcoins is almost equal to the amount of money in Bitcoin and Ethereum.
When you see it happen, sell everything and exit the crypto market.

APA!? Always Plan Ahead! Are you ready!?Which number will play? 🤔
Swift price action makes the chart light up. It grabs your attention, makes it feel like something big is happening. And often it is. But sometimes, those sharp moves stall out just as quickly as they started.
That’s why we Always Plan Ahead.
Some alts gave us a clean #ElliottWave anchor. Structurally, it looks like a potential wave 3. Strong momentum, hitting projection zones, and solid separation from prior corrections at the smaller degree. Exactly what you want to see.
But fast doesn’t always mean forward.
Without a proper follow-through or a complete structure, one wave doesn’t tell the whole story. That’s why it’s key to wait for the next pieces to print. A wave 3 might be in play, but we still need confirmation—whether it unfolds into a 5-wave impulse, stalls into a correction, or pivots entirely.
The chart shows a few possibilities.
1 A swift move that didn’t lead to continuation.
2 A Zig Zag that completing.
3 A better-looking impulse with space between the corrective moves.
4 An impulse that completes but sets us up for a 2nd entry
The question now:
Which number will play? … or something else entirely?
That’s where planning comes in. You don’t need to know the outcome to be ready for it.
Stay sharp. Stay patient. And most of all—
Always Plan Ahead.


TOTAL3 exc BTCÐTOTAL3 is at the all-time high again and pushing to break that.
according to previous cycles the 1.414% of Fibonacci retracement at $1.98T is the top & timing of before the end of November 2025

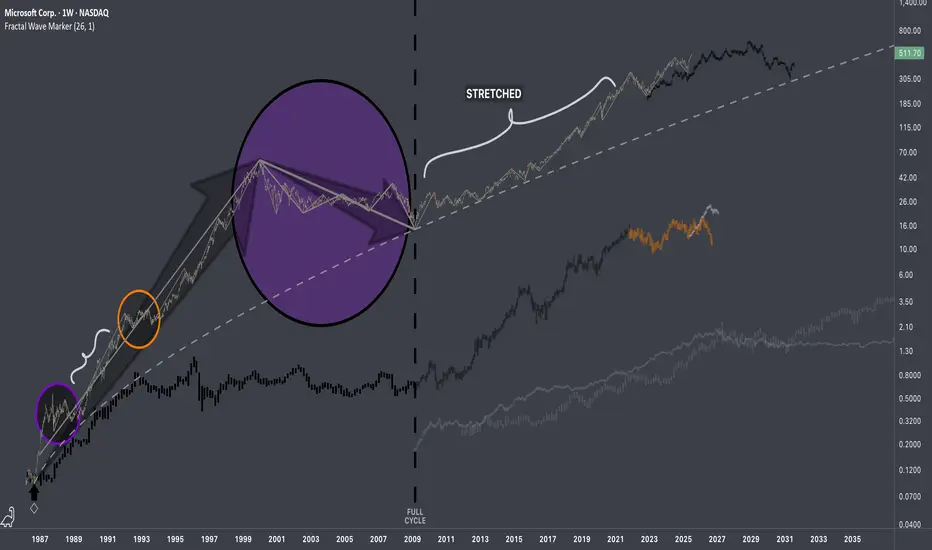
$MSFT: Fractal Hierarchy IResearch Notes
Fluctuations reappearing at broader scale.
If both are manifestations of the same pattern, then the next segments can be applied accordingly.
The remaining part can be deformed (depending on future volatility which can accelerate completion of composite sub-cycles)
Documenting it publicly to keep record of these particular recurring patterns.
AUDJPY - POTENTIAL?USDJPY is getting super interesting.
If we can get some bearish intent to try and induce the early sellers to the downside creating some buyside liquidity then i will be all over this for a trade.
Lets see how price has moved by the morning as it does need a bit more development before we can consider entering for a short position
