BTC consolidating, printed fresh bearish OB- on Daily candlesI believe this new bearish order block means we should be looking for sellside targeting. Until we get a bullish daily orderblock, now we should be bearish on entries.
Fractal

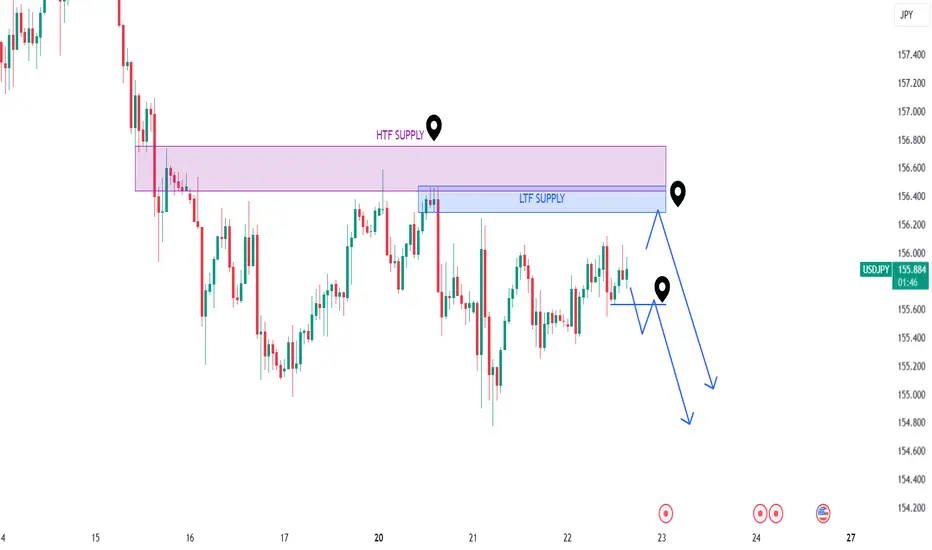
USDJPY Shorts Based on Current Re-DistributionBy combining Wyckoff and SMC principles we have a clear guide on what to expect, and what to do when it happens.
Patience is the name of the game, so set your alerts and hang tight until then.
- Option 2 could turn into a short term swing trade (until we reach daily demand levels)
BTC | Developing Distribution Pattern | FractalsWe're looking at a disjointed channel dating back from 2019 capturing all the last two cycle tops and bottoms without having to use the log scale
This distribution pattern caught my eye as it seemed very similar to the fractal top in 2021 and of course we can spot partial fractals of distribution all over the chart like the ones I circled in yellow
As we trade in this top like area we have to remember BTC is a Risk-On asset and is sensitive to economic data
Lets take a look at altcoins CRYPTOCAP:TOTAL3 at the bottom, we can notice that every time there was a developing continuation pattern, perhaps a bullish flag in this scenario, BTCs price slows down with CRYPTOCAP:BTC.D looking weaker within the 60 - 65% zone
Seeing this I dont think we'll see a 70% dominance with alts looking to rise from the dead and to shoot for for the moon🌝
🎯My relevant post shows targets of $115k BTC from the falling wedge breakout also in confluence with a fib extension eyeing at the same level as the flag pole target, 100%
We can also overshoot to around $120k
One more thing when we line up TOTAL3s bullish patterns with BTCs price you'll notice BTC starts to underperform and while ALTs look to over perform
We all know what happens after ALTs hit the moon and BITSTAMP:BTCUSD may be telling us something is coming soon.
Stay tuned for more BTC updates and lets get through this together🚀

EURJPY - Reaction off HTF H4 SnD area - M5 entryCounter trend scalp idea
Watch out for volatility with imminent news


Is it time for DOGE to AGGRESSIVELY FLIP Bitcoin in dominance?Rules are made to be broken, so take this fractal with a huge dash of salt.
But it's right there, like clockwork.
Have thoughts?
Don't shoot the messenger please.

ETH LongStrong level to long, else you can see on the chart 1D inefficiency tested, fvg from Monday 13 jan holding well, built an order block recently at the same level that holds well
The force did not cause lower breakout, tested well 1h inefficiency from where I grabbed the position, picture looks very familiar to what we have seen in the past on ETH
Typical AMD model logic aiming for breakout higher, probably closing earlier though

AUDUSD Wait for the price leave the consolidation zone.
If it comes out in Long, wait for the retest in the support and look to enter in Long.
If it goes short, wait for the Retest at resistance and look to go short.

GBPUSD Technical Analysis and OutlookPrevious Observations:
Long-term Downtrend: Confirmed downtrend from mid-2021.
Major Support Breach: Below 1.2000 in late 2022.
Recent Recovery Attempt: Above 1.2400, buying pressure still evident.
Key Resistance Zones (1h): Current level @ 1.2450
Key Resistance Zones (4h): 1.2500-1.2600.
Key Support Zones (Weekly): 1.2000 and 1.1800 - There's room to keep pushing lower.
Potential Buying Climax (Daily, 4h, 1h): Steepness of recent rise hints at possible pullback.
Additional Bearish Confirmations for Potential Shorts :
- Price tested and bounced off the 200 EMA several times in Dec 2024 (4h).
- The pair is currently hovering around the 50% retracement level of the recent short-term decline, a common area for price reversals.
- Bearish divergence confirmations have already presented this week on the hourly time frame. This is a tell-tale sign of institutional orders being filled at specific levels and generation of further supply. (This may be the conclusion of a 'PHASE C' in a redistribution cycle).
- The dollar shows no signs of weakening against the GBP both in technicals as well as fundamentals (Recent data shows the U.S. economy added 256,000 jobs in December, surpassing forecasts and reinforcing a strong dollar narrative).
Conclusions:
Considering that we see a trendline breakout followed by strong bearish reactions which are ideally happening at HTF supply levels, we can assume that the fractal nature of the markets will play out accordingly. We should not ignore the fact that price has reacted from LTF demand or that we saw a recent bullish imbalance filled- entering shorts off the current supply level should only be done with sufficient confirmations (we may have to look at how the London session open influences price action).
Disclaimer:
This analysis is for informational purposes only and should not be considered financial advice. Trading involves significant risk, and it's essential to conduct your own thorough research and analysis before making any investment decisions. Past performance is not indicative of future results. Always use appropriate risk management techniques and trade responsibly.

EURUSD is possible to drop soon!Hey guys,
based on the chart, I've identified a resistance area (in 4H timeframe).
And we can see the rejection of price from the mentioned area.
Also as confirmation for our scenario is the descending channel that is identified on the chart.
So It ca be another good trading opportunity with risk/reward ratio around 1/4 which is considerable!
Good luck.

WILL BULLISH ORDER CANDLE ABLE TO REVERSE AUDUSD?AUDUSD pair now hovering over the bullish order candle. Will this be sufficient for the pair's bullish reversal to test its recent swing high? Goto LTF to establish bullish market structure; else, pair may still go further down.
N.B!
- AUDUSD price might not follow the drawn lines . Actual price movements may likely differ from the forecast.
- Let emotions and sentiments work for you
- ALWAYS Use Proper Risk Management In Your Trades
#audusd

Read The EURUSD MarketLet's Read The Market of EURUSD and Follow our Analysis with see accurate previous predictions have been, Good Luck With Your Trades <3

nasdaq futures next week idea nasdaq futures next week idea trade from bearish breaker on H1 time frame.

BTC is poised...The momentum and price actions is looking very similar to what happened about 2 weeks ago. I've placed the fractal from it and if it plays out close to the same we will have one more quick visit below 100k only to then BLAST OFF and hit close to 120k by the end of January..
Only time will tell!
NFA! God Speed!

LINK Fractal | ALTS | Chainlink can EASILY +90%Chainlink is one of those alts that haven't yet made a new ATH with the rest of larger alt market group.
This means that the bullish cycle is taking a detour and it could be extended to another multi-month cycle, as I've previously stated in my BTC updates.
If LINK follows the previous pattern of a multi-month extended patter, we could see a fractal playout that takes us beyond the current ATH over the next few months.
_________________________
BINANCE:LINKUSDT

ADA Cardano Only Your Opinion Counts! ADAUSD No Trigger No TradePlease read the chart annotations for 🟢SeekingPips🟢 insight.
As mentioned on the above chart “Two Traders Can Have The Same Bias But One Will Make Money But The Other One Looses. WHY?
✅Note this ONE IS GOLD…
Write it down. Print It and even stick it to your forehead if you must…
THE BIG SECRET IS TIME. 👌
You know by now already that for 🟢SeekingPips🟢 TIME IS MORE IMPORTANT THAN PRICE.
🕒 TIME 🕕 is the ONE & ONLY THING THAT WE CAN FORECAST WITH 100% ACCURACY.
💡Let That Sink In…
I will TRY & GO INTO DEPTH on this subject over time on this 🟢SeekingPips🟢 Chanel

AIN trade scenario no fundamentals taken into consideration, simply fractal nature of the market and liquidity.

AACG trading scenariono fundamentals were taken into consideration, simply fractal nature of the market and liquidity.

Bitcoin Dominance Update: Alt-Season around the corner!Bitcoin dominance is still in an obvious uptrend and in my opinion we can have a potential scenario as illustrated on the chart which the dominance will have a spike up to %68 as Bitcoin records new all-time highs and the alt-season that we all are waiting for will start right after hitting this level around Mid-February.
This analysis will be invalidated if the dominance closes below %56 before making new high above %60

SAFEMOON - Not so safe for the medium termIt looks as though there could be a fractal for SAFEMOON. Historiclally, we've seen rises like this but only to be dissapointed and for the trend to be reversed again. I've drawn out a blue line of what the most likely trajectory will occur. The only other alternative is that the upward trend will continue, buying action will surge and we will see a bursting through of the upper trend line and escape the channel. If it comes back within the channel momentarily, that's fine - but not if the volume dies down and we stay within. So, it doesn't look great for an investment and I wont be putting anyting into it. Follow for more.

EGLD (MultiverseX) - AltSeason Cycle - Bull RunBINANCE:EGLDUSD (#MultiverseX) is ready to jump.
That's because the #AltSeason shall push #AltCoins to the limits.
Its Market Cap ( CRYPTOCAP:EGLD ) is very low now and about to grow significantly.
This will be the result of #Crypto #MarketCap ( CRYPTOCAP:TOTAL3 & CRYPTOCAP:OTHERS ) breaking through their #ATH.
With #BitcoinDominance ( CRYPTOCAP:BTC.D ) showing signs of #Correction, #eGold should prevail.
What Happened with BINANCE:EGLDUSDT ?
#EGLD managed to spike a bit in the end of '23, thus confirming the start of a larger #Bullish #Cycle.
#Correction is also complete (Q4 in '24), which leaves room for the Bull.
What's next for BINANCE:EGLDUSD ?
An Impressive Rise is expected for $EGLD.
The current levels are to be watched closely by #Traders going #Long.
#MultiverseX #TechnicalAnalysis
- #ElliottWave A-B-C Sequence: Confirmed
- Intermediate (A) & (B) (white): Complete
- #Bullish #Fractal: Commenced
- #Fibonacci Levels: Conditions Met
My BINANCE:EGLDUSDT #Long Levels
#HODL #Trade:
- Entry @ 31.00 USD (or below)
- TP @ 420.00 USD
#Futures #Trading:
- Entry @ 31.00 USD (or below)
- SL @ 10.00 USD
- TP @ 225.00 USD

BTC: Will it repeatBased on this simplistic analysis, post halving we appear to following a similar fractal. Will it start its next leg up in the next week or two??
Thoughts?

Dollar Index for Next 2 yearsThe Dollar Index (DXY) has been a critical gauge of the U.S. dollar's strength, and its movements are closely monitored by traders worldwide. Based on my analysis, I believe the next two years will bring significant challenges for the dollar, potentially leading to a heavy decline.
In my view, the DXY will struggle to hold above 120, even in the case of temporary fake breakouts or sharp rejections. This level represents a strong historical resistance zone, and any attempt to break higher is likely to face immense selling pressure. However, what’s more concerning is the potential for a deep bearish trend, with the index dropping below 95 during this period.
Several factors could contribute to this scenario. A pivot by the Federal Reserve toward more accommodative policies, slowing U.S. economic growth, and the growing global efforts to reduce reliance on the U.S. dollar in international trade could all weigh heavily on the index. Technically, the long-term charts indicate that the dollar is already facing structural resistance, and a break below key support levels could accelerate the decline.
If the DXY does drop below 95, it could trigger ripple effects across global markets, impacting currencies, commodities, and equities alike. This level represents a critical threshold that could reshape market sentiment and trading strategies.
Disclaimer:
This analysis reflects my personal opinion and is not financial advice. The markets are highly volatile, and unexpected macroeconomic or geopolitical developments could drastically alter this outlook. Always conduct your own research and manage risk carefully when trading.
Let me know your thoughts in the comments—do you see the Dollar Index heading for a crash, or do you have a different outlook? Let's discuss!
#DXY #Forex #DollarIndex #TechnicalAnalysis #TradingView
