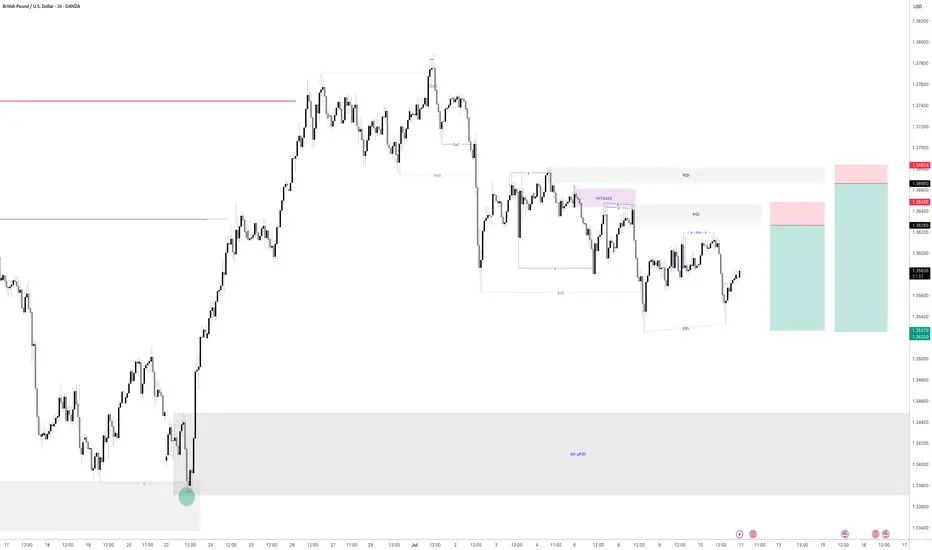
GBPUSD - Is it Ready? Looking at GBPUSD
We have had a Market shift to the upside from a HTF Point of Interest. I am now waiting for price to come back into a 15min demand area and hopefully price will take off to the upside from here.
We have also swept liquidity before a drastic move to the upside.
Lets see how this one plays out
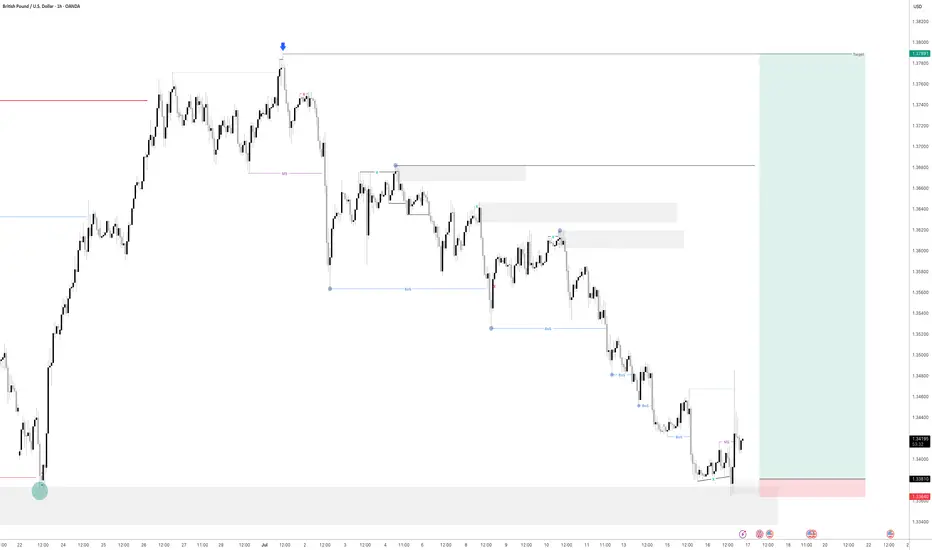
Fractal
Ethereum's Road to $7500 – Strategic Entries & Profit Optimizati🔵 Entry Zone: My first position is placed at $2225.5, aligning with a strong support level, while a secondary entry at $1857.5 serves as an additional safeguard against unexpected market swings—lowering my average purchase price and protecting capital.
💰 Profit-Taking Strategy: For low-risk traders, securing a 40% profit from the first entry is a prudent move to lock in gains early. However, my long-term target remains ambitious.
🚀 Main Target: Based on valuation models and fundamental news, Ethereum’s upside potential points toward $7500. However, I personally plan to secure 90% of my holdings at $6000, ensuring strong profit realization while leaving room for further upside.
This setup balances risk management, smart positioning, and strategic profit optimization. Let’s see how ETH’s trajectory unfolds!
Entry1: 2225.5
Entry 2: 1857.5
If your second entry is successful, you are required to withdraw 50 to 70 percent of your capital to maintain your capital. I will definitely update this setup.

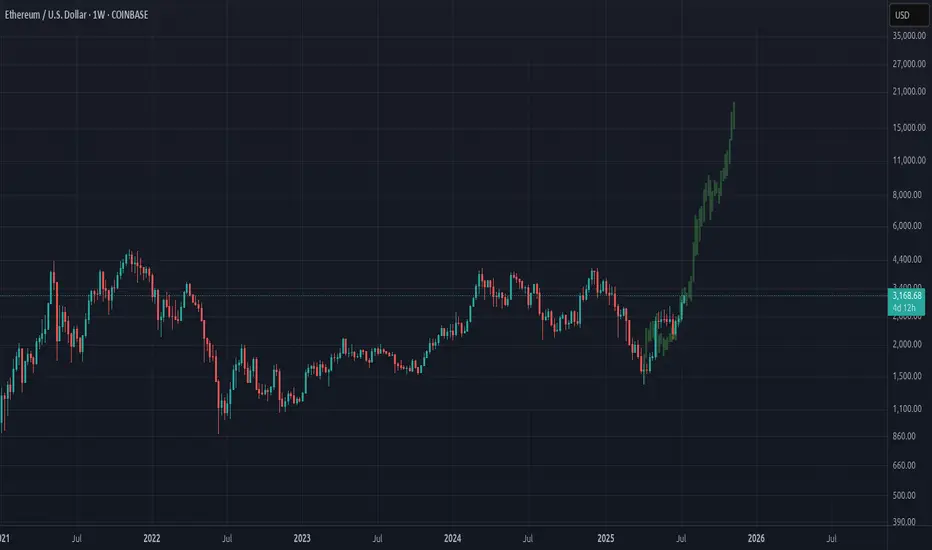
Ethereum LFGFractal from beginning of last cycles bull market. Estimated target $20K by November/December 2025. Significant pull-back around physiological level of $10K in autumn.
USDJPY - Time to sell short term i believeHave a pending order waiting to be triggered on UJ
Will see how we go if we get tagged in

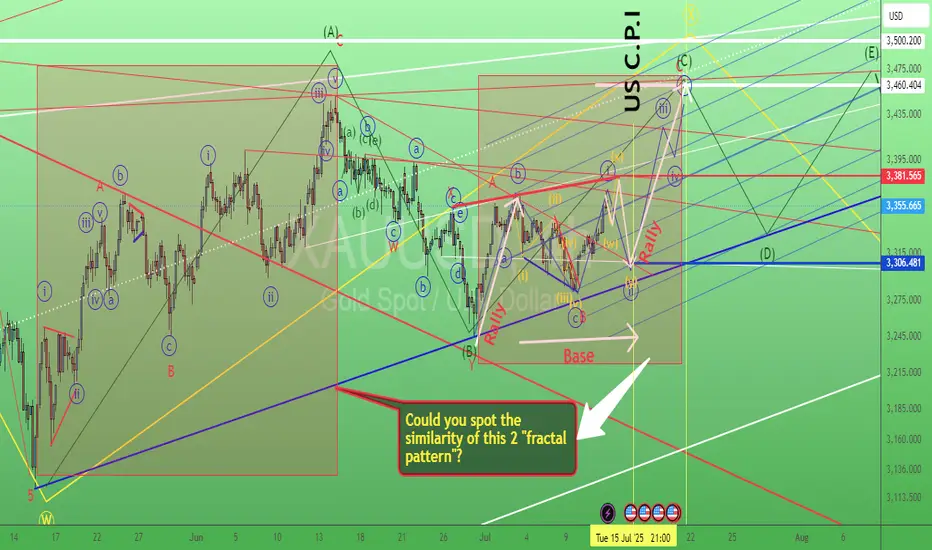
Gold swing trade setup 13/July/25XAUUSD. Based on the latest "speed" development of chart instead of forming a triangle pattern gold probably building a "flat" "Base" before rallying toward 3460 +/- Coming Tuesday US CPI could be the "trigger" for launching the rocket..
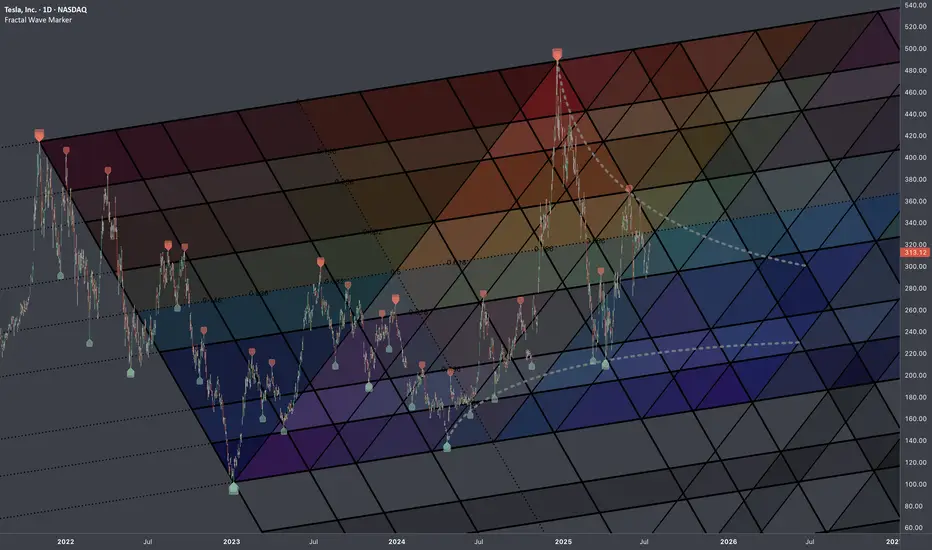
$TSLA: Fib InterconnectionsResearch Notes
Examining interconnection type with regressive angle:
Critical points:
Mapping with 3 fibonacci channels:
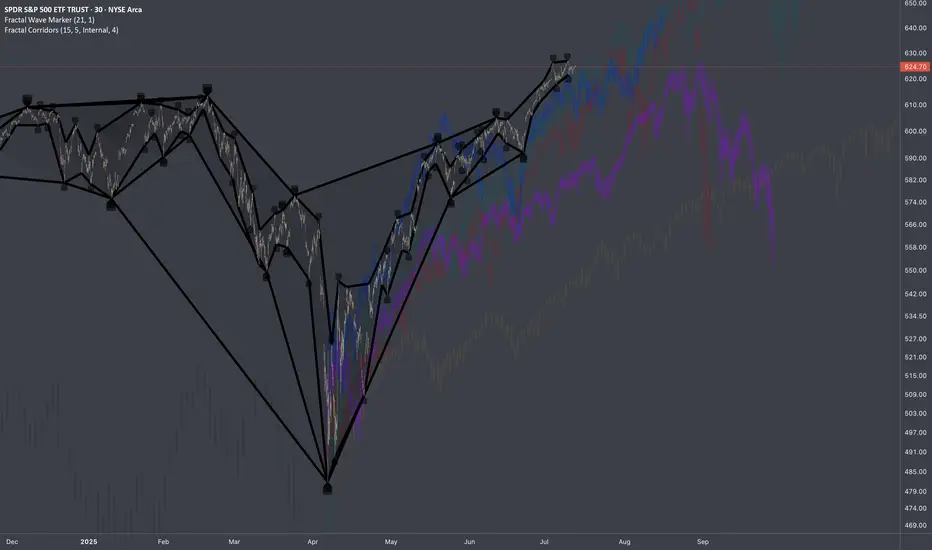
$SPY: Composite Sub-Cycles (Recursive)Research Notes Documenting Commonality
I’ve identified several bar patterns that formed following significant historical declines. They share notable similarities, as if suggesting that the magnitude of past major moves sets the structure of subsequent groups of sub-cycles (which I call "building blocks" sometimes).
I placed them in respect to current scaling laws so the method of exclusion can be applied in order to familiarize with typical "terrain" of price dynamics at such phase. Documenting them because a direct study is the most effective approach to uncovering the essence of recursive patterns.
Some of the bar patterns are lowered to highlight temporal aspect which matters more than price scale.
We start ALT Season now with 3 targets!Hello guys,
As you can see we have 3 targets🎯 green, blue, red,
which target we will reach?
It depends on the Fractal scenario on the right, So we will wait 2 clear trends,
each one has 3 tops and Clear correction between the up trends,,
Don't lose your positions and don't jump between currencies!
Also Don't burn your wallet with Future!
Spot is Enough!

AAVE IDEA JUL11-25So here is a quick one
Let’s see how this OB works in seach of short-term liquidity 💪


Bitcoin Fractal, increase to $116k Hi Everyone☕👋
BINANCE:BTCUSDT
Been such a long time since I posted. Today I'm looking at BTCUSDT, and I'm looking at the previous all time high cycle and what we were seeing (the pattern aka fractal).
Here's why we're likely going a little higher.
First correction of -32%
Followed by first peak, ATH
Correction, then the second peak and the REAL ath. Which is where we likely are:
Interesting to note that the previous time, the second ath was NOT THAT MUCH HIGHER. This should be considered to manage expectations in terms of how high we can go. Anything above +6% is a bonus.

Learning#02 : Fractals⛰️ Learning#02 : Fractals
The Cleanest Clue on a Cluttered Chart
If you like clean charts and smart price behaviour, Fractals are one of those tools that give subtle but powerful signals. They’re not magic. They simply reflect what price is telling you—if you’re willing to listen.
Let’s unpack the concept and learn how to use Fractals like a pro.
🔍 What Is a Fractal in Trading?
In technical analysis, a Fractal is a five-candle pattern that marks a local top or bottom in price. It’s a pure price-action signal that doesn’t rely on lagging indicators.
There are two types of Fractals:
Bearish Fractal (Top): The 3rd candle has the highest high, surrounded by two lower highs on each side.
Bullish Fractal (Bottom): The 3rd candle has the lowest low, flanked by two higher lows on each side.
These formations are Price's way of saying: *"I tried to go further, but couldn't."
📊 What Do Fractals Indicate?
A shift in short-term control (bulls vs. bears)
Minor support or resistance zones
Useful markers for entries, exits, or trailing stop levels
They don't guarantee reversals but are excellent at highlighting where price momentum may pause, reverse, or build structure.
📈 How to Use Fractals – A Practical Guide
Let’s be clear: Fractals are not trade signals by themselves.
Instead, they work best when used in confluence with your strategy. Think of them as tools that:
Help confirm breakout levels
Refine pullback entries
Guide you in drawing cleaner trendlines, fib zones, and support/resistance levels
Assist in identifying swing highs and lows for Dow Theory-style trend analysis
🔗 Fractals + Strategy = Smart Trading
Whether you trade breakouts or mean reversion, Fractals help clarify:
Which highs or lows matter
Where to place stop losses with structure-based logic
How to trail SL as the trade progresses
They quietly organize your chart into readable, tradeable levels.
🚀 Practical Uses of Fractals
Fractals are the first tool I add to any chart—they instantly reveal structure and guide every step of my analysis.
1. Breakout Confirmation
Wait for a candle to close above a bullish fractal high or below a bearish fractal low.
Useful when the market is trending or forming structures like double bottoms/tops.
2. Pullback with Confirmation
Use the fractal zone as a short-term S/R level. If price returns and shows signs of rejection (like an inside bar, wick rejections, or low volume), consider entries based on confirmation.
Great in sideways or swing environments.
3. Trend Structure Validation
Fractals reveal clear pivot highs/lows, helping:
Confirm higher highs/higher lows
Mark structure for trendline drawing
Validate Fib levels or S/R zones
4. Trailing Stop Loss
Update your SL to trail behind the most recent opposite-side fractals.
In longs: SL below new bullish fractals
In shorts: SL above new bearish fractals
This lets you stay in the move while managing risk like a pro.
How it’s Look Like on Chart
snapshot
⚠️ Common Mistakes to Avoid
Trading every fractal blindly
Ignoring price context or trend
Relying on fractals in low-volume, choppy markets
📝 Final Thoughts
Fractals are like breadcrumbs left by price action. They quietly point to areas where the market faced resistance or found support. Alone, they’re not enough. But in the hands of a price-action trader, they’re incredibly useful.
Used alongside market structure, confirmation signals, and clean charting habits, Fractals become:
Trend identifiers
Entry enhancers
Stop loss trail markers
⭐ Bonus Tip
Next time you mark a level, Fibonacci or draw a trendline, check if a Fractal confirms it. You’ll be surprised how often it does.
Trade simple. Trade clean.
— Kiran Zatakia

Bitcoin: Boundaries of Progression (Dual Aspect)Structure Source
Modification:
Extending fibonacci ratios: x.146 and x.886 to define missing levels (Fibs express probabilistic "layers")
Dual top curves to define boundaries if price continues traveling further up with its distinctive progression.

GBPUSD - Also continued downside continuationLooking at GU. This is a little bit ahead of its time in comparison to EU.
And what i mean by that is EU is a lot further away from its 4H demand zone compared to GBP so it will be super interesting to see how we react at the level we are fast approaching on GU.
I am in a short position as of Friday. I will be posting a video tomorrow showing exactly how and why i got short on GU so stay tuned for that one.
As always if there is anything else i can be of assistance with give me a message and i will be happy to answer any questions you may have

EURUSD - Still Orderflow remains bearishLooking at EU. The 1H Orderflow is still maintaining that bearish intent. My area is set now for where i want to take a potential sell to the downside seeing as everything else is pretty much mitigated.
The only issue with this potential sell of is that we never really had a sweep of liquidity before we rolled over and moved to the downside.
We do have a level of inducement before our POI but i think in an ideal world i would love to see us build up a bit more liquidity before the POI just to induce the early sellers before making that move to the downside.
For now. On the lower TF's i will be looking to take short term long positions back up to our POI before looking for the longer terms short. to our 4H POI in which i will be looking to get long once again.
Any questions feel free to give me a message

$AAPL: Breaking Down Broader Cycle via FibsPublishing separately a specific interconnection type mentioned in idea below:
Testing this particular way of mapping the multi-scale cycles:

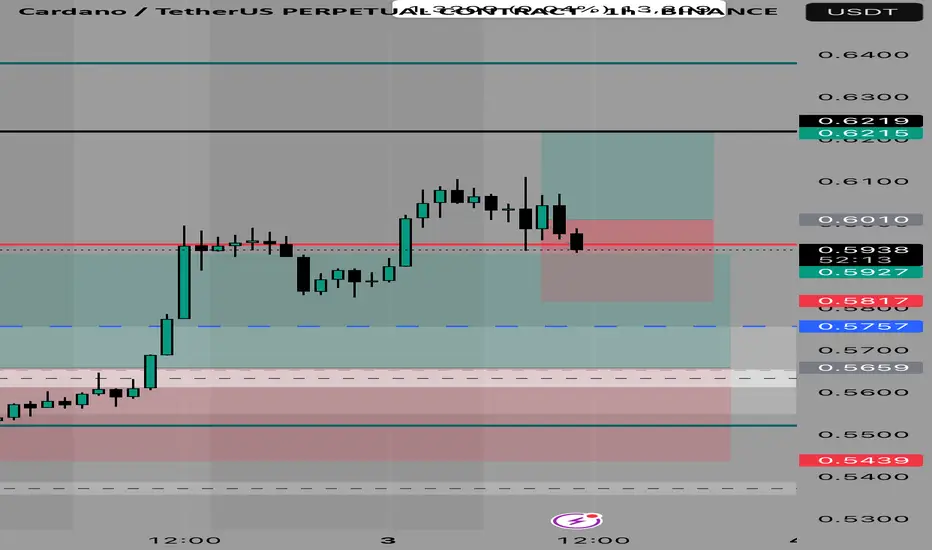
ADA idea 03 07 25Grids can it’s a great way to deal with volatility and timming within a range with clear PD Arrays

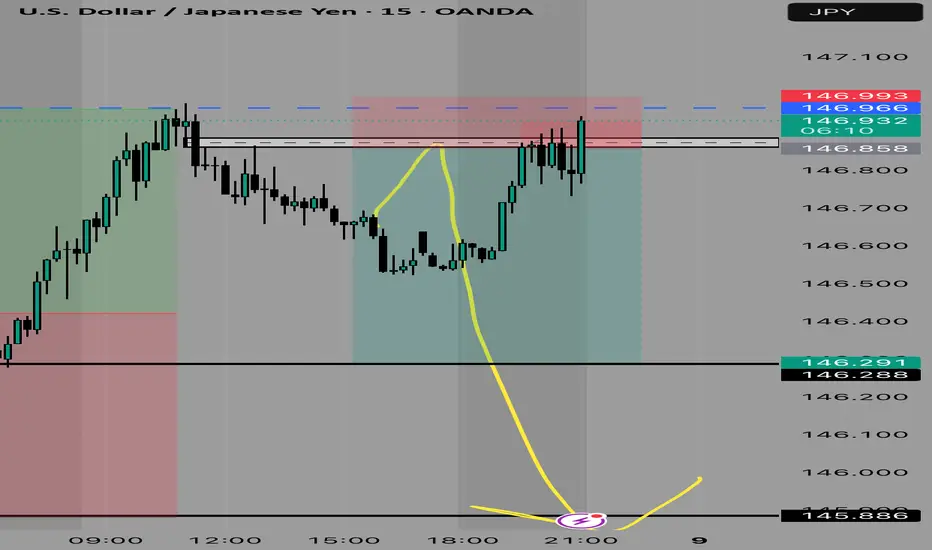
USDJPY IDEA 08/07/25So we are looking for a Discount Zone with this one. Since we are in a Premium PD Array, we are expecting a short term reversal
XRP/USDT Monthly Chart: History Repeating Itself?Hey traders! Let’s dive into this monthly XRP/USDT chart. I’ll be honest — I’m skeptical about this outcome, but let’s break it down because it could actually happen!
The chart screams déjà vu, with XRP’s price action mirroring the 2014-2018 period. Back then, XRP broke out from its 2014 ATH in 2017, leading to a massive rally. Fast forward to now, and we’re seeing a similar setup, but with a twist. XRP is struggling to break through the 2018 ATH resistance zone around $3.31, which reminds me of the Breakout Consolidation phase we saw in 2017. Historically, this consolidation led to a breakout, and the chart hints at a potential repeat!
If XRP breaks out soon, we could see a parabolic move, potentially targeting much higher levels. However, the current resistance is a tough hurdle, and if it fails, we might see a pullback to lower supports.
Key Levels to Watch:
Resistance: $3.31 (2018 ATH)
Support: $1.643 (previous consolidation low)
Breakout Target: To be determined (potentially parabolic)
Breakdown Risk: $0.650
I’m not fully convinced, but the setup is intriguing — could this be XRP’s moment to shine? What do you think? Let’s discuss below!

BTCUSDTBitcoin may be looking to complete the downward correction from the $101,000 price range to $99,000 and then begin a long-term upward trend. Pay close attention to the extent of the correction and don't give in to fear or greed.
In any case, it should go to $1300,000.
BINANCE:BTCUSDT

BTC Long / Buy SetupBTC is strongly Bullish towards 120k liquidity level, I'm not seeing any healthy correction before hitting the 120k level. If BTC strongly breaks and closes below 106.9k then chances are high that it will touch the weekly level and again come to 107k level, but this time it will struggle to break the 107k level because it will become bearish fvg, if it holds the 107k level and give any strong reaction from the zone then the next level is 120k. even a wick towards 105k or below doesn't matter, any body closing below the 106.9k (at least 4hrs) will lead short term weakness to the trend.

GBPUSD - 2 Selling opportunitiesLooking at GBPUSD
We have 2 opportunities to get short. Both have a build of liquidity before the areas of supply before them. This means we are looking for the early seller to get into the market before we get in so that all the early seller get stopped out.
As we can see the order flow on this is still bearish. So until the market shows me it want to go higher then we will remain bearish
Keep a close eye on this for tomorrow