Ethereum’s Last Chance: Let Jesus Take The WheelEthereum’s price action over the course of this crypto bull run, and especially since the beginning of this year, 2025, has been nothing short of horrendous. It’s failed to hold almost every single important level that it needed to, to be able to keep pushing higher. This has caused almost all crypto investors and altcoin traders to pull their investments out, and drive the price even lower. At its current point, altcoin traders have lost all but 100% of the confidence they once had in it, and to retail investors, this is basically toxic waste once they see the losses that have been taken, it’s driving them away en masse.
With that being said, this is ETH’s final stand, it’s time to either show out, or go home with nothing to show for itself. It’s at a very critical support level right now, and if it breaks down below this, the trade will be cancelled. It’s just finished completing the ‘Jesus Take The Wheel’ pattern on the weekly & MONTHLY. This is an extremely high probability pattern, and could cause a blow-off top for Ethereum.
We also see that we got a Wykoff Pattern here, with the last one that we got around the $2k level being a fake out. The only other times it has printed aside from the last fake out, it has been the start of a bull run. ETH now has 6 weeks in total, or about 4 more weeks from now to start recovering old levels, and taking off to the moon.
I drew a bar pattern on the chart that I took from its original bullish pattern from the start of the 2013 bull run. I believe we’ll have a shortened cycle, and due to not having much time left to complete the bull run during this 4-year cycle, that’s all we will get. Thankfully, the price has been beaten down so much, that getting in now, will offer 1000% gains, in just about 6 months. This will be one of the most incredible feats in all of crypto.
Fear is at an all time high, and ETH has been teasing everyone with a bull run for months and even years now. We haven’t seen an all time high since 2021. Most investors will suffer from boredom exhaustion as well, and with the stock market also sinking, we could see a huge push once we recover some levels, for the masses to finally come into the market via Ethereum ETF’s, so they don’t have to actually risk any money moving crypto around. The boomers and traditional investors with stock accounts will be free to throw cash at these ETF’s and that’s what will give us our final pumps past all time highs, once the crypto traders all get back into the market, and get us to new ATH’s in the first place, and help us recover key levels.
One thing is clear: ETH needs to stop trying so hard to control its environment, it’s time to just let Jesus Take The Wheel 🚀
Fractal

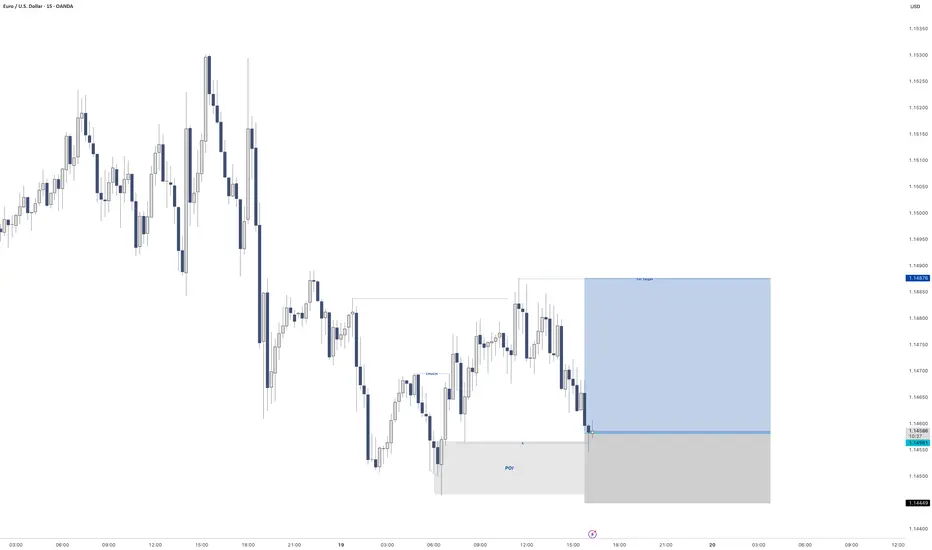
EURUSD - 2nd potential entryEvening all
Here is a still screenshot of what I am looking for the market open on EURUSD come Sunday night after the spreads have died down on the pair.
My pending order will go directly on the FVG with my stops below the manipulation of the range.
If I get tagged in great. If I don't also great if we continue to move high I mill just manage the one position.
If I am tagged in I will give you and update with a new idea and then depending on how that idea plays out win or lose I will come back and re-visit it and break it down some more.
However I have high hopes for this trade to make it up to 1.16300
Have a great weekend
and I will speak to you all soon

EURUSD - BreakdownApologies video is a bit rushed.
Wanted to get it done before the weekend arrived.
There's so much more to this video and entry reason that I have left out unintentionally like the fact we swept the Asia lows before creating a BoS. There are also a few other things like I have left out but without looking at the chart right now I cannot remember off the top of my head.
I will post the idea of this trade below so you can see that I was taking it before it played out.
Hope you all have a great weekend and a better trading week than you had this week.
Enjoy
P.S if you have any questions please do message

ZIG ZAG MOTION 15MINS, FRAMECHARTSThe GOLD pair has been on a move for 3 days now, with a ranging pattern within a channel around the price timeline between 3300+ and 3400 reacting to a firm line of resistance on an overall uptrend, as usual, I expect the price to break either of these levels before we look for trading opportunities.
NOTE: Please note that this is not financial advice, but rather an educated and speculative view of the expected outcome. Therefore, trade responsibly.

AMD: Mapping Cycle via 3 FibsWaveform
High To High cycle Fib interconnection
Extension to the right matches recent bottom.
Expanding and anchoring the structure on L2L cycle
Levels around 3 intersections expose highest probability density.

EURUSD - LongGreat set. Very close to Demand on the HTF to the left.
CHoCH on the 15min that left behind some liquidity.
Also created some liquidity to the right.
Very nice set up for me.
Triggered into the trade
Lets see how we go
NASDAQ Analysis Stalking shorts on the Daily - nearby.
My weekly sentiment is bearish cause of technical factors.
Among the catalysts is bullish performance on the US Dollar index and price action compared to the US30 & US500.
Look to sell near 4H swing high, entry using the 15M bearish ChoCh only after three legs of bullish correction on the 1H frame into the highlighted levels of the swing high.
Anticipation is for the third leg to react bearish and the fourth leg to deliver impulse to the sell side.

EURUSD - SHORT We have built up quite a lot of liquidity before our major supply zone.
Will give an update in the morning after seeing where price is at

GOLD - Selling opportunity on the horizonLooking at gold.
We have a nice bearish continuation orderflow on the 15min TF.
We have a nice potential inducement level of liquidity that we are more than likely to take before moving lower.
This is a reduced risk entry due to where we are on the higher TF as we are pulling into a potential demand zone on the higher timeframe.
ITS REALLY IMPORTANT to remember where we are in terms of structure and as we well know Gold doesn't tend to fall for to long as it remains bullish the majority of the time. so in regards to the HTF like I mentioned above we are still bullish so we are expecting a reversal for the longer term at some point in the near future so this could be a case of get what we can from the market and then look for our LTF orderflow to switch Bullish before then looking for them long entries

GBPUSD - Next point of interestAfternoon All,
So our GBPUSD trade from earlier didn't quite go to plan however I knew full well that we were building liquidity to the left on the higher timeframe.
This will be my next point of interest for a potential long.
Lets see how price plays out when we get down there.
GBPUSD - LongUnfortunately I can't post the idea on the 5min to give you a better idea of where we are at in terms of the entry for this.
However I am looking to be tagged into this trade and have a limit order where I have set it.
Hoping to be tagged in. If we aren't we move on. and if we lose we move on.
If im able to help with any questions you may have do send them my way

GBPUSD - LONG Looking at GBPUSD
We have a great set up occurring on the 5min timeframe for a potential long.
We will see how it plays out and will do an update video on this later.

EURAUD Potential Longs - Technical Outlook 17.06.2025Overall Trend & Context:
FX:EURAUD has been in an overall uptrend since mid May when price reacted off a daily demand level.
Technical Findings:
Price is currently trading just above the discount (equilibrium).
Would prefer to see it drop into the discount area - There are areas of demand on the 1h chart which we could possibly consider however the 4h demand shown on the chart above qualifies as a STRONG zone to trade from.
Notes:
If we see a 15m shift in structure it may be worth getting involved.

NZDUSD - Trade Re-cap Take a look at the NZDUSD trade re-cap.
Here I explain exactly what I was looking for in getting this 1:10RR trade from start to finish.
Hope this helps

NVDA: Fractal Wave BreakdownBreaking above Rounding Top Pattern after rejections.
Wave transformed from pullback to impulsive one, which implies that the emerging structure needs to be routed to relative cycle.
Waveform
Referral structure looks like compressed version of decline after ATH.
As if the movement of big magnitude that pierces through SL levels, causes "shockwaves" that resets frequency of reversals of forthcoming waves.
Fibonacci interconnection of ATH and Bottom

Macromics Group: Market Trends Overview (June 2025)Global Economic Landscape: What Has Changed?
June 2025 marks significant shifts in the global economy. After several years of instability caused by the pandemic, inflation, and geopolitical tensions, markets are gradually stabilizing. However, new challenges are emerging: rising risks in Asia, digital transformation in Europe, and strategy shifts in the U.S.
China and India continue to show strong growth rates—5.8% and 6.5% respectively. Europe, by contrast, is lagging behind due to slow recovery and persistent inflation. The U.S. maintains a steady course driven by consumer spending and innovation, reporting 2.1% GDP growth.
Macromics Group continues to deliver in-depth analytics and strategies for clients seeking to understand and capitalize on these changes. We analyze trends across more than 120 industries, helping companies adapt and thrive.
Macroeconomics and Monetary Policy: A Shift Toward Stabilization
Financial regulators have begun cautiously lowering interest rates after the peaks of 2024. The U.S. Federal Reserve has dropped its rate to 4.5%, while the ECB has reduced its rate to 3.75%. This is made possible by a decline in inflation: 2.7% in the U.S. and 3.1% in the EU.
Meanwhile, developing nations like Turkey and Argentina are still grappling with high inflation. These countries risk falling behind the global recovery unless decisive steps are taken.
Overall, the global course is toward soft stabilization: interest rates remain high but steady. This creates favorable conditions for investment and long-term planning.
Financial Markets: From Caution to Moderate Optimism
Stock markets in June 2025 show mixed performance. U.S. indexes such as the S&P 500 and Nasdaq hit new highs, thanks to the booming tech sector. Stocks of companies involved in AI, quantum computing, and cybersecurity are particularly strong.
European markets are less active but relatively stable. Growth is limited by high costs, demographic issues, and the transition to ESG standards. In Russia and CIS countries, markets are under pressure due to sanctions, currency restrictions, and reduced investment.
On the currency front, the U.S. dollar and Chinese yuan dominate. The ruble is volatile, the euro is stable, and the yen is strengthening as a safe haven asset.
Technology: The Engine of New Markets
The main trend in 2025 is AI and automation. Companies are deploying neural networks in logistics, marketing, finance, and HR to cut costs and boost efficiency. Demand for AI professionals and developers is surging.
5G infrastructure has matured in most developed countries, unlocking new potential in IoT, telemedicine, and remote work. At the same time, quantum computing is advancing rapidly, with commercial solutions expected by 2026.
Macromics Group invests in next-generation analytical platforms, enabling clients to access real-time insights and forecast trends before they go mainstream.
Energy and Sustainability: ESG and the “Green” Shift
Energy markets have stabilized after the turbulence of 2024. Oil prices remain between $70–$85 per barrel—comfortable for both producers and consumers. Meanwhile, renewable energy—solar, wind, and hydrogen—is seeing record investment.
Corporations are increasingly reporting according to ESG standards. It’s not just a trend, but a new business reality. Investors demand transparency, consumers prefer socially responsible brands, and regulators impose mandatory reporting.
Macromics Group supports clients in transitioning to sustainable models by developing ESG strategies, assessing risks, and offering financial solutions.
Conclusion: Outlook for the Second Half of 2025
The first half of 2025 showed that markets are learning to operate in a new reality. The global economy is no longer chasing rapid growth, but adapting to volatility. Key focus areas are technology, sustainability, and smart resource management.
For businesses, this means quick adaptation, innovative thinking, and reliance on data-driven decisions. In this context, Macromics Group serves not just as an analyst but as a strategic partner.
Our recommendation: act proactively. In times of uncertainty, those who plan years ahead and use quality data will win.

NZDUSD - LongWhen the market opens and the spreads die down. Will definitely be entering this trade to the upside.
We are still in a HTF bullish orderflow.
This is a great buy set up as we are at a very discounted price.
Lets see how It plays out

Potential long setup EURUSDTook almost two months for us to take April high well done for those who caught the move. This analysis will probably take a lot less time to play out.
Friday closed with an inside bar which means you would have to go onto lower timeframes to see which direction makes more sense to go.
I have not been given any reason fundamentally or technically to be bearish on the pair just yet so I will be targeting the high.
The daily FVG is a key area to look at and if it fails and we start making bearish FVGs that could be a sign that we will start getting a weekly or even a monthly pullback.
That's all I can say for now stay safe and flow with the markets.

Bitcoin is holding the 200 EMA on H4 despite everything...Despite war news and heavy sell volume, BTC held the 200 EMA on H4.
Low-volume weekend = low liquidity, yet bears still couldn’t break it.
🧠 Classic Effort vs. Result: big effort, weak result = hidden strength.
🎯 If it holds: $106.5K → $108.2K → $110K in play.
Structure intact. Bulls stealthily in control.

Bitcoin: Higher Degree Wave DimensionsA new long-term pattern has been identified. Essentially a stretched version of the chart shown here:
This resemblance holds to some extent, as the coordinates are anchored to relatively longer cycles:https://www.tradingview.com/x/PUxSDlLx/
Publishing this one in raw form (intentionally minimal) just to document a recurring structure across extended timeframes.


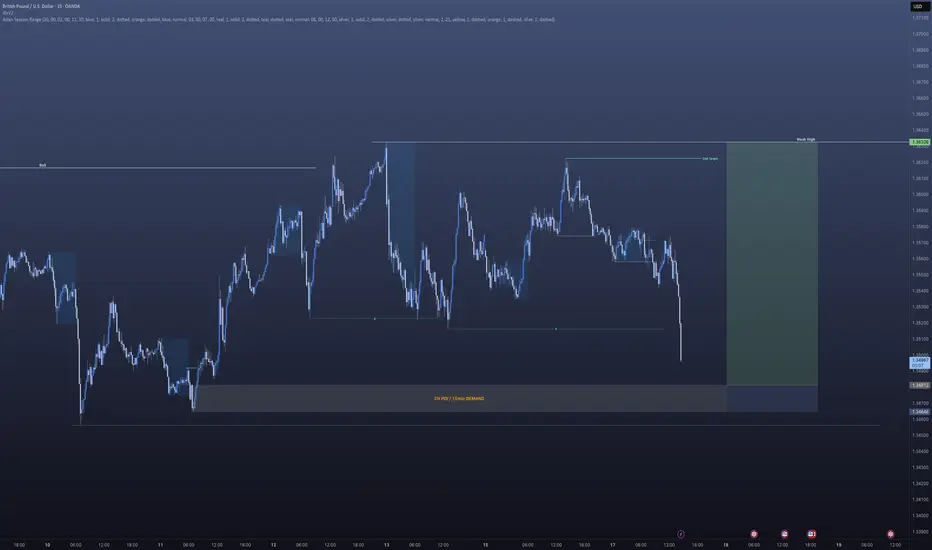
EURUSD, GBPUSD - Outlook for next weekEURUSD - So we have 2x 4 hour POI's (Points Of Interest). Will be looking at potential reversals at both POI's however, within the first POI we have an area of potential liquidity that could look to be taken before we make out move back to the upside.
Therefor, the second POI could look to be our more solid option for our buying options at some point next week.
GBPUSD - This pair looks to be building its liquidity now for potential trades to the upside as today on the lower TF's it was setting quite a few traps for the potential longs and the traders that would have been shorting the breaks below structure to the left.
If you have any questions for me please do let me know

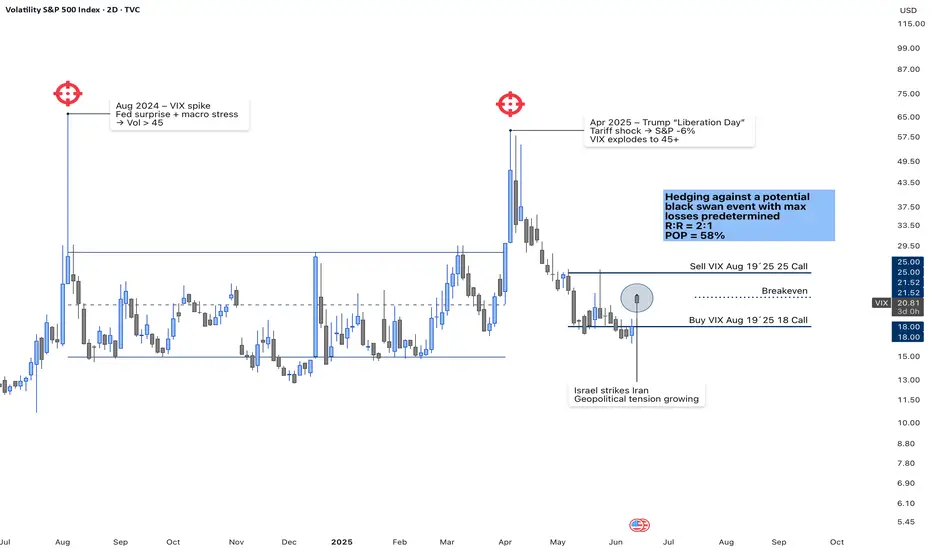
VIX Call Spread – Hedging Against Black Swan Risk (Aug ’25)📌 VIX Vertical Call Spread – Aug 19, 2025 (18/25)
Executed on June 13, 2025
Volatility has compressed near multi-month lows, but the chart shows two major spikes above 45 in less than a year — triggered by macro shocks (Fed surprises, Trump’s “Liberation Day” tariffs, geopolitical escalations like Israel–Iran).
I’m positioning with a long call spread on the VIX (Buy 18C / Sell 25C, exp. Aug 19), structured to hedge against a black swan while maintaining capital discipline.
• Risk/Reward: 2:1
• Probability of Profit (POP): ~58%
• Breakeven: ~21
• Defined risk / Defined reward
• No directional delta risk
I’m not forecasting volatility — I’m accepting that extreme events can (and do) happen. This spread pays off only if volatility spikes again above 21–22 in the next 60 days, which aligns with historical context.
🔒 No need to predict the trigger. Just manage exposure and define your risk upfront.
📈 Follow for more volatility and options setups based on structure + context.
Let’s stay ahead, not reactive.