We keep comparing fractals BTC 2019-2021 Last April I made a comparison of fractals towards a bear market and it was carried out, we currently see a recovery but how true can it be in the face of a bullish break? We can get to have a bulltrap and come back again and double-bottom in the 30k. Otherwise, we can break well and head towards the 44-48k level in case this is done in a good way, we could visit a double top or if we draw a fibonacci extension in the medium term, go towards 100k but in the case that not If it happens, we could head towards catastrophe and visit not only again as a triple floor at 30k, but 24k at the base of our canal.
Fractales

Can Bitcoin make 500% in next 200 Days ?Nothing special to see here folks
But let's take a look back after 6 months will pass from now on. Let's see if I finally decrypted the right fractal again.
China ... China ... China
BARTS head and CHINAs ape the same :jokes on you:
Cheers
ChaChain
-------------
Disclaimer:
I´m not registered or licensed in any jurisdiction whatsoever to provide investing advice or anything of an advisory or consultancy nature, and therefore I´m unqualified to give investment recommendations. Always do your own research and consult with a licensed investment professional before investing. This communication is never to be used as the basis of making investment decisions, and it is for entertainment purposes only.
KEYWORDS
R:R, money management, risk, reward, technique, style, trading, bitcoin , bitcointrading, profitable trading, profittrading, profit trading, secret, divergence, bull divergence, bear divergence, divergencetrading, divergence trading, trading strategy, how to trade bitcoin , bitcoin trades, bitcoin trading, make profit, take profit, trading strategy, trading technique, successful, successful trader, successful technique, successful strategy, successful secret, how to trade, trend analysis, technical analysis , indicators, rsi , relative strenght index, let it rain, successful life, easy strategy, easy trading, easy technique, make money, crypto investing, investing, crypto, cryptocurrency, cryptocurrencies, mentoring, money, chartart, beyond technical analysis

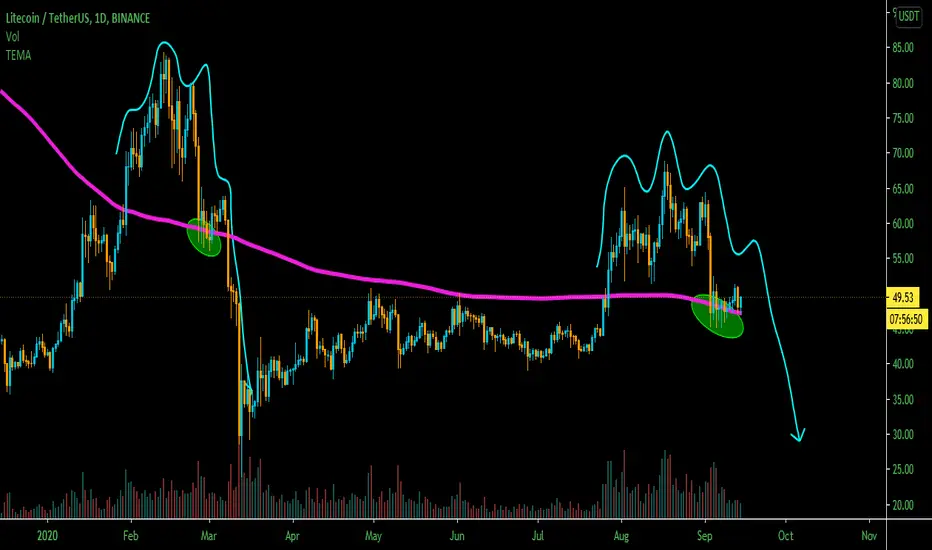
Litcoin price Daily Fractalsprice holding 200 ema and fractals looks the same let's see how this behaves.
BTCUSD Third Super WaveHello guys
It can be go like this
Tmw alt is most important if it can break that we can be happy for other TMW
We are in Third super wave

