Fractalmarket

SHORT - Bitcoin, medium-term projectionAccording to my technical analysis, a correction in Bitcoin prices should begin to be generated, it has generated the 5 Elliot waves, it has respected the fractals, it has generated a double top and it is at a 52-week high, so which the greatest probability is that it will fall between 38% and 50% according to the Fibonacci retracements to continue with the upward trend. What do you think?

Scott Carney's "Deep Crab" & the Fields Medal in MathematicsQ: What does the former have to do with the later?
A: The intuition in the former (S. Carney) is born out by the later (A. Avila; Fields Medal - 2014)
From Scott Carney's website;
---------------------------------------------------------------------------------------------------------
"Harmonic Trading: Volume One Page 136
The Deep Crab Pattern™, is a Harmonic pattern™ discovered by Scott Carney in 2001.
The critical aspect of this pattern is the tight Potential Reversal Zone created by the 1.618 of the XA leg and an extreme (2.24, 2.618, 3.14, 3.618) projection of the BC leg but employs an 0.886 retracement at the B point unlike the regular version that utilizes a 0.382-0.618 at the mid-point. The pattern requires a very small stop loss and usually volatile price action in the Potential Reversal Zone."
---------------------------------------------------------------------------------------------------------
From Artur Avila's Fields Medal Citation;
---------------------------------------------------------------------------------------------------------
"Artur Avila is awarded a Fields Medal for his profound contributions to dynamical systems theory, which have changed the face of the field, using the powerful idea of renormalization as a unifying principle.
Description in a few paragraphs:
Avila leads and shapes the field of dynamical systems. With his collaborators, he has made essential progress in many areas, including real and complex one-dimensional dynamics, spectral theory of the one-frequency Schrödinger operator, flat billiards and partially hyperbolic dynamics.
Avila’s work on real one-dimensional dynamics brought completion to the subject, with full understanding of the probabilistic point of view, accompanied by a complete renormalization theory. His work in complex dynamics led to a thorough understanding of the fractal geometry of Feigenbaum Julia sets.
In the spectral theory of one-frequency difference Schrödinger operators, Avila came up with a global description of the phase transitions between discrete and absolutely continuous spectra, establishing surprising stratified analyticity of the Lyapunov exponent."
---------------------------------------------------------------------------------------------------------
The connection here, as it is related to the specific "Deep Crab" harmonic pattern in trading, between intuition and general, analytical result, is illustrated somewhat simplified (but without distortion).
In essence, Avila has shown that in dynamical systems, in the neighborhood of phase-transitions in the case of one-dimensional (such as: Price) unimodal distributions, after the onset of chaos, there are islands of stability surrounded nearly entirely by parameters that give rise to stochastic behavior where transitions are Cantor Maps - i.e., fractal.
From that point it is an obvious next step to generalize to other self-affine fractal curves , such as the blancmange curve , which is a special case of w=1/2 of the general form: the Takagi–Landsberg curve. The "Hurst exponent"(H) = -log2(w) , which is the measure of the long-term-memory of a time series .
Putting it all together, it is not pure coincidence that a reliable pattern (representation) emerges from intuition (observation) which proves to be a highly stable (reliable) pattern that is most often the hallmark of a near-term, violent transition.

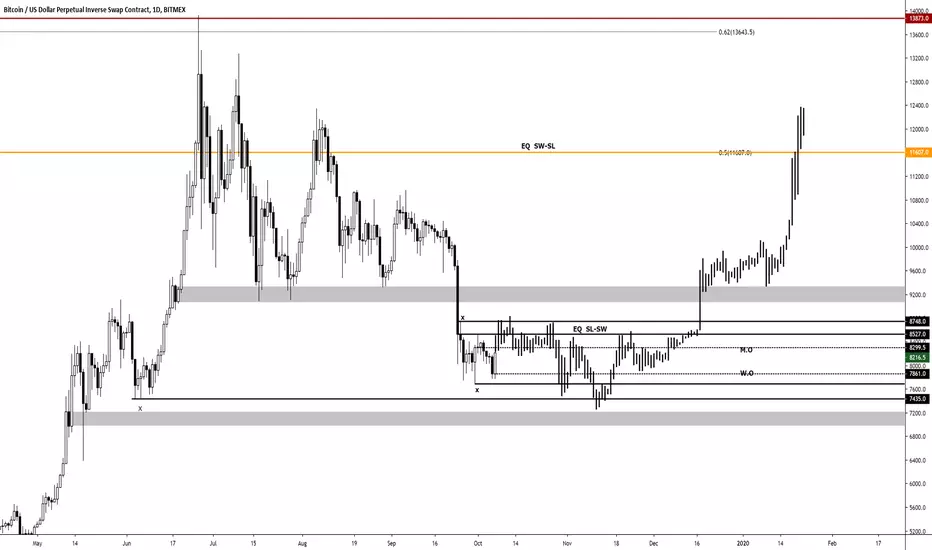
Would love to see the sell side liquidity taken out I would love to see the sell side liquidity taken out prior to the relatively equal lows where liquidity is resting below and it happens to be just below the discount zones... yesterday I and my community went long on GBPUSD/AUDUSD and eurusd ...if you have been following my shared ideas here I did say I would love to see the buyside liquidity on Gbpusd taken out ..well go look at your chart ..anyways stay safe guys ...
#Iamace #Acethetrader #AcetradeingAcademy

Bitcoin Fractal LineOverlaying BTC current data with old fractal from macro, will be interesting if it plays out from HTF to LTF

Can Bitcoin make 500% in next 200 Days ?Nothing special to see here folks
But let's take a look back after 6 months will pass from now on. Let's see if I finally decrypted the right fractal again.
China ... China ... China
BARTS head and CHINAs ape the same :jokes on you:
Cheers
ChaChain
-------------
Disclaimer:
I´m not registered or licensed in any jurisdiction whatsoever to provide investing advice or anything of an advisory or consultancy nature, and therefore I´m unqualified to give investment recommendations. Always do your own research and consult with a licensed investment professional before investing. This communication is never to be used as the basis of making investment decisions, and it is for entertainment purposes only.
KEYWORDS
R:R, money management, risk, reward, technique, style, trading, bitcoin , bitcointrading, profitable trading, profittrading, profit trading, secret, divergence, bull divergence, bear divergence, divergencetrading, divergence trading, trading strategy, how to trade bitcoin , bitcoin trades, bitcoin trading, make profit, take profit, trading strategy, trading technique, successful, successful trader, successful technique, successful strategy, successful secret, how to trade, trend analysis, technical analysis , indicators, rsi , relative strenght index, let it rain, successful life, easy strategy, easy trading, easy technique, make money, crypto investing, investing, crypto, cryptocurrency, cryptocurrencies, mentoring, money, chartart, beyond technical analysis

Fractals - Super weekly Cycles repeatingFractals are inner parts of DFT strategy: Here some thoughts
In this case, the super weekly cyles are repeating its loading pre bull pattern.
Weekly pattern are strong indicators even if they are subject to an important lag.
IMO this chart deserves to be published for what it worths.
-Current price fractal shows a double top similar to the root fractal of 2017. Max deviation of the weekly price is currently reachs which is usually sign of tha local top & node not yet break out.
-Current DFT fractal shows the same harmonics pattern to the root fractal of 2017.
This could lead us to lateralisation of the price till the end of the year 2020 before a huge bull run.

BTC - fractal comparisonHi there!
I just wonder if history can repeat again and make a similarly steps like in the past.
Also I have to confess that I made this chart only to kill the time. Hence you have to take it with a pinch of salt.
Whether it's possible to goes according to this trajectory I have no balls to say.
I suppose the BTC -1.59% have to get 60% of dominance before we could see some real ride.
If we wanna talk about the end of this bear market firstly we have to overcome two obstacle.
There are two conditions which should be fulfil if we wanna talk about the uptrend :
1. break the daily MA 200
2. make a new daily higher peak
It's so simple but so far at the same.
Have a good day !

$BTC - Fundamental analysis of its value (and why it will go up)Fractal Markets Theory:
www.investopedia.com
"The role of information is crucial in making sound decisions with any sort of investment strategy. Within the framework of FMH, the impact of information availability can lead to changes in time horizons and liquidity. During times of stability, FMH states all investors share the same information. How information is perceived results in the individual investment decisions: a day trader may perceive price fluctuations and decide to sell, while a pension fund manager will place less value on price movements. "
Metcalfe's Law:
en.wikipedia.org
"Metcalfe's law states that the value of a telecommunications network is proportional to the square of the number of connected users of the system (n2)."
Digital blockchain networks appear to be following Metcalfe’s Law:
www.sciencedirect.com
"Finally, the potential for identifying value bubbles that can be spotted as deviations in value from the model was discussed and illustrated using the data from one of the networks. Those value bubbles show up where repeated extremely high value increases are not accompanied by any commensurate increase in the number of participating users, or any other development that could give rise to the higher value."
Fundamental analysis: Bitcoin holds many of the same intrinsic values as the internet, therefore should also follow the same theories that have been applied to the internet and other telecommunication networks. The growth of bitcoin's value from sub $10,000USD to $20,000 was artificial, leading to a lack of strong support when it faced media news/speculations used to destabilize it; news that bitcoin investors themselves spread. Following Metcalfe's Law, we can hypothesize that the run up to $20,000 was a bubble and we are now seeing bitcoin return to its original support, at a higher fiat value, due to an increase in users.
Following the volume osc., we can see that historically price drops as it increases; this seems to be from panic selling causing oscillation to rise. As the volume osc. value decreases, bitcoin's dollar value naturally rises. I believe this is because of its natural growth as a coin, removing all the hype and FUD.
The fundamental reasoning for its value diving in recent times is due to news being spread to manipulate the market value. Korea's government, who said they would ban it, reversed positions more than a few times, apologized for being so confusing,
and even had inside trading with the officials who released negative statements on it. Now they are stating they do have a use for it.
China said they would ban bitcoin in mid-late 2017 and Antshares/$NEO took a nose dive. NEO is a centralized (for now) cryptocurrency that ties blockchain to ID; it utilizes $GAS to fund ICOs and was chosen by China because of NEO's vetting process for ICOs. They wanted to cut down on scams and track their citizens' use.
Referencing MEX_Exchange's fundamental reasoning: ICOs are funded with milliions of dollars in their pre/private stage from private investors and VCs; most credit cards have limits in the thousands. Limiting credit cards can shake market sentimentality, but only if cryptocurrency investors believe it to cause harm to its value. A lot of bearish predictions by well respected entities definitely is a fundamental reason for $BTC to lower in the short term.


FRACTALS IN MARKETS: WEEKLY CHART VS 15 MINUTE CHARTBenoit Mandelbrot is famous for his contribution to the field of fractal geometry. While studying for his PhD at the University of Paris, he found that if a coastline is broken up into smaller pieces, the smaller pieces look exactly like the larger ones. In fact, the smallest piece of coastline looked exactly like the entire coastline. This concept is applied to everything in nature (trees vs smaller trees; a tree branch looks like a little tree, with smaller branches of its own.)
Small pieces look exactly like the whole. It is because of this theory that time-frame does not matter in any market to trade. However, the smaller the time-frame, the faster you must react, and the shorter your stops and targets should be, which is inherently much more challenging to deal with - both emotionally and mechanically.

WHY AUDUSD MIGHT BE A GOOD LONG-TERM SHORTALL CURRENCY PAIRS IN WHICH THE USD IS THE
DENOMINATOR HAVE BEEN FOLLOWING A SIMILAR
ARC SHAPE SINCE THE 2009 RECESSION.
AS WE CAN SEE HERE, JPYUSD, CADUSD HAVE REACHED
THEIR PREVIOUS SUPPORT AREAS. ONE CURRENCY
PAIR THAT HASNT REACHED ITS PREVIOUS LOW
IS THE AUDUSD. ALL MARKETS WORK TOGETHER,
THEREFORE I BELIEVE THIS PAIR IS LAGGING
COMPARED TO IS RELATIVES. AUDUSD COULD BE
A GOOD POTENTIAL SHORT IN THE LONG RUN
AFTER ITS CURRENT CONSOLIDATION.
