Trend Line Tested Twice Is AUD/USD Ready to Rally?📈 AUD/USD Market Insight – Potential Bullish Breakout Ahead?
The AUD/USD pair has respected a key trend line, bouncing off it for the second time — a sign of potential strength. If the price revisits and successfully retests this trend line, we could see a bullish momentum (a pump) play out.
On the flip side, if the pair maintains its current trajectory without pulling back, focus shifts to the 0.65415–0.65455 resistance zone. A clean breakout above this range could open the doors for a move higher — potentially targeting swing highs and key liquidity zones.
🚀 Watch closely — the next move could be significant.
🔎 Always DYOR (Do Your Own Research). This is not financial advice.
Freeforexsignal

EURJPY SHORT – DAILY FORECAST Q3 | W29 | D15 | Y25💼 EURJPY SHORT – DAILY FORECAST
Q3 | W29 | D15 | Y25
📊 MARKET STRUCTURE SNAPSHOT
EURJPY is currently reacting from a key higher time frame supply zone, with price action showing weakness at premium levels. Structure and momentum are now aligning for a short opportunity backed by multi-timeframe confluence.
🔍 Confluences to Watch 📝
✅ Daily Order Block (OB)
Strong reaction and early signs of distribution.
Previous bullish momentum is losing steam; structure is flattening with rejection wicks forming.
✅ 4H Order Block
Break of internal structure (iBoS) confirms a short-term bearish transition.
✅ 1H Order Block
1H structure shift bearish
📈 Risk Management Protocols
🔑 Core principles:
Max 1% risk per trade
Only execute at pre-identified levels
Use alerts, not emotion
Stick to your RR plan — minimum 1:2
🧠 You’re not paid for how many trades you take, you’re paid for how well you manage risk.
🧠 Weekly FRGNT Insight
"Trade what the market gives, not what your ego wants."
Stay mechanical. Stay focused. Let the probabilities work.
🏁 Final Thoughts from FRGNT
📌 The structure is clear.
The confluences are stacked.
Let execution follow discipline, not emotion.

AUDUSD SHORT & LONG DAILY FORECAST Q3 D7 W28 Y25AUDUSD SHORT & LONG DAILY FORECAST Q3 D7 W28 Y25
Professional Risk Managers👋
Welcome back to another FRGNT chart update📈
Diving into some Forex setups using predominantly higher time frame order blocks alongside confirmation breaks of structure.
Let’s see what price action is telling us today! 👀
💡Here are some trade confluences📝
✅Daily Order block identified
✅4H Order Block identified
✅1H Order Block identified
🔑 Remember, to participate in trading comes always with a degree of risk, therefore as professional risk managers it remains vital that we stick to our risk management plan as well as our trading strategies.
📈The rest, we leave to the balance of probabilities.
💡Fail to plan. Plan to fail.
🏆It has always been that simple.
❤️Good luck with your trading journey, I shall see you at the very top.
🎯Trade consistent, FRGNT X

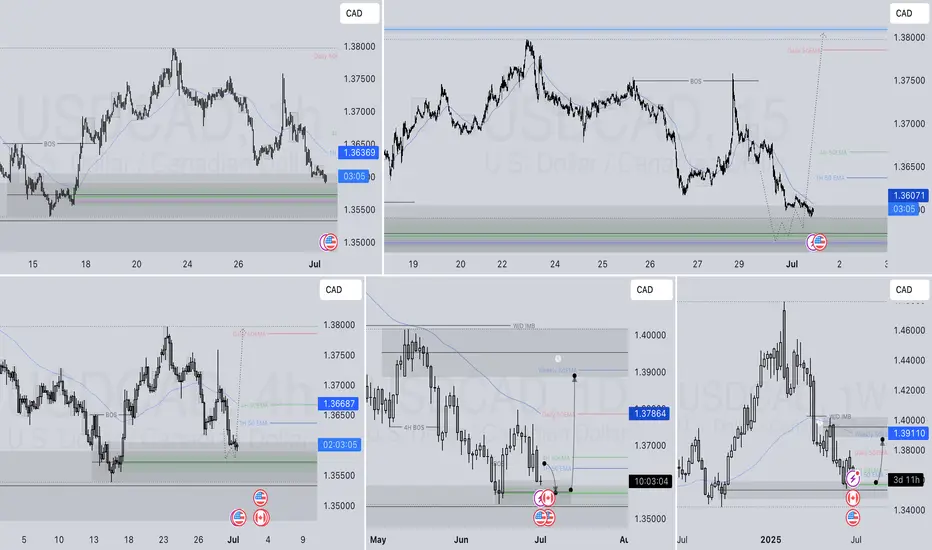
USDCAD LONG DAILY FORECAST Q3 D1 W27 Y25USDCAD LONG DAILY FORECAST Q3 D1 W27 Y25
IS USDCAD FINALLY READY TO LONG !
Professional Risk Managers👋
Welcome back to another FRGNT chart update📈
Diving into some Forex setups using predominantly higher time frame order blocks alongside confirmation breaks of structure.
Let’s see what price action is telling us today! 👀
💡Here are some trade confluences📝
✅Daily Order block identified
✅4H Order Block identified
✅1H Order Block identified
🔑 Remember, to participate in trading comes always with a degree of risk, therefore as professional risk managers it remains vital that we stick to our risk management plan as well as our trading strategies.
📈The rest, we leave to the balance of probabilities.
💡Fail to plan. Plan to fail.
🏆It has always been that simple.
❤️Good luck with your trading journey, I shall see you at the very top.
🎯Trade consistent, FRGNT X
USDJPY: Bullish Continuation Confirmed?! 🇺🇸🇯🇵
USDJPY looks bullish after a test of a recently broken resistance.
The price formed a bullish imbalance candle on an hourly time frame
after its test and violated a resistance line of a bullish flag pattern then.
I believe that the pair will continue growing.
Goal - 145.8
❤️Please, support my work with like, thank you!❤️
I am part of Trade Nation's Influencer program and receive a monthly fee for using their TradingView charts in my analysis.

NZDUSD, SHORT Sell until the 38.2% fibbo dailyNZDUSD Sell until the 38.2% fibbonacci level on daily timeframe, moreover the RSI makes a bearish divergence and is overbought.

USDCAD: Bullish Confirmation?! 🇺🇸🇨🇦
USDCAD leaves multiple bullish clues after a test of a key daily support.
One of those is a bullish breakout of a resistance line of a falling parallel
channel on an hourly time frame.
The pair may bounce today.
Goal - 1.3685
❤️Please, support my work with like, thank you!❤️

gbpaud simetrical triangle gbpaud is starting to form a neutral pattern, make sure first gbpaud breaks resistance or breaks support so you know where the next movement is going, but I think gbpaud will move up towards 1.844. So I recommend doing long positions

audcad tradingplan audcad is still moving in an uptrend channel but now there is potential for a short decline and the potential to continue rising again, just focus on looking for buys so that the risk is low

USD/JOY MAY START GOING UPIf a Candle on either daily or the 4-Hr Time Frame can close above the Support line, and also on the other side of the thick red Trend line, then, prepare for a leg up. We are still waiting for the right time to buy. One major determining factor is the upcoming FOMC meeting. If interest rate rises from there and the Fed signals even more rate hikes, then, it is very likely that the pair will rocket up from here.
Good luck
fb @ForexGoldandOil

AUD/CAD MAY BE GETTING READY TO GO UPAUD/CAD finally reached the support line (coming from our SELL call earlier on), and may be getting ready to start coming back up.
If the daily support is steady, we will be looking at buying AUD/CAD at around 9028. Our Stop Loss will be around 8968.
A candle on the 4-hr chart at the least must close fully above the Support line before we can BUY.
Good luck
fb @ForexGoldandOil

USDCAD SHORTS TAKENEntered short positions on USDCAD looking for either a short term pullback from resistance or hopefully a longer term side ways move to test previous supportive areas.

EURUSD LONGS TAKENWell price may not make very fast moves this week I want to catch something rather then nothing. So remember overall bias is short but I want to catch the retracement while we wait for the larger moves.

EURUSD UPDATE LONGSI will be looking for small positions for further downside this week but am aware we could be in a possible reversal situation still... overall on the daily I want to see price still make a push to the upside but I think we could be in for a bit of consolidation first! This is just my view so trade at your own risk and do your own analysis as well. Hope everyone smashes it this week!


BUY EURJPY The price has touched the resistance with no apparent strength, we expect a pullback, so we decided to go long.
📊EURJPY
BUY PRICE: 127.53
TP: 127.93
TP:128.33
SL: 127.13
R/R: 1/2

Get short on USDCAD Easy peasy :D ;)FX:USDCAD
It has retested the strong zone and ready to fall down !!

DXY (SHORT) moves before 2021According to my private data and strong previous analysis, I think that Dollar was really affected this year regarding all the events that happened. Pandemic situations, new president to White House, and other main events.
Regarding this I think we might see the price go even further down this month with a high probability of reaching a area of (DXY - 0.886700/0.88200) , then at the start of 2021 we for sure will see the recovery of the Dollar to previous resistance reaching areas of (DXY - 095200/0.095600)
If you like this idea, feel free to share!
Good luck traders!

AUD/USD is Moving DownwardsIt is the AUD/USD 2hr chart. At present, it's rising by taking the support of the minor support trendline. The trend moves the same as the previous then, it will touch the following targets 0.7390 - 0.7422 .
But if we analyze the trend, it's trying to break the minor support. RSI also shows the downtrend. So, if it falls, the trend will reach the following targets 0.7340 - 0.7324 .

Will USD/CHF take a U-turn?USD/CHF is collapsing, which may try to recover the loss. Short-term investors can buy nearby the strong support channel for the targets of 0.9000 - 0.9060 - 0.9110 .
At present, I don't recommend to sell at this point. Day traders can sell below the support trendline but after consecutive two or three red candles.
I will update the downside scenario while it becomes unstoppable. Currently, my above targets are intact for the positional traders.

GBP/USD Signals for Day TradersGBP/USD has broken the downtrend and started rising upward. But how far it runs? There's a hurdle ( 1.3016 ). It can take a reversal from the hurdle level for the levels of 1.2978 - 1.2923 . And the downtrend will resume after the breakout of the last target.
What if it breaks the hurdle?
I prefer to take a long position after the breakout of the hurdle level. We may see a continuous uptrend from here. Targets: 1.3053 - 0.3100+

Will USD/CHF complete the Elliott Wave & make the 5th wave?Here I took an Elliott wave pattern to set the next levels of this downtrend of USDCHF. Wherein expected wave 5 ends at/nearby 0.9061 . Hence, the day traders can short USD/CHF below the resistance line for the following targets: 0.9084 - 0.9076 - 0.9060 .

A Big Move in EUR/GBP: Gann Fan & Fib RetracementRightnow, EUR/GBP at 4/1 value of Gann fan. There are more chances of collapsing compare to the bullish side. Day traders can sell for the following target price: 0.9080 - 0.9060 - 0.9040 and below.
Hurdle: 0.9132
According to this chart, if FX:EURGBP crossover the hurdle level, the buy position can be initiate here. The bullish targets are described above in the chart.
