CADCHF top-down analysis , UPDATEDHi Guys, let’s make a full top-down analysis of this pair, we will take the trade if all the condition of the strategies are satisfied. Press like button to support this video and let me know in the comment section if you have any questions.
Freeforexsignals


Where to buy EURUSD??EURUSD currently facing a strong weekly support and monthly 38.20% fib level.
If on the new week bullish price is seen, this zone shown on the chart is the best place to buy!!

GOLD top-down analysis, UPDATE!!Hi Guys, let’s make a full top-down analysis of this pair, we will take the trade if all the condition of the strategies are satisfied. Press like button to support this video and let me know in the comment section if you have any questions.

GOLD top-down analysisHi Guys, let’s make a full top-down analysis of this pair, we will take the trade if all the condition of the strategies are satisfied. Press like button to support this video and let me know in the comment section if you have any questions.

How To Avoid The Market Makers Stop Hunt Movement As part of the daily movement in the forex market is the stop hunting done by the market makers. They don't mean to hunt the normal and small trader at all, they are targeting the big investors and hedge funds you just happen to be in the wrong place at the wrong time.
As shown in No.1 this huge wick is an obvious stop hunt movement in this case the market makers are hunting the ones entered in the middle or at the end of the uptrend. Lesson learned here
"NEVER ENTER A TRADE IN THE MIDDLE OF A TREND ALWAYS WAIT FOR A RE-TRACEMENT"
In NO.2 after the price gave a good bearish signal ( hanging man candlestick ) it made a a shooting star candle with huge wick to hunt the stop losses. in this case lesson learned here
" WHEN YOU ENTER A TRADE WITH PRICE ACTION MAKE SURE TO PUT YOUR STOP LOSS ABOVE/BELOW IT WITH AT LEAST 20 - 30 PIPS"
In NO.3 when you trade you will see this low (blue line) broken so you would assume that it will continue to the downside and after you enter a sell trade NO.3 will occur. Lesson learned here is "DON'T ENTER AT THE END OF A SMALL TREND AND USE A GOOD BREAK SIGNAL"
And a last tip " TRY TO THINK AS A MARKET MAKER AND ANTICIPATE THE AREAS THEY WOULD HIT AND PUT YOUR STOP LOSS ABOVE/BELOW IT BY 20-30 PIP"

NZD/CHF strong sell opportunityhi traders you can see the market trend is down and 5 times touch the trend line and break a strong support gone then market create a bullish flag and market again touch the strong trend line and support become resistance gone,,so that is clear, when market break the bullish flag and retest then market again going to downside. Good luck traders.
Thank you so much.

EUR/GBP strong sell opportunityHey guys you can see in this trend line market 7 time touch and go to downside and market again going to touch the trend line and a strong resistance gone..so finally when market create a good candlestick pattern or chart pattern, then you will enter for sell...good luck traders.
Thank you so much.

AUD JPY Strong Sell opportunity,,risk reward 1:5Hey guys How are you? ..Market touch weakly resistance gone aria and Guys you can see aud/jpy market create a double top pattern and triangle pattern..finally market break triangle pattern and again market create retest strong gone area...so you can enter this area and our risk reward 1:5. Good luck traders.
Thank you so much..

USDRUB has made a false breakout to the important weekly supportUSDRUB has made a false breakout of the weekly support zone and may continue aggressively upwards.

Where to sell GOLD from ? The mirror key level is where most likely GOLD may bounce back. Watch price action for sell.

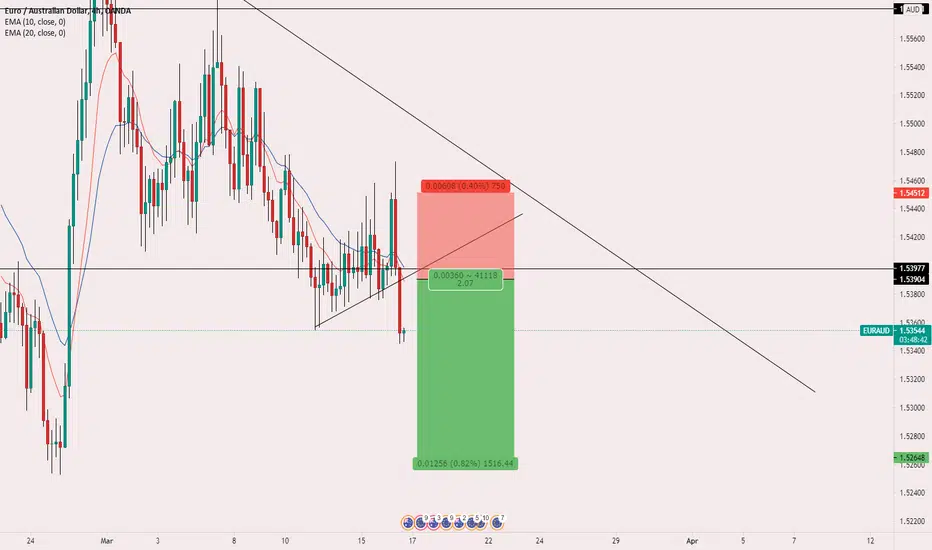
EURAUD Just has broken weekly supportEURAUD is just below weekly support and a high probability sell trade opportunity.
Sell Limit @ 1.53904
Stop loss @ 1.54512
Take profit @1.52648
R/R= 1: 2
Disclaimer: Please note this is not any kind of investment advice and conduct your own analysis before taking any trade based on this
What to do with the GOLD nextGOLD is likely to test the mirror key level and will be a good opportunity to wait. Watch price action on this level for selling.

USDRUB Just bounced from Weekly and Daily supportUSDRUB is likely to rise up to test the trend line before it breaks the weekly and daily support. A buy trade can be a high probability.
Please like the idea and share. Thank you.

AUDNZD May just break the resistance and continue to rise up!AUDNZD is putting pressure on resistance and likely to continue to rise as it has created lower highs below resistance. Also, daily candles closed just above the resistance mean a high probability of going up.

AUDUSD is in Resistance zoneAUDUSD currently just below the daily resistance zone. there can be 1:2 sell trade as described but please make your own analysis before taking this trade.

NZDUSD Have tested the daily trend line and may slide down!!These pair have tested the daily trend line have failed to break it up. It is likely that the following week NZDUSD may start to slide down. Selling would be a high probability, however, please do your own analysis before taking the trade.

GOLD is testing short term trend lineGold is testing its short-term trend line. If it holds the trend line, then it will be a good place to open sell entry.

Is AUDUSD creating head and shoulder pattern on the weekly?It looks like AUDUSD is trying to create a possible head and shoulder on the weekly timeframe. If that happens, get ready for a trend change and ride the trend early for maximum

USDCAD SELL SIGNALUSDCAD is giving a sell signal on the daily timeframe. Price has been rejected from the upside and has formed a pin bar on the daily timeframe.

GBPUSD IDEAHi traders,
GU had a huge run to upside very fast, buyers took control of the market.
as for now GU showed no rejection.
However wee see movement within a chanel as pointed out that has been respected many times.
before the closing of the markets on friday we got 4TH touch on the respected trendline and the pair showed a strong bearish momentum.
i am gonna wait till the market opens how its gonna react.
but most likely tha pair will reach 143 level soon to meet each weekly ressistance.

TOUCH THE RESISTANCE EURAUDResistance touched without strength, we are buying now.
📊EURAUD
BUY : 1.5490
TP: 1.5520
TP:1.5580
SL: 1.5445
R/R: 1/2
Signed by: FxProfitSignals Group

AUDJPY ShortCalled the signal in my group.
pure price action here nothing much.. respected ressistance higher highs that have been respected.. enter short with very tight SL
