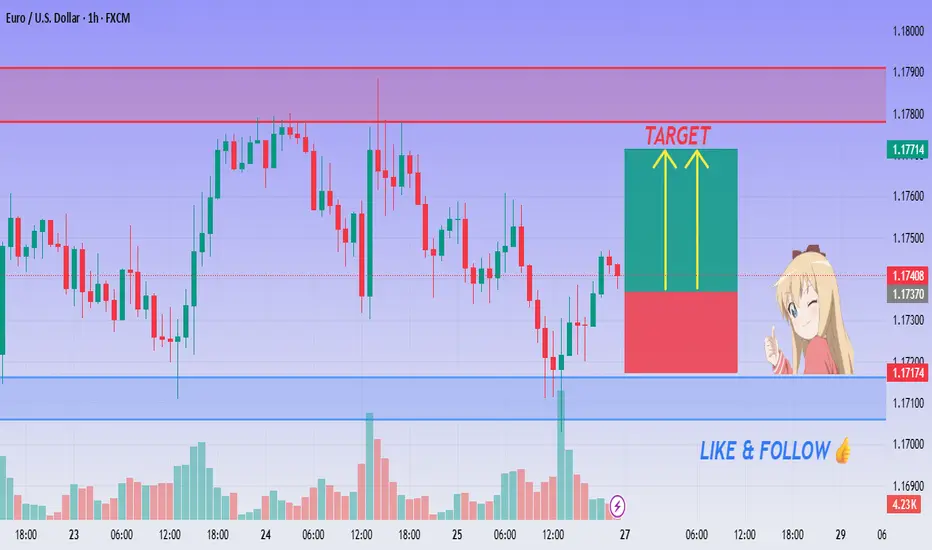
EUR/USD LONG Setup - Next Stop 1.1850?💙 EUR/USD Demand Bounce – Bullish Setup Activated!
👨💻 Dear traders,
EUR/USD is reacting strongly from a recent demand zone around 1.1720, forming bullish momentum on the 1H chart. The current price action suggests buyers are entering after a corrective drop.
📌 Bias – Bullish (Intraday Play)
🎯 Target 1 – 1.1795
🎯 Target 2 – 1.1820
🎯 Final Target – 1.1850
📊 Reasoning:
– Price bouncing off a previously tested support zone
– Green box = optimal long entry zone; red box = risk-managed stop area
– Yellow arrows show potential upside movement
– Volume activity and candle structure confirm buying interest
– Suitable R:R for scalpers and short-term traders
🪙 Wait for confirmation candle & manage your position wisely!
Freesignals
AUDCAD – WEEKLY FORECAST Q3 | W31 | Y25📊 AUDCAD – WEEKLY FORECAST
Q3 | W30 | Y25
Weekly Forecast 🔍📅
Here’s a short diagnosis of the current chart setup 🧠📈
Higher time frame order blocks have been identified — these are our patient points of interest 🎯🧭.
It’s crucial to wait for a confirmed break of structure 🧱✅ before forming a directional bias.
This keeps us disciplined and aligned with what price action is truly telling us.
📈 Risk Management Protocols
🔑 Core principles:
Max 1% risk per trade
Only execute at pre-identified levels
Use alerts, not emotion
Stick to your RR plan — minimum 1:2
🧠 You’re not paid for how many trades you take, you’re paid for how well you manage risk.
🧠 Weekly FRGNT Insight
"Trade what the market gives, not what your ego wants."
Stay mechanical. Stay focused. Let the probabilities work.
FX:AUDCAD

XAUUSD: Bearish Bias SetupI am watching for a possible reversal in XAUUSD, predicting a rejection with a downside target around 3.300.
This downside target is reasonable based on this setup, as it is based on a previous bullish move, from which price could find support and bounce, or break below, and the downside momentum could start to continue down.
I am just sharing my thoughts on the chart, this is not financial advice. Always confirm your setup and manage your risk accordingly.

C / UsdtBINANCE:CUSDT
### **📊 Chart Overview – CUSDT (1H):**
* **Current Price:** \$0.3225
* **Recent Trend:** Price is consolidating below a **descending trendline (red)** after a sharp decline from \$0.44–\$0.45.
* **Key Levels:**
* **Support:** \$0.31 – \$0.32 (highlighted zone).
* **Resistance:** \$0.34 – \$0.35 (trendline breakout needed).
* **Major Resistance:** \$0.4456.
---
### **🔍 Technical Breakdown:**
1. **Downtrend Continuation:**
* Price is still below the **red descending trendline**, which acts as dynamic resistance.
* As long as it stays below \$0.34, the bears remain in control.
2. **Bullish Scenario:**
* A **clear breakout above \$0.34** with strong volume could lead to a push toward **\$0.37 – \$0.40**.
3. **Bearish Scenario:**
* Failure to hold **\$0.31 – \$0.32 support** could open doors to a drop towards **\$0.30 or even \$0.28**.
---
### **📌 Summary:**
CUSDT is in a **critical consolidation zone**. Watch the **\$0.32 support** and **\$0.34 resistance** closely — a breakout or breakdown could decide the next move.
---
⚠️ **Disclaimer:**
*This analysis is for educational purposes only, not financial advice. Always do your own research and trade carefully.*

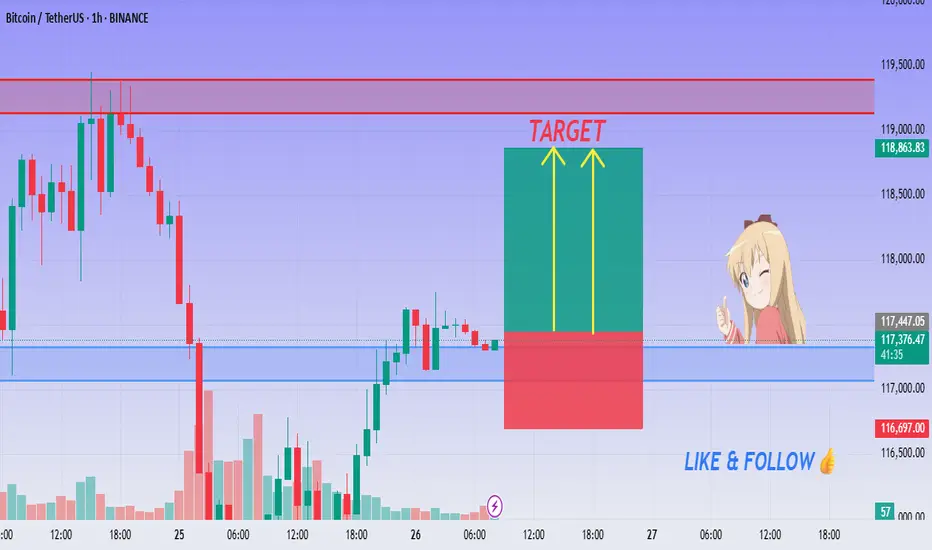
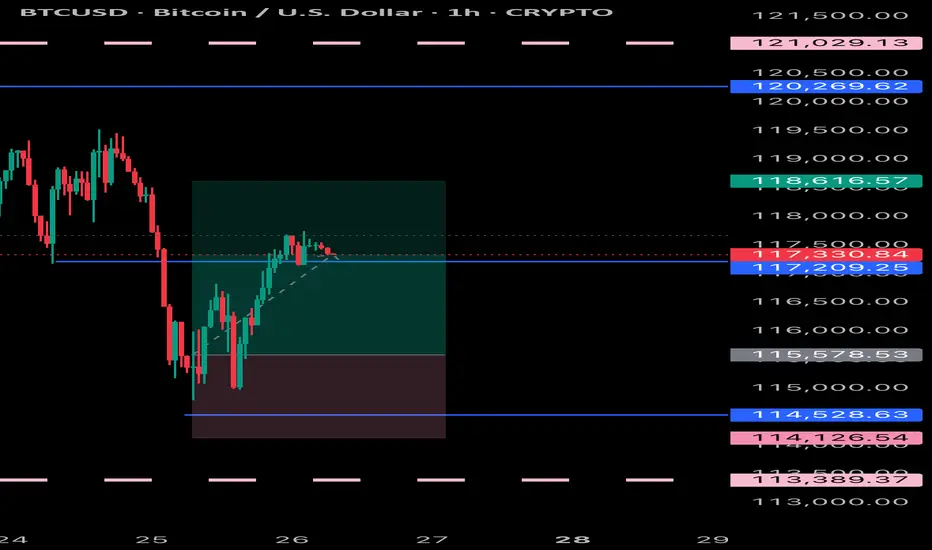
BITCOIN Ready to Pump - 1H Buy Setup Active!💚 BTC/USDT Bullish Breakout Setup ! Entry Activated!
👨💻 Dear traders,
BTC/USDT is showing a sharp rebound from a temporary base structure near $116,500, forming strong bullish momentum on the 1H timeframe. The breakout above local resistance signals the possibility of an impulsive move toward higher levels.
Bias – Bullish (Intraday)
🎯 Target 1 – $118,800
🎯 Target 2 – $119,200
🎯 Final Target – $119,500
🛑 Stop Loss – $116,500
📊 Reasoning:
– Clean bounce from previous structure support
– Bullish engulfing confirms short-term reversal
– Green zone = reward area, red = safe SL zone
– Two yellow arrows project upside momentum
– Strong volume spike during reversal
– R:R favors long scalpers and intraday swing
⚡ Stay disciplined. Let price confirm the zone and follow the momentum!
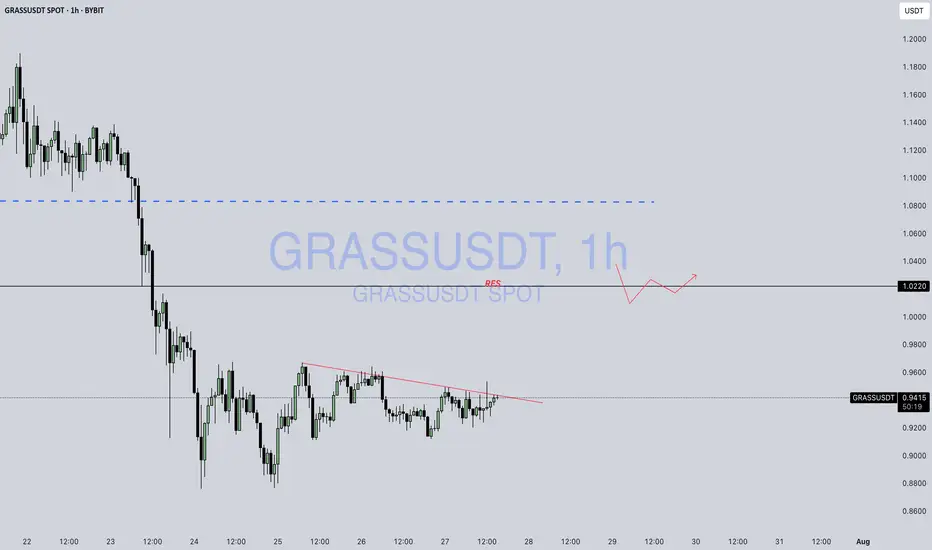
GRASS / USDTBYBIT:GRASSUSDT
Something’s cooking in GRASS coin… 🌱🔥
Be careful — big moves might be brewing. 👀📈
I mention guess it and enjoy the trade...
⚠️ Disclaimer: Not financial advice. Just market observation.
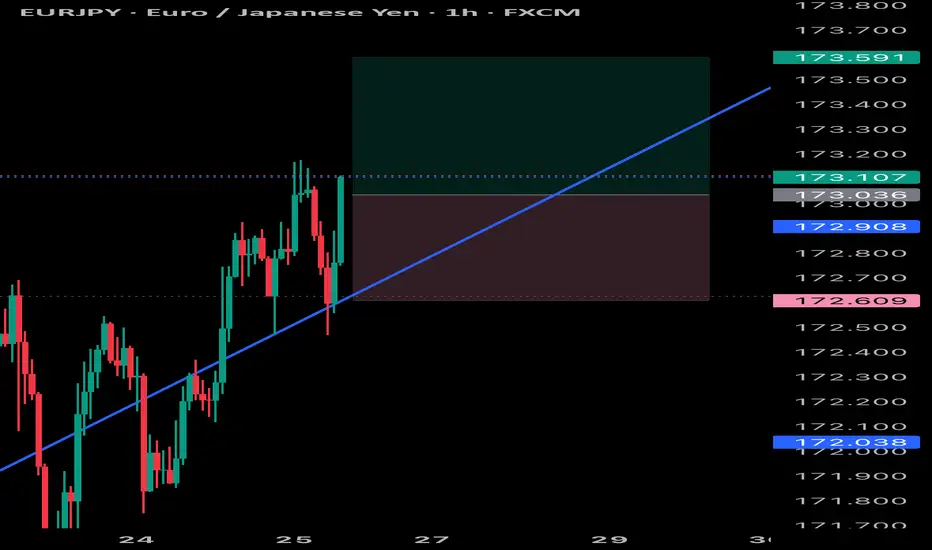
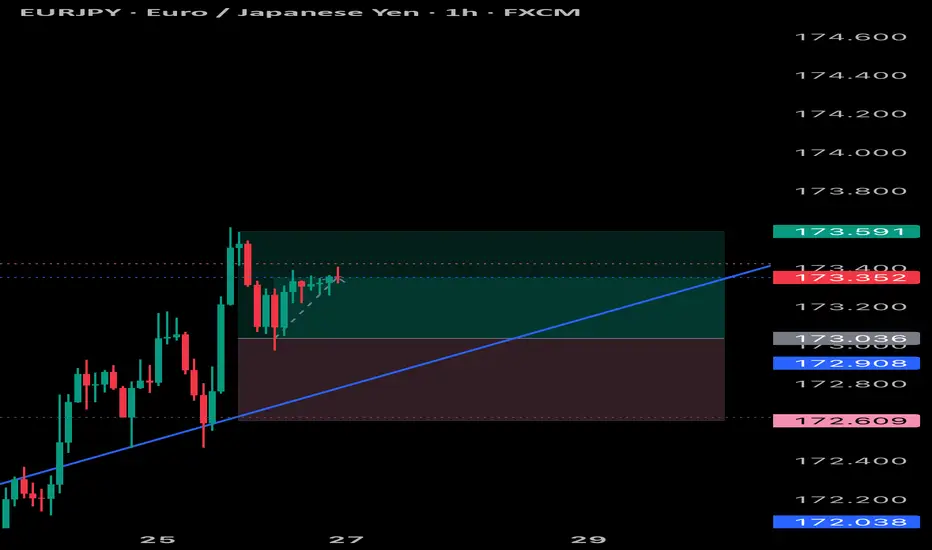
EURJPY – WEEKLY FORECAST Q3 | W31 | Y25📊 EURJPY – WEEKLY FORECAST
Q3 | W31 | Y25
Weekly Forecast 🔍📅
Here’s a short diagnosis of the current chart setup 🧠📈
Higher time frame order blocks have been identified — these are our patient points of interest 🎯🧭.
It’s crucial to wait for a confirmed break of structure 🧱✅ before forming a directional bias.
This keeps us disciplined and aligned with what price action is truly telling us.
📈 Risk Management Protocols
🔑 Core principles:
Max 1% risk per trade
Only execute at pre-identified levels
Use alerts, not emotion
Stick to your RR plan — minimum 1:2
🧠 You’re not paid for how many trades you take, you’re paid for how well you manage risk.
🧠 Weekly FRGNT Insight
"Trade what the market gives, not what your ego wants."
Stay mechanical. Stay focused. Let the probabilities work.
OANDA:EURJPY

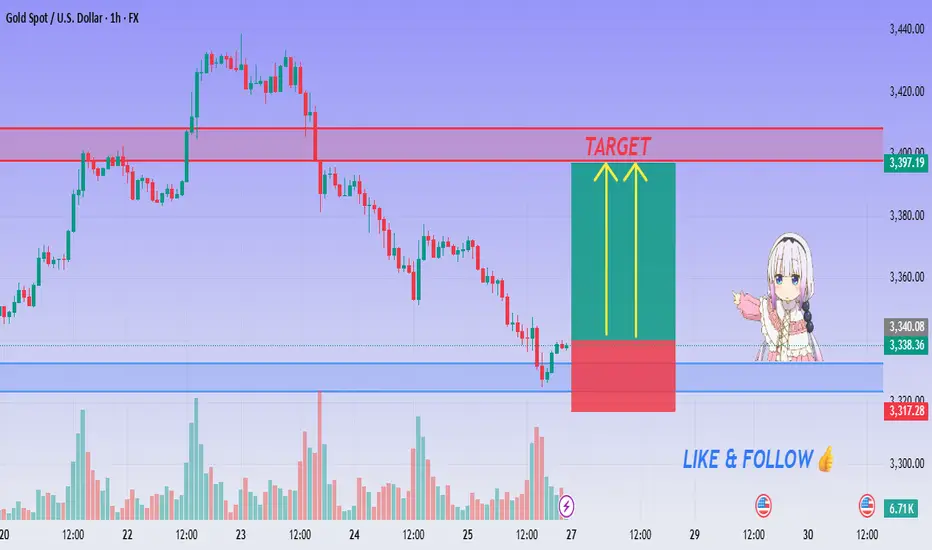
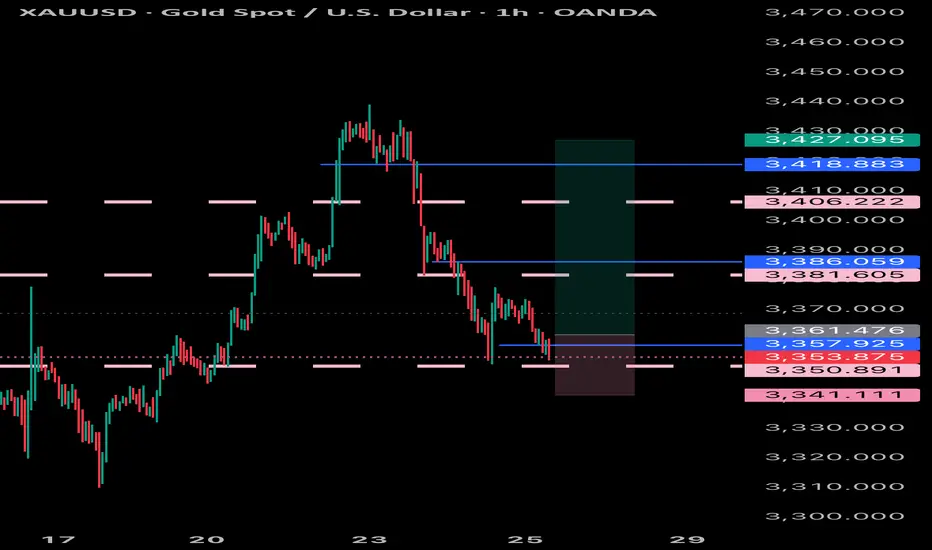
XAU/USD Bounce Alert - Bullish Reversal in Play!💛 XAU/USD Demand Bounce – Bullish Setup Activated!
👨💻 Dear traders,
Gold (XAU/USD) is showing a solid reaction from a well-formed demand zone near $3,308, with bullish candles forming a potential reversal pattern on the 1H timeframe. Buyers are stepping in after extended downside pressure.
Bias – Bullish (Intraday Play)
🎯 Target 1 – $3,380
🎯 Target 2 – $3,397
🎯 Final Target – $3,410
🛑 Stop Loss – $3,297
📊 Reasoning:
– Clear rejection from a previous support-turned-demand zone
– Green box = ideal long entry zone, red box = safe stop placement
– Yellow arrows indicate projected bullish path
– RSI divergence and increasing volume support bullish case
– Good R:R ratio for scalpers and short-term buyers
🪙 Wait for strong candle confirmation and manage risk!
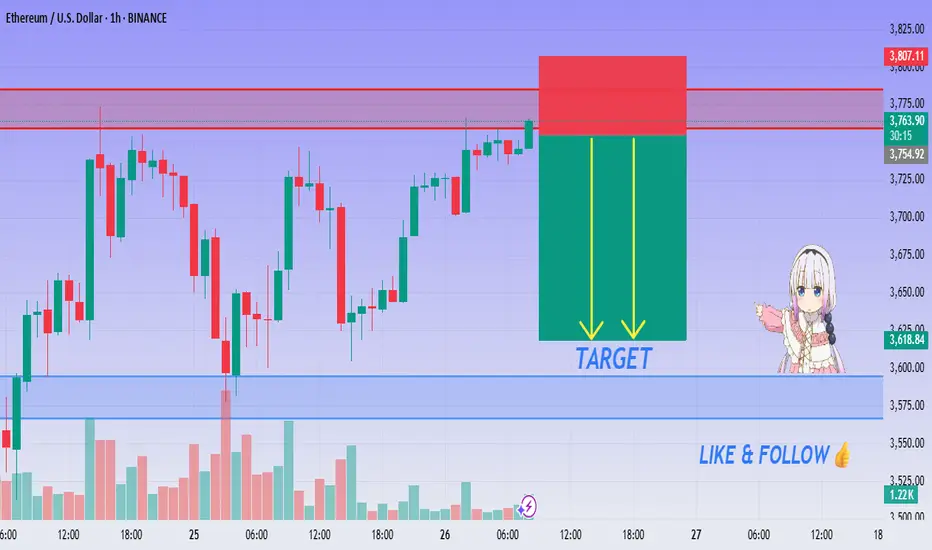
ETH/USD SHORT Setup - Supply Rejection Confirmed!🔴 ETH/USDT Supply Rejection ! SELL Setup Activated!
👨💻 Dear traders,
ETH/USDT is showing signs of rejection from a key supply zone near $3,775–$3,805 on the 1H chart. Price is stalling below resistance, hinting at a possible downside correction.
Bias – Bearish (Intraday Setup)
🎯 Target 1 – $3,715
🎯 Target 2 – $3,685
🎯 Final Target – $3,650
🛑 Stop Loss – $3,810
📊 Reasoning:
– Price tapped a clean resistance/supply zone
– Two yellow arrows signal projected downside pressure
– Strong rejection wicks and bearish candles forming
– Red zone shows ideal stop-loss area above supply
– Clean R:R setup for short-term sellers
– Momentum fading as buying pressure exhausts
⚠ Be patient. Wait for confirmation before entering short!
BITCOIN RESULTS Bitcoin has respected the analysis and held very well it’s been following the trend and can partial close some positions and wait for a nice pullback to buy the dip
EURJPY LOOKING GOOD Eurjpy has been behaving as expected and can continue to the up side and complete its pattern
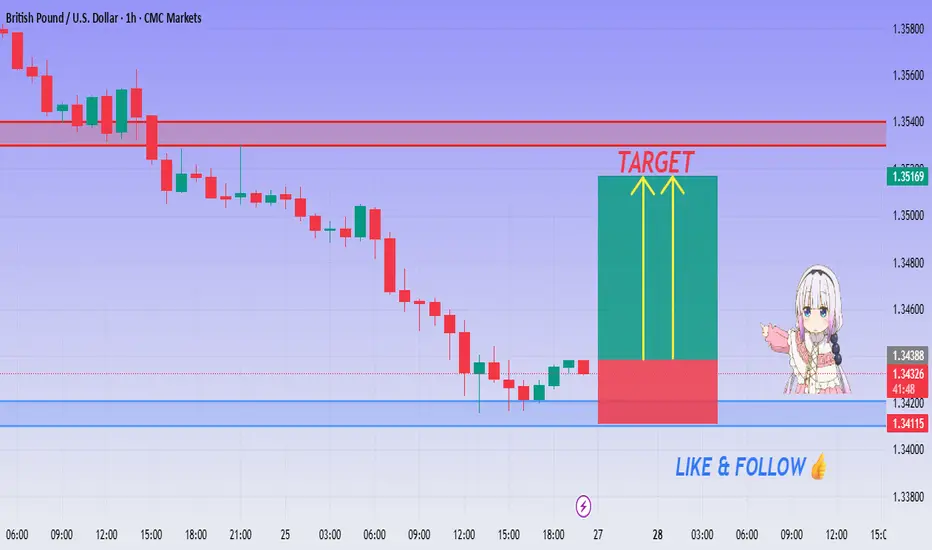
GBP/USD BUY Setup - Big Pump Loading Above Support!💚 GBP/USD Demand Rejection ! BUY Setup Activated!
👩💻 Dear traders,
GBP/USD is bouncing from a clear demand zone between 1.3420 – 1.3440 on the 1H timeframe. Early signs of rejection are forming, signaling a high-probability intraday long.
Bias – Bullish
🎯 Target – 1.34900
🎯 Target – 1.35160
🎯 Final Target – 1.35400
🛑 Safe Stop Loss – 1.34110
📊 Reasoning:
– Price tapped a well-defined demand zone (blue box)
– Small red box marks optimal stop placement below zone
– Two yellow arrows show projected upside path
– Previous support held strongly, momentum shifting bullish
– Excellent R:R for intraday buyers
🍀 Stay patient, wait for the bounce confirmation, and trade smart!
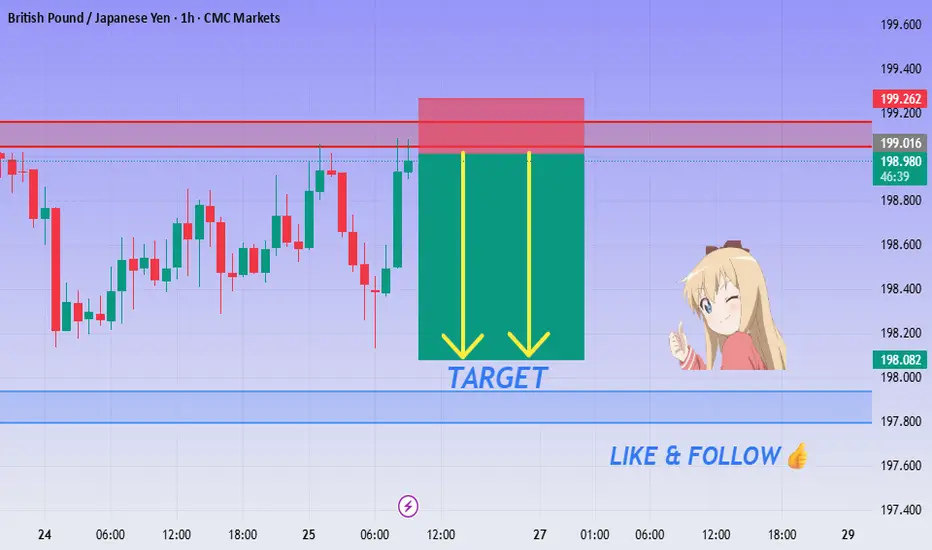
GBP/JPY Breakdown Alert - Bears Taking Control!💙 GBP/JPY Resistance Rejection ! SELL Setup Activated!
👩💻 Dear traders,
After analyzing GBP/JPY on the 1H timeframe, we have a clean short opportunity developing from a key resistance zone around 199.00 – 199.26. Price has stalled and rejected strongly, signaling potential for a bearish move.
Bias – Bearish
🎯 Target – 198.20
🎯 Target – 197.90
🎯 Final Target – 197.70
🛑 Safe Stop Loss – 199.26
📊 Reasoning:
– Price rejected a clear resistance/supply zone
– Red box marks historical rejection area
– Yellow arrows indicate downside momentum zone
– Bearish pressure forming at the top of the range
– Excellent intraday short with clean R:R structure
🍀 Stay patient, trust your levels, and trade smart!
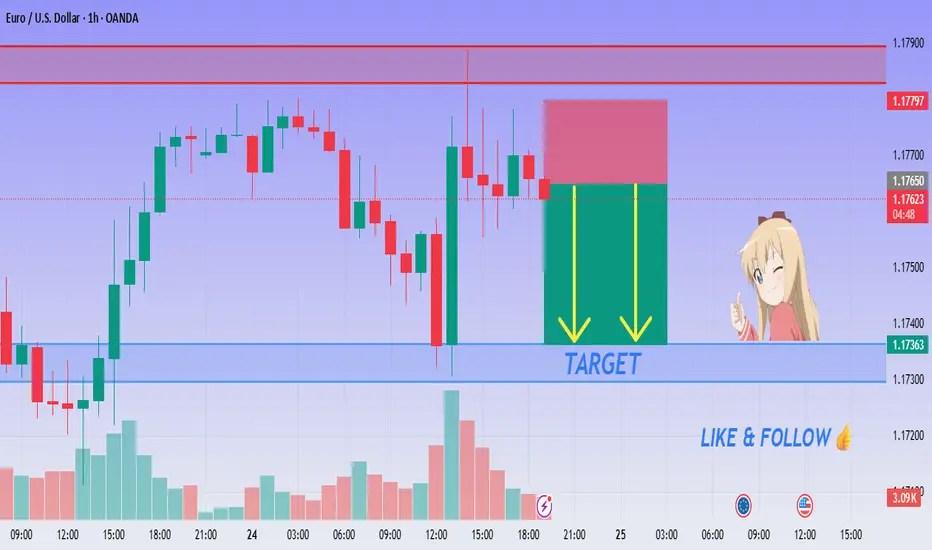
EUR/USD SELL SETUP - Rejection at Resistance!💙 EUR/USD Rejection Confirmed! SELL!
👩💻 Dear traders,
After reviewing the price action on EUR/USD (1H), I’ve concluded the following:
Price is reacting to a clear supply zone around 1.17680 – 1.17780, and signs of rejection have started appearing.
Bias – Bearish
🎯 Target – 1.17450
🎯 Target – 1.17320
🎯 Final Target – 1.17200
🛑 Safe Stop Loss – 1.17820
📊 Reasoning:
– Price touched key resistance and began stalling
– Red zone marks a clean rejection range
– Two yellow arrows show expected short move
– Trend is turning bearish near resistance
– Ideal intraday short setup with clear R:R
🍀 Stay sharp & follow the setup! Good luck!
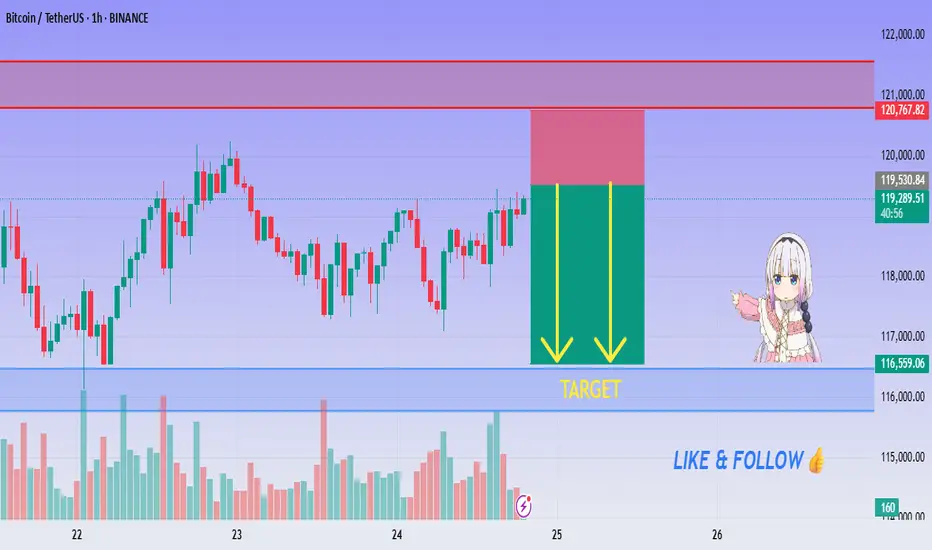
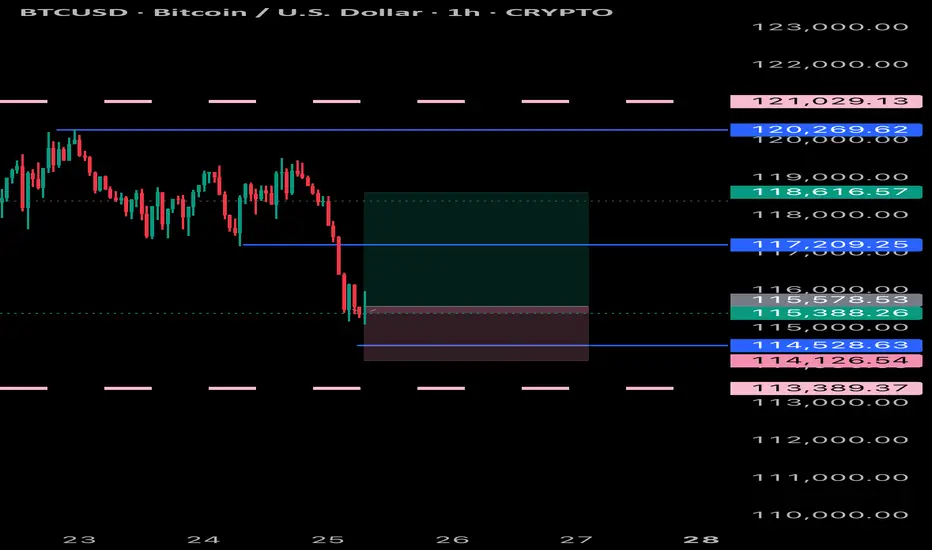
BTC SELL Setup - Big Drop Loading Below Resistance!💙 BTC/USDT Rejection Confirmed ! SELL!
👨💻 Dear traders,
After careful analysis of the recent price action on BTC/USDT (1H timeframe), here is the conclusion:
Price has entered a strong supply zone between $120,000 – $121,000, where clear signs of rejection have appeared.
Bias – Bearish
🎯 Target – $118,000
🎯 Target – $117,000
🎯 Final Target – $115,000
🛑 Safe Stop Loss – $121,200
📊 Reasoning:
– Price touched key resistance and is showing double rejection wicks
– Bearish momentum building below the red zone
– Two yellow arrows highlight expected move range (target box)
– Clear risk-to-reward with defined SL above zone
– Volume confirming slowing bullish pressure
🌟 Stay patient, follow risk management & trade safe!
🍀 WISHING YOU GREEN PIPS! 💰
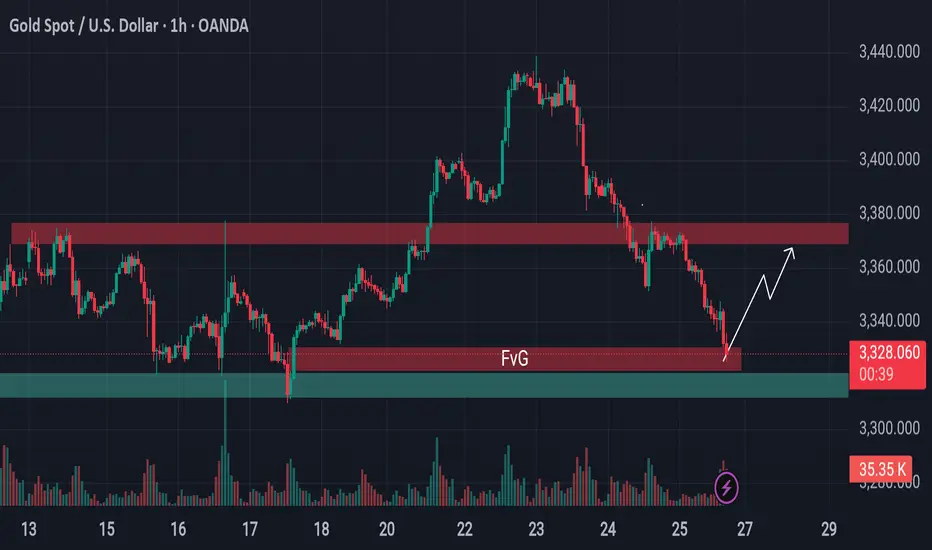
From Breakdown to Breakout? Gold Eyes Support Based Reversal!Gold is approaching a critical support area.
Previously, the price was holding above a key support level, but that zone has now been breached and is likely to act as resistance going forward. However, just beneath the current price, there's a well-established support level still intact—reinforced further by the presence of a bullish Fair Value Gap (FVG).
This setup hints at a possible reversal or a short-term surge from this zone. If market conditions align, gold may stage a pump from here. Keep this level on your radar—it could turn into a decisive point for price direction.
🛡 Always conduct your own analysis before taking any trades. DYOR.
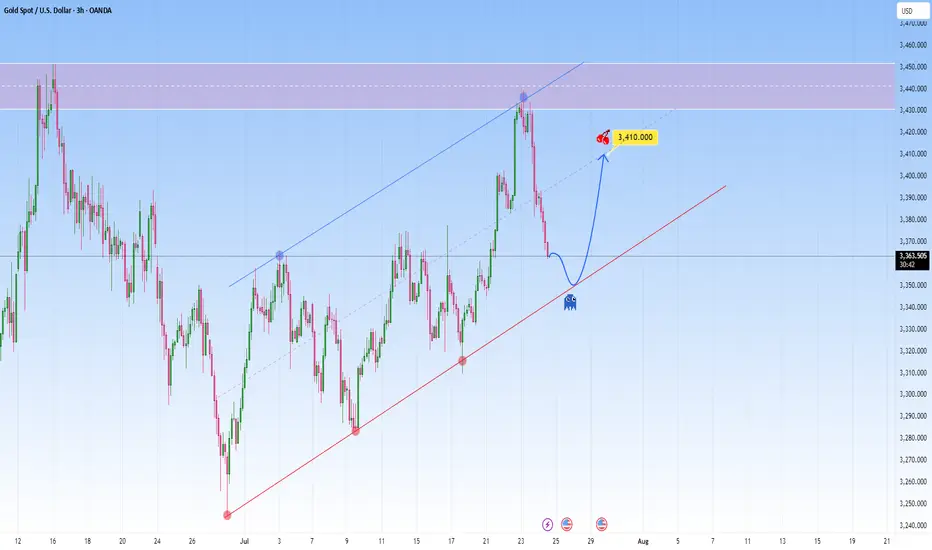
GOLD Reawakened: Corrects firmly but conditions remain bullishFrom a technical perspective Gold is climbing in a parallel channel, clearly bullish with a rhythm that’s hard to ignore. Price just bounced off the resistance with force, a classic overextension flush.
And the market is now approaching the lower boundary of this projected channel. This confluence of technical support is likely to attract renewed buying interest.
I expect it to bounce back toward 3,410, somewhere around the middle of the channel. The move up may not be determined right away. It could be consolitaing, fake dips first, or sudden acceleration.
USD/JPY Bearish Setup Activated - Short from 148.00 Zone!💙 USD/JPY Resistance Rejection ! SELL Setup Activated!
👩💻 Dear traders,
USD/JPY is reacting to a strong supply zone between 147.85 – 148.15. After a sharp bullish move, price is showing early signs of rejection from this area — signaling a possible short setup.
Bias – Bearish
🎯 Target – 147.20
🎯 Target – 146.90
🎯 Final Target – 146.30
🛑 Safe Stop Loss – 148.20
📊 Reasoning:
– Price tapped into a clear resistance zone
– Previous rejections seen around the same level
– Two yellow arrows indicate short-term downside path
– Bearish setup forming after exhaustion push
– High R:R potential for intraday traders
🍀 Stay patient, wait for confirmation, and trade the reaction!

GBPAUD: Possible bounce at supportI am watching for a possible reversal GBPAUD, expecting a rejection with a upside target at around 2.073.
This area is where it can become a decision point, either price finds support and bounces, or it breaks below, and the move can start to extend lower.
Just sharing my thoughts for the charts, this isn’t financial advice. Always confirm your setups and manage your risk properly.
Disclosure: I am part of Trade Nation's Influencer program and receive a monthly fee for using their TradingView charts in my analysis.

NAS100 steadies at high levels, pay attention nextThe most recent move on NAS100 saw a sharp drop that briefly recovered, likely triggering stops before aggressively reversing from the lower boundary of the newly projected channel. This isn't a cause for concern, on the contrary, it's another opportunity to get involved.
That is because this drop and recovery is a common behavior in strong uptrends before resuming bullish momentum.
The market is likely in the early stages of a new impulsive leg to the upside right here.
We could either have short-term consolidation or pullback, then a continuation toward the upper channel boundary or straight upwards, and with NAS100, the latter is more plausible.
My target will be at 23,300 around the upper boundary of the projected channel resistance.
In this context, the market remains bullish clearly. The most interesting aspect is the emotional flush on the last drop, trapping sellers before fueling what could be another big leg up.

GOLD XAUUSD BUY We shall be looking to scalp a bit on the gold as it has been selling for a while now and can expect a reversal as nothing sells forever in the market, so can buy a dip and expect it to push a fair amount
BTCUSD BUYING can expect a bullish move from bitcoin as it has dropped a fair amount and can extract a reversal to the up side due to being oversold
EURJPY BULLS Bullish move from Eurjpy and will keep following it, to its very top with small pullbacks coming but stay prepared can put buy stops