SUI UPDATEHello friends✌
As you can see, after a price drop, buyers were able to break the downtrend and form an ascending channel, which, given the entry of buyers, we can buy in batches with capital and risk management to move towards the specified goals.
*Trade safely with us*
Freesignals

AR/USDT : FREE SIGNALHello friends✌
You see that after the price growth we had, we entered a correction, which provided us with a good opportunity to buy📈
We have identified the buying levels and targets for you to buy...
Don't forget capital management, friends.
*Trade safely with us*

Stromm | S&P 500 & NASDAQ a RESISTANCE is NearThe S&P 500 and the Nasdaq are basically moving in lockstep right now — their structures look almost identical.
Starting with the S&P 500:
We’re currently trading into a 4-hour Fair Value Gap between $5,546 and $5,634, Sitting just under a 4-hour Order Block that could trigger a short-term reaction.
At the moment, though, it doesn’t really look like we’re going to flush all the way back down toward the $5,000 level (2-hour Order Block sitting much lower).
More likely?
This 4h Order Block just gives us a brief pullback, a minor reaction — and then price pushes higher again.
This would line up perfectly with my original scenario of Wave A completing around $4,805.
Personally, I’m already positioned around $4,800, so obviously, I'd love to see that level hold and price continue moving higher — ideally heading toward $6,000.
That would be the perfect extension — but nothing is guaranteed yet.
Still, structure right now leans bullish unless we see a sudden breakdown.
Now, for the Nasdaq CME_MINI:NQ1! :
Almost the same setup —
We have a 2-hour Order Block just above the current price, acting as short-term resistance,
And another 2-hour Order Block way lower, which now seems less likely to be tested unless something drastic happens.
So for the Nasdaq, the most realistic short-term scenario:
Hit resistance at the current 2h Order Block,
Maybe a small pullback toward 18,900–19,000,
Then continuation higher toward 20,000 or even 21,000 over the next few weeks.

Stromm | SOLANA Key Zones for Next MovesWe've seen a very solid reaction here — similar to Bitcoin, but still with its own flavor.
The Previous Monthly Low was swept and then reclaimed, which is always a strong bullish signal.
On top of that, the Monthly Open was reclaimed and successfully retested, flipping market structure back to bullish.
No doubt: the trend right now leans upward.
The big question is: where do we go from here?
When you look left on the chart, you see two massive candles:
One day, +30% straight up,
Followed by -22% the very next day.
Pure chaos.
Now, price is pushing back into that zone — and we need to watch how it reacts inside those previous candles.
For targets:
The Weekly Fair Value Gap near the Previous Monthly High is a major zone to watch.
After that, there’s the 2h Fair Value Gap around the Yearly Open — the next big magnet for price.
And it’s worth noting:
Compared to Ethereum, Solana’s Yearly Open is way closer and much more realistically within reach. Another subtle hint that SOL is showing way better relative strength.

Ethereum: The biggest Opportunity in 2025!Ethereum is following Bitcoin—but with way worse performance. While BTC is still holding up relatively well, ETH has dropped all the way back to March 2023 levels, wiping out the entire rally. Since its top, Ethereum is down over 63%. 😮💨
Still—or maybe because of that—I’m beginning to slowly scale into spot positions here.
Yes, we could fall further. I’ve got limit orders set lower, specifically around $1,260, which aligns with the 88.2% Fibonacci retracement and the midpoint of the monthly order block. That’s a key zone I’ll be watching if price keeps dropping.
That said, this Wave (2) should be nearing its final stage. The sell-off has been steep, and if we lose $804, that would flip Ethereum’s entire monthly structure bearish—a scenario I’d consider extremely negative.
I don’t expect ETH to suddenly blast past $5,000 from here, but at these levels, I see a clear opportunity to build longer-term spot exposure—and that’s exactly what I’m starting to do now.

Stromm | ETHEREUM No Life Signal YETCompared to Bitcoin, Ethereum is honestly still moving at a snail’s pace — and the performance is almost embarrassing at this point.
There’s still barely any strength showing on the CRYPTOCAP:ETH chart.
Yes, ETH has finally reclaimed the Previous Monthly Low, and it’s holding it — which is a positive step.
But let’s be real:
We’re still 83% below the Yearly Open — a mind-blowing distance when you consider how BTC is behaving right now.
I'm currently risk-free on my trade here, which is a nice position to be in.
If we get another drop, I plan to add at the next Monthly Order Block.
But something serious needs to happen at the Ethereum Foundation level — real fundamental shifts — if ETH is going to deliver the kind of rally people keep hoping for.
Otherwise?
Everything else in the market is outperforming ETH by a mile — and that’s the worst-case scenario for Ethereum:
It doesn't die,
It just gets left behind.
For now, at least I’m sitting in profit, and that's a good start.
Everything beyond this will need careful watching — no blind assumptions, no blind faith.
ETH needs to prove itself — and fast.

GOLD UPDATEHello friends✌
As you can see, after a sharp price drop, gold has entered a range that has formed a double top pattern that warns us of a continued price drop, so be careful🔊📈
*Trade safely with us*

NOTCOIN BUY...Hello friends
Everything is clear on the chart for you, our probability is price growth to the specified areas.
The purchase limits are also specified.
Be sure to observe risk and capital management.
*Trade safely with us*

XRP/USDT: BUY LIMITHello friends
Due to the price rise, you can now see that a double top pattern has formed at the price ceiling, which indicates a correction. Therefore, we have identified good support areas for you to buy in steps and with capital management and targets.
*Trade safely with us*

WLD/USDTHello friends
Given the price growth we had, the price correction has now managed to make good bottoms, which indicates the strength of the trend, so we can enter the trade.
The purchase and target points have also been identified...
Follow capital management.
*Trade safely with us*

TRUMP COIN BUY...Hello friends
Given the price growth we had, the price correction has now managed to make good bottoms, which indicates the strength of the trend, so we can enter the trade.
The purchase and target points have also been identified...
Follow capital management.
*Trade safely with us*

RENDER/USDT:BUY Hello friends
Given the price growth we had, a range has now been created in the price correction, which indicates the strength of the trend, so we can enter the trade.
The purchase and target points have also been identified...
Follow capital management.
*Trade safely with us*

PEPECOINHello friends
Considering the price growth we had, you can see that the upward channel has been broken by the price correction and now you can enter the price correction.
The purchase and target points have also been determined...
Follow capital management.
*Trade safely with us*

ETH/USDTHello friends
Given the price growth we had, it is now natural for the price to correct and we will buy in steps during the correction.
The purchase and target points have also been specified...
Follow capital management.
*Trade safely with us*

Bullish Setup on Gold: Correction hints continuation opportunityOANDA:XAUUSD is trading within a well-defined ascending channel, signaling strong bullish momentum. The price has consistently formed higher highs and higher lows, which aligns with the continuation of the uptrend. The recent pullback appears to be a healthy correction within the overall uptrend , allowing the market to potentially reset before continuing its upward trajectory within the ascending channel.
This pullback is offering a potential re-entry point for buyers, if key support levels hold. This would reinforce the bullish structure and increase the likelihood of a move toward the 3,680 price, which aligns with the channel’s upper boundary.
As long as the price remains above the support zone, the bullish outlook stays intact. However, a failure to hold above this level could invalidate the bullish scenario and increase the likelihood of a pullback toward the channel’s lower boundary.

CHZ 50x plus tradeTraders,
Here we are again pointing out an amazing trade idea for you, the solicitors 👧🏿 and dealers 🙍🏿♂️who will likely end up transacting all of your winnings with! CHZ a great wagering project that will make you a killing this run. This one is cut and dry, we have a wedge pattern along with a possible flag that will likely play our by the end of this year!
We hope you enjoy the free trades that we have been sharing from the VIP group and look forward to seeing you enjoy these gains year round if you come check us out!
As always, stay profitable folks!
Savvy!

XRP break 2.24 bullish, is not, as low as $1.28Traders,
I have to make this quick I was bit by a brown recluse and put it off for a day or two longer than I should have. So I need to Skedaddle to the hospital super quick and fast!
Ok, here’s how I see it. I’m going to post this as a short to mid term trade but explain the long term possibilities. Considering this post is being done via my Moble rather than PC it just doesn’t make sense with my time and options.
so here’s what you’re gonna get the short term trade which I’ve labeled very clearly on the chart and the larger timeframe includes an Elliot wave analysis being that we clearly have a zigzagging consolidation wave that could do one of two things from here if we break about $2.24 we should be starting the next expansion wave. I will do an update if we do do that on this published trade to give an idea of where the price action could go but my immediate thoughts range from $9 to $27.
However, I want everybody to be cautious of a fake out as we are seemingly getting bullish on the weekend which I will be checking liquidity on all of the major alt coins and bitcoin before the weekend is over on our VIP live trading class that we do at 7 o’clock on Sunday night Eastern standard time. Yet, I will share my findings of the liquidity with everyone for this week only. As we definitely want to help as many newcomers and experience, traders, see manipulation, just in case it shows up before it plays out. There are many tools on trading view to find high buildup of large liquidity that the market makers could sweep down and take out if during this weekend we get really bullish And tons of money comes into the market from people’s tax returns, creating a pool of guppies that the market maker may just eat up one more time.
Which brings me to my thought of us potentially revisiting the .65 fib, the .618 or even all the way down to the .5 fib, which is at around $1.23. Nothing in trading is 100% so take my thoughts and stride. yet, I’ve been through three bull runs as a successful trader and market manipulation has been one of my main focuses purchasing mini subscriptions to different tools that give me information so we can take advantage of what the market maker does as opposed to be part of its liquidity grab.
For everyone reading this in the VIP group as you know normal time on Sunday, we will be having the recorded Zoom meeting, but I highly suggest that you make it because this is going one of two ways and there’s a big opportunity here to make some pretty serious pips in my opinion. If you’re not part of our group, I hope you use this information wisely in your research to come up with your decisions, but keep in mind, we are all just here for entertainment purposes! Following every single word from a trader online should never be your gospel to put tons of your money into the market in which ever way that trader is preaching the market will go. Learn risk management, if you don’t feel confident in the research that you’re doing or the traders that you are following are pointing at different directions just make sure you know why they’re pointing in that directions as it could quickly go both ways as we’ve seen recently. With that being said also know that the market maker always goes for liquidity point blank and simple! This is why the majority of traders are unsuccessful in this game because the easy information to learn online for free teaches you stuff that large trading firms have algorithms to find And come sweep in your losses to their profits.
I can’t necessarily say that the exchanges are our biggest worry, but it’s always made me believe most likely they are considering most of these exchanges are also trading as market makers, probably some insider trading with alot of them. The current element of little laws and wishy washy regulation (as much as it will likely stunt this bull run for a few months, or maybe not… being that Trump has given US regulating agencies 180 days from January to have firm regs in place) albeit, Some that are reading this, I’m sure take advantage of it yet, once it’s set in place we will have a little less wild, wild West and less decent traders in traditional markets who hate crypto because of the manipulation and the rug poles and what not will and I’m just guessing here most likely have a clear path to becoming a more profitable trade.
I’m not here to demonize exchanges just keep in mind they have all of the information that you have Placed on their exchange and given them freely by checking off the terms of service and signing up for your account. Lots of these exchanges still have very little regulation and trust you, Me that they are raking in as much as they possibly can to the extent of the little regulation in the country, they are regulated in if they are even bound to abiding by it, as I’m sure, as we know, some folks have already been arrested and indicted for certain things that I will leave for you to search and find on your own. But, my point being is you need to also be very careful of the exchanges that you choose.
In my best opinion, the exchanges with the most amount of liquidity on them makes it more difficult for manipulation to happen yet, it sure still does!
As always friends, stay profitable and I hope this rant that I just went on, helps you in someway over this Easter weekend and I pray you all have an amazing time with your families and if not, then have an amazing time trading and I hope my words have helped!
Stay Profitable,
Savvy

Nokia:Inverted Head and Shoulders Structure + Retest of BreakoutOn the weekly chart of Nokia, a classic Inverted Head and Shoulders reversal pattern has formed. The breakout above the neckline occurred with increased volume, confirming the strength of the move. Currently, the price is undergoing a standard technical retest of the neckline from above — a typical phase before a potential continuation higher.
The structure remains active: the projected height (H) points to an initial target at $5.48, based on the distance from the neckline to the head. If momentum continues, Fibonacci extension targets are located at $6.18 (1.272), $6.55 (1.414), and $7.08 (1.618).
Technical view: the retest of the neckline is happening on declining volume, strengthening the probability of a bullish reversal. EMA 50/100/200 are beginning to align in a bullish crossover. The ascending channel structure also supports the upward movement.
Fundamentals: Nokia is progressing with its strategic programs in 5G and upcoming 6G network technologies, reinforcing its long-term growth prospects. Improved financial performance and the recovery in demand for telecommunications infrastructure amid global digitalization trends continue to support investor interest in the stock.
The Inverted Head and Shoulders pattern is confirmed by the breakout and current retest. As long as the price holds above the neckline, the bullish scenario toward $5.48 and beyond remains intact. This is a medium-term trend reversal structure — strong setups like this form the foundation for major moves. Don’t miss them.

Tesla: At a Crossroads – Accumulation or Breakdown?One of the most talked-about stocks right now — Tesla NASDAQ:TSLA . And for good reason. Between the constant media buzz around Elon Musk and the recent surge in vandalism against Tesla vehicles, it’s been getting plenty of attention. But I’m not here to talk politics or headlines — I’m here for the chart.
And honestly? It’s looking better than you’d think. Despite all the noise, price has held steady in the $225 to $270 range, showing signs of a sideways accumulation phase — right at the Point of Control (POC) since 2021. That’s a pretty strong area, technically speaking.
Over the next few weeks, we’re likely to get clarity:
Either we break above $350, which opens up serious upside potential,
Or we break down toward the Volume Area Low — specifically the 2024 VAL at $161.18.
The real danger zone? Below $138. If price breaks that level, we have to assume that Wave 2 isn’t done yet — even though it was originally considered complete in 2023.
Until then, the structure actually looks constructive: we’ve been putting in higher lows and higher highs since 2023, which signals a potential uptrend.
How far that uptrend goes is hard to call. But if we break and hold above $325, then a pullback toward $300–$270 could offer a clean entry opportunity.
On the flip side, yes — if the market collapses and Wave II is still unfolding, we could be staring at $175, $125, or even as low as $75–$50 in an extreme scenario. And that would be wild for a stock that once touched $485.
But that’s why it’s crucial to zoom out. Ask yourself:
What do I want from Tesla — long-term conviction or short-term plays?
Then build your view. If the macro fits, dial into the lower time frames to find your edge. The setup is building — and it’s looking like Tesla is prepping for a big move.
Question is: which direction are you positioned for?

NZD_CAD RESISTANCE AHEAD|SHORT|
✅NZD_CAD is going up to retest
A horizontal resistance of 0.8350
Which makes me locally bearish biased
And I think that we will see a pullback
And a move down from the level
Towards the target below at 0.8275
SHORT🔥
✅Like and subscribe to never miss a new idea!✅
Disclosure: I am part of Trade Nation's Influencer program and receive a monthly fee for using their TradingView charts in my analysis.

APT BUYHello friends
Due to the price increase, you can now see that the price is correcting, so we have identified good support levels for you to buy in steps and with capital management and targets.
*Trade safely with us*

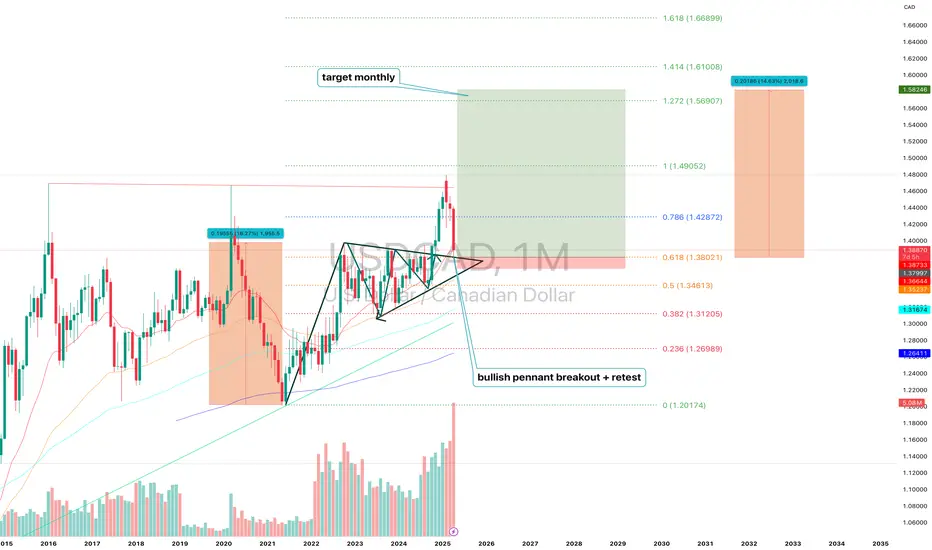
USDCAD (1M) Bullish Pennant Structure and H ProjectionUSDCAD (1M) — Technical and Fundamental Analysis: Bullish Pennant Structure and H Projection
On the monthly chart of USDCAD, a bullish pennant structure has been formed and confirmed with a breakout followed by a clean retest of the upper boundary. The price broke out of the consolidation zone with momentum and is currently holding above the key support at 1.3802. The structure remains active: the first target based on the projected move is 1.4905. If the impulse continues and the market structure remains intact, extended targets lie at 1.5690 (1.272), 1.6100 (1.414), and 1.6689 (1.618) Fibonacci expansions. Technically, the 1.3802 level (0.618 retracement) is the critical support. If this zone holds, the bullish scenario remains valid. The nearest resistance is 1.4287 (0.786), and a confirmed break above this level would likely trigger the next phase toward 1.49. Volume increased during the breakout, confirming strong buyer interest.
Fundamentally, the setup is supported by diverging monetary policies: the Bank of Canada has signaled a more dovish stance due to slowing inflation and economic softness, while the Federal Reserve remains more neutral and cautious about rate cuts. In addition, oil prices — a key factor for the Canadian dollar — are under pressure, weakening the CAD further. Broader macro uncertainty and the global demand for USD as a reserve and safe-haven asset continue to support the dollar, strengthening the USDCAD pair.
Conclusion: As long as the price holds above the 1.38 zone and confirms above 1.4287, the bullish structure remains in play with a target of 1.4905 and potential extensions to 1.5690–1.6100.
CRV/USDT : BUY...Hello friends
Due to the good price growth, you can now buy in the specified areas in stages and with capital management and move to the specified goals.
*Trade safely with us*
