Freesignals
PI UPDATEHello friends
According to the triangle pattern that the price has formed, you can see that we had a decline and after that the price has managed to create a small ascending channel that indicates the inflow of money and we can expect the price to grow to the ceiling of the channel within the channel itself and in case of failure in the lower ranges, other buying steps have been identified.
*Trade safely with us*
GOLD UPDATEHello friends
As you can see in the picture, everything is clearly defined.
After a strong rise, we see a double top pattern at the top of the channel, which indicates that we should gradually wait for a correction.
Now, how far will the correction continue? In the picture, we have identified the support levels that the price can reach.
*Trade safely with us*
GOLD Trending Higher - Can buyers push toward 3,500$?OANDA:XAUUSD is trading within a clear ascending channel, with price action consistently respecting both the upper and lower boundaries. The recent bullish momentum indicates that buyers are in control, suggesting there's chances for potential continuation on the upside.
The price has recently broken above a key resistance zone and may come back for a retest. If this level holds as support, it would reinforce the bullish structure and increase the likelihood of a move toward the 3,500 target , which aligns with the channel’s upper boundary.
As long as the price remains above this support zone, the bullish outlook stays intact. However, a failure to hold above this level could invalidate the bullish scenario and increase the likelihood of a pullback toward the channel’s lower boundary.
The recent surge in gold prices is driven by escalating U.S.-China trade tensions and a weakening U.S. dollar. Gold reached a record high of $3,390 per ounce, fueled by concerns over global economic stability and increased demand for safe-haven assets. Analysts have raised their three-month gold forecast, due to ongoing market uncertainties.
Despite the upward momentum, I think still gold may be overbought in the near term, indicating potential for a short-term correction . Nevertheless, the overall bullish trend remains strong, supported by geopolitical tensions, central bank purchases, and investor demand for strong assets.
XAUUSD buy opportunity targeting 3400XAUUSD buy opportunity targeting 3400
1. A golden opportunity emerges as XAUUSD eyes a bullish breakout.
2. Current market dynamics strongly favor long positions in gold.
3. Investor sentiment shifts amid global economic uncertainties.
4. Safe-haven demand fuels upward momentum in precious metals.
5. Technical indicators signal strong support and bullish continuation.
6. The 3400 target aligns with historical resistance and Fibonacci extensions.
7. Central bank policies and inflation concerns bolster gold's appeal.
8. Volatility in fiat currencies drives capital toward tangible assets.
9. Momentum traders are positioning early ahead of the breakout.
10. A strategic buy now could yield significant returns as gold ascends.
FHN: Bearish retest after channel break – more downside ahead?First Horizon Corporation is a regional U.S. banking company offering commercial, mortgage, and investment services. It operates mainly across the southern United States and is among the largest regional banks in its sector.
Technical Analysis:
FHN recently broke down from a long-term ascending channel and is now retesting the lower boundary as resistance. Price stalled near 18.65 with weakening bullish momentum. RSI is trending lower and volume on retest is soft. Key downside levels: 15.00, 13.50, and possibly 10.24 if weakness continues.
Fundamentals:
FHN faces headwinds from tightening monetary policy, rising credit costs, and profitability pressures. Regional banks are under investor scrutiny following sector instability. Latest earnings report showed declining margins and weaker guidance.
Scenarios:
Bearish bias – rejection at 18.65 → drop toward 15.00 → 13.50 → 10.24
Bullish reversal – break back above 18.65 → re-entry into channel toward 21.00+
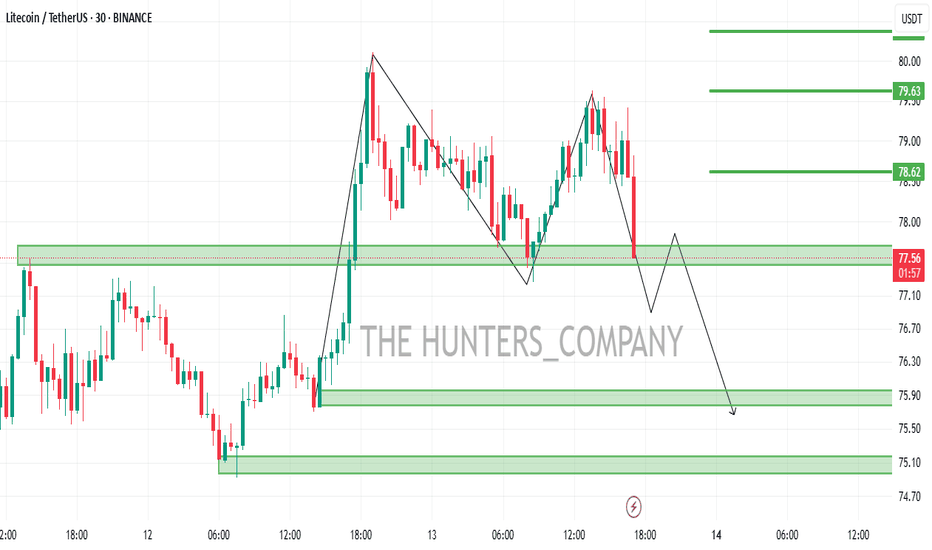
LTC/USDT:BUYHello friends
Due to the good price growth, we see that the price has hit a lower ceiling and has fallen, which we can buy in stages during the price decline, within the specified ranges and move with it to the specified targets.
Observe capital and risk management.
*Trade safely with us*
APT/USDT:BUYHello friends
Given the good price growth, we see that the price is in an ascending channel and has fallen, we can buy in a stepwise manner in the price decline within the specified ranges and move with it to the specified targets.
Observe capital and risk management.
*Trade safely with us*
AVAX/USDT:BUYHello friends
Given the good price growth, we see that the price has not managed to reach a higher ceiling and has fallen, so we can buy in stages during the price decline within the specified ranges and move with it to the specified targets.
Observe capital and risk management.
*Trade safely with us*
GOLD Trending Higher - Can buyers push toward 3,300$?OANDA:XAUUSD is trading within a well-defined ascending channel, with price action consistently respecting both the upper and lower boundaries. The recent bullish momentum indicates that buyers are in control, suggesting a potential continuation.
The price has recently broken above a key resistance zone and may come back for a retest. If this level holds as support, it would reinforce the bullish structure and increase the likelihood of a move toward the 3,300 target , which aligns with the channel’s upper boundary.
As long as the price remains above this support zone, the bullish outlook stays intact. However, a failure to hold above this level could invalidate the bullish scenario and increase the likelihood of a pullback toward the channel’s lower boundary.
Remember, always confirm your setups and use proper risk management.
Gold hovers at the All-Time High (ATH)Gold Analysis Update:
As Gold hovers at the All-Time High (ATH), it's crucial to observe how the market behaves during the London session, which is known for its high liquidity and volatility. After taking the Asian session high, the price action is now poised to potentially revisit the marked Fair Value Gap (FVG) zone.
If the market retraces to this zone and provides a bullish confirmation, such as a strong bullish candlestick pattern or a break above a key resistance level, it could set the stage for a beautiful buy-side trade setup. This would potentially offer a lucrative trading opportunity for those looking to capitalize on the ongoing bullish trend.
Let's closely monitor the price action and wait for the market to provide a clear signal before making any trading decisions.
PI/USDT:SIGNALHello friends
Given the price growth, you can see that we had a stop and a triangle pattern was formed, which is a continuation pattern of the trend.
Now, given the complex market conditions, our suggestion to you is to buy in stages and be sure to observe risk and capital management.
I have also specified goals for you.
*Trade safely with us*
OM/USDT: what happened?Hello friends
Due to the heavy price drop, many holders of this currency fell into extreme fear, but according to the price chart, you can see that after this stunning growth, the price correction should finally happen.
Now, if you are risk-averse, you can buy in steps within the specified support areas and move with it to the specified targets, of course, with capital and risk management.
*Trade safely with us*
gold (update)Hello friends
Due to the price growth, we have given you the analysis that the price will fall and the same thing happened. Now, due to the sharp decline, the price has entered the channel and the 3 specified areas are important support areas for us, where we can buy with risk and capital management and move towards the specified goals.
*Trade safely with us*
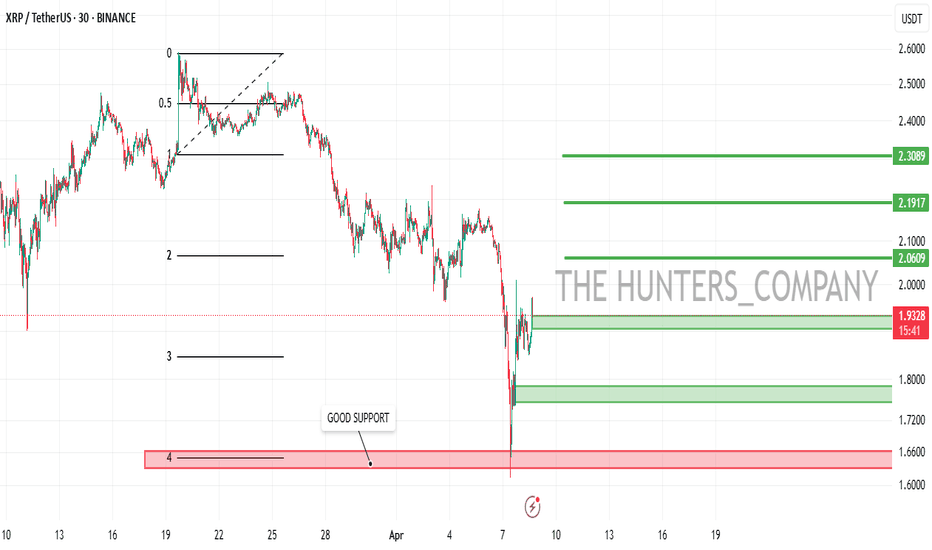
XRP/USDT:BUY LIMITHello friends
Due to the price drop, we have reached a good support area, which you can see is supported by good buyers.
Now we can buy in stages and with capital management in the specified areas and move to the specified targets.
Always buy in fear and sell in greed.
*Trade safely with us*


