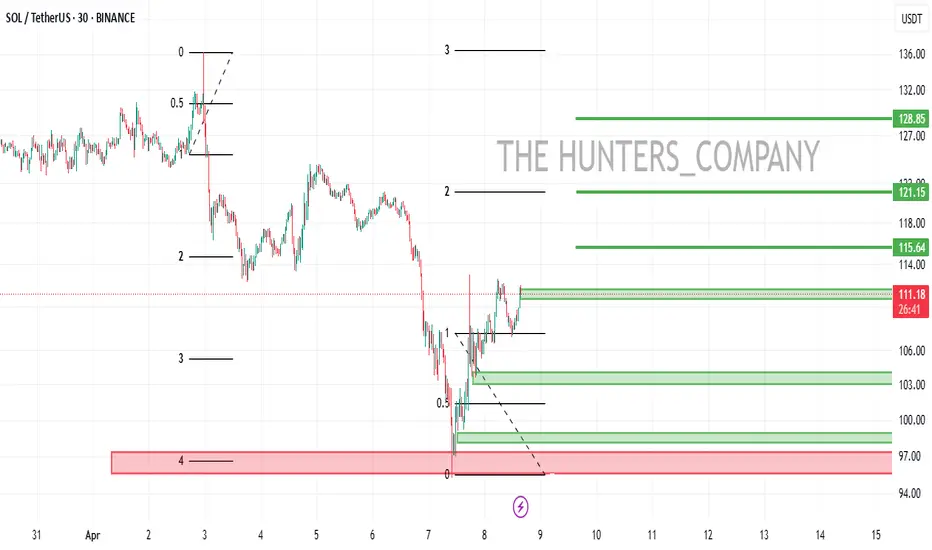
SOL/USDT:BUY...Hello friends
Due to the heavy price drop we had, the market fell into fear and at the specified support, buyers supported the price, which is a good sign that we should buy within the support ranges with capital and risk management and move with it to the specified targets.
Always buy in fear and sell in greed.
*Trade safely with us*
Freesignals
EHT/USDT:BUY...Hello friends
Due to the heavy price drop we had, the market fell into fear and at the specified support, buyers supported the price, which is a good sign that we should buy within the support ranges with capital management and move with it to the specified targets.
(Always buy in fear and sell in greed)
*Trade safely with us*

GBP/USDHello friends
According to the trend and price drop, we see that a flag pattern has formed, which we can enter into a trade with capital and risk management.
*Trade safely with us*

US DOLLAR at Key Support: Will Price Rebound to 103.000TVC:DXY is currently approaching an important support zone, an area where the price has previously shown bullish reactions. This level aligns closely with the psychological $100 , which tends to have strong market attention.
The recent momentum suggests that buyers could step in and drive the price higher. A bullish confirmation, such as a strong rejection pattern, bullish engulfing candles, or long lower wicks, would increase the probability of a bounce from this level. If I'm right and buyers regain control, the price could move toward the 103.00 level.
However, a breakout below this support would invalidate the bullish outlook, potentially leading to more even more downside.
This is not financial advice!

GOLD (XAUUSD) – 4H Technical AnalysisAfter a sharp drop and rebound, gold is now testing the 50% Fibonacci level around 3122. The key resistance zone lies between 3163–3167, where a breakout could open the path to 3218 (0.786 Fibo).
🔹 Resistance levels:
• 3163 – 0.618 retracement
• 3167 – previous swing high
• 3218 – 0.786 level & target
🔹 Main Scenario:
Breakout above 3163 leads toward 3218 continuation.
🔹 Alternative Scenario:
Rejection at 3163 → retrace to 3082 or 3033 before next move.
Momentum indicators are bullish but approaching overbought territory.

EURCAD: Bullish Move From Support Confirmed 🇪🇺🇨🇦
EURCAD may continue growing after a strong bullish
reaction to a key daily support.
The market was accumulating for some time on that
within the intraday horizontal range.
Its resistance was broken with both 4H/1H candles.
Next goal - 1.5592
❤️Please, support my work with like, thank you!❤️
I am part of Trade Nation's Influencer program and receive a monthly fee for using their TradingView charts in my analysis.

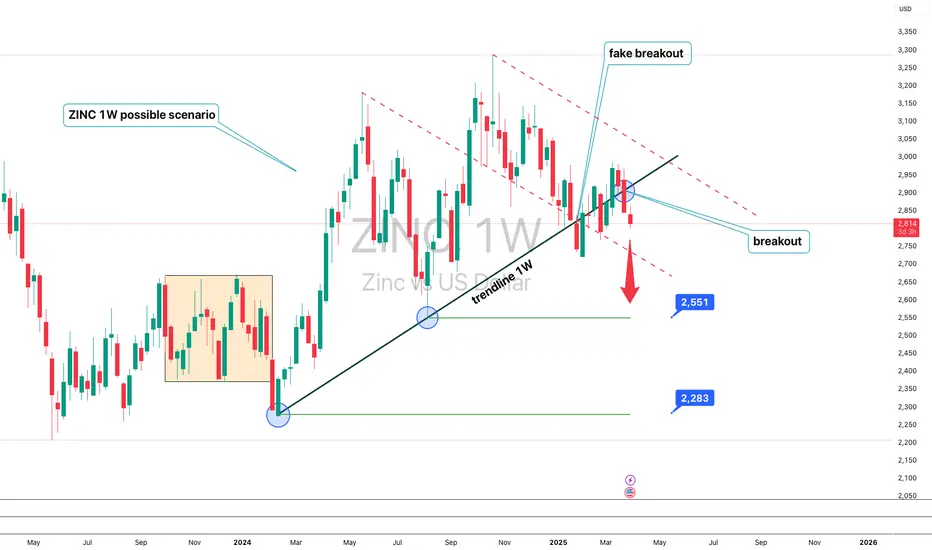
Zinc (ZINC) – Technical Analysis 1WThe price has broken below the 1W trendline, confirming a bearish scenario. After a fake breakout, the price moved downward and is now targeting 2551 and 2283. A breakdown below these levels could accelerate the decline. RSI shows weakening momentum, MACD signals a bearish crossover, and EMA 50/200 suggest further downside. Fundamentally, zinc prices depend on industrial demand, macroeconomic conditions, and USD strength. The main scenario is a drop to 2551 and 2283, while a recovery above 2900 could push prices toward 3100.
NZDCAD: Bullish Move From Support 🇳🇿🇨🇦
There is a high chance that NZDCAD will go up from the underlined support.
As a confirmation, I spotted a cup and handle pattern on an hourly chart.
Goal - 0.792
❤️Please, support my work with like, thank you!❤️
I am part of Trade Nation's Influencer program and receive a monthly fee for using their TradingView charts in my analysis.

EURNZD - at major Resistance: Will it drop to 1.9000?OANDA:EURNZD reached a major resistance level that has previously acted as a strong barrier, triggering some strong bearish momentum. This zone can be a potential point of interest for those looking for short opportunities. Given its historical significance, how price reacts here could set the tone for the next move.
If bearish signals emerge, such as rejection wicks, bearish candlestick patterns, or signs of weakening bullish pressure, I anticipate a move toward the 1.9000 level . However, a clear breakout above this resistance could challenge the bearish outlook and mean further upside. It's a pivotal area where price action will likely provide clearer clues on the next direction.
Just my take on support and resistance zones, not financial advice. Always confirm your setups and trade with a proper risk management.

NZDJPY - Potential bounce to 85.300 from SupportOANDA:NZDJPY has reached a major support level, an area where buyers have previously shown strong interest. This zone has acted as a key zone, increasing the likelihood of a bounce if buyers step in.
A bullish confirmation, such as a strong rejection pattern, bullish engulfing candles, or long lower wicks, would strengthen the case for a move higher. If buyers take control, the price could bounce toward the 85.300 target. However, a decisive breakdown below this support would invalidate the bullish scenario and could lead to further downside.
This isn’t financial advice, just my take on how I approach support and resistance zones. Best to wait for clear confirmation, like a strong rejection or a volume spike, before making a move.
Every trader has a unique perspective. Let’s discuss this setup within the TradingView community!

TONUSDTHello friends
Due to the price drop, we reached a good support area where good buyers supported the price.
Now we can buy in steps and with capital management in the specified support areas and move to the specified targets.
Always buy in fear and sell in greed.
*Trade safely with us*

TRUMPHello friends
Due to the price drop, we reached a good support area where good buyers supported the price.
Now we can buy in steps and with capital management in the specified support areas and move to the specified targets.
Always buy in fear and sell in greed.
*Trade safely with us*

NOT/USDT:WHAT DO YOU THINK!Hello friends
The TON ecosystem has a lot of potential and gives good profits.
Due to the price drop, we have reached a good support area, which is also the bottom of the channel. Now we can buy in stages and with capital management and move to the specified goals.
Always buy in fear and sell in greed.
*Trade safely with us*

Tesla: bounce expected at $200 Support?NASDAQ:TSLA is currently approaching an important support zone, an area where the price has previously shown bullish reactions. This level aligns closely with the psychological $200 mark, which tends to carry added weight in the market .
The recent momentum suggests that buyers could step in and drive the price higher. A bullish confirmation, such as a strong rejection pattern, bullish engulfing candles, or long lower wicks, would increase the probability of a bounce from this level. If I'm right and buyers regain control, the price could move toward the 260.00 level.
However, a breakout below this support would invalidate the bullish outlook, potentially leading to more downside.
This is not financial advice but rather how I approach support/resistance zones. Remember, always wait for confirmation, like a rejection candle or volume spike before jumping in.

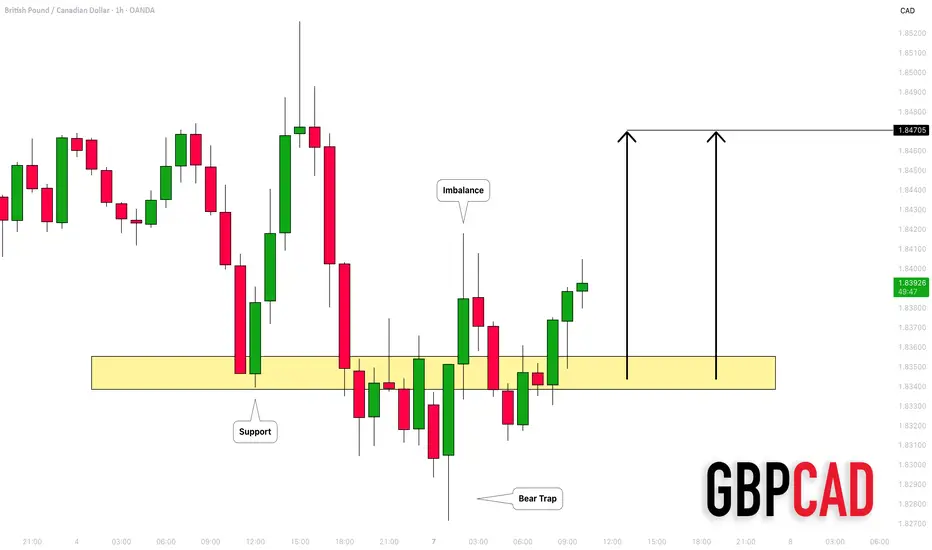
GBPCAD: Buying After the Trap 🇬🇧🇨🇦
I think that there is a high chance that GBPCAD will go up.
As a confirmation, I see a confirmed bearish trump
followed by a strong bullish imbalance.
I expect up move to 1.847
❤️Please, support my work with like, thank you!❤️
PEPE/USDT:FREE SIGNALHello dear friends
Given the price drop we had in the specified support range, a double bottom pattern has formed, indicating the entry of buyers.
Now, given the good support of buyers for the price, we can buy in steps with capital and risk management and move to the specified targets.
*Trade safely with us*

ETH/USDT:UPDATEHello dear friends
Given the price drop we had, a head and shoulders pattern has formed within the specified support range, indicating the entry of buyers.
Now, given the good support of buyers for the price, we can buy in steps with capital and risk management and move towards the specified targets.
*Trade safely with us*

DOGE/USDT:BUY...Hello dear friends
Given the price drop we had in the specified support range, considering the price growth indicates the entry of buyers.
Now, given the good support of buyers for the price, we can buy in steps with capital and risk management and move towards the specified goals.
*Trade safely with us*

SEI/USDT:BUY LIMITHello dear friends
Given the price drop we had in the specified support range, the price has been able to create higher ceilings and floors.
Now, given the good support of buyers for the price, we can buy in steps with capital and risk management and move towards the specified goals.
*Trade safely with us*

CRV/USDT: BUYHello dear friends
Due to the good price growth
Now we can buy in stages with capital and risk management and move towards the specified goals.
*Trade safely with us*

US500 CHANNELHello friends
Given that the price is in an ascending channel, now that we have a strong wave to the channel ceiling, we have corrected the price by 50%, after which we can expect the price to succeed in hitting a higher ceiling again.
*Trade safely with us*

NZDJPY: Pullback From Support 🇳🇿🇯🇵
There is a high chance that NZDJPY will pull back from support.
As a confirmation, I see a double bottom pattern on an hourly time frame
and a breakout of its neckline.
Goals: 85.30 / 85.58
❤️Please, support my work with like, thank you!❤️
I am part of Trade Nation's Influencer program and receive a monthly fee for using their TradingView charts in my analysis.

Vet 3x-9x leverage 5% allocationHello traders,
Here is a free sample VIP trade we offer every Wednesday. Profit targets listed by the green horizontal line.
Enjoy
