USOIL BUY!!!hello friends
As you can see, this chart is very, very patternable.
Now, with the floor construction that we expect from it, the growth to the resistance areas has been determined.
*Trade safely with us*
Freesignals

NZDCAD: Pullback Trade Confirmed?! 🇳🇿🇨🇦
NZDCAD may bounce from the underlined key support.
As a confirmation signal, I see a nice bullish Change of Character CHoCH
on an hourly time frame after its text.
Target - 0.8185
❤️Please, support my work with like, thank you!❤️

GOLD UPCOMING TREND READ IN CAPTIONThis 4-hour chart of Gold (XAU/USD) shows a recent pullback from the resistance level at 2,920.364, with a key support zone around2,847.153, highlighted as a buy zone. Fibonacci retracement levels are also shown, with the price currently testing the 0.382 level at 2,871.969. The chart suggests a potential retest in the area between2,887.470 and $2,890.000 before a possible bounce toward higher resistance levels. The breakout above the recent high could lead to further gains, but a pullback toward support levels is expected first

AUD_JPY SWING LONG|
✅AUD_JPY has been falling recently
And the pair seems locally oversold
So as the pair is approaching a horizontal support of 93.500
Price growth is to be expected
LONG🚀
✅Like and subscribe to never miss a new idea!✅

EUR-JPY Long From Support! Buy!
Hello,Traders!
EUR-JPY is trading in a
Strong downtrend but
A horizontal support
Level is ahead so after
A retest we will be expecting
A local bullish move up
Buy!
Comment and subscribe to help us grow!
Check out other forecasts below too!

CADJPY - Potential buying opportunity in sightOANDA:CADJPY is trading near a clear support level that triggered bullish reversals in the past. The recent bearish move into this area creates a potential opportunity for buyers to regain control.
If bullish confirmation appears, such as increased buying volume or candlestick reversal patterns, I expect the price to move toward 105.550. On the other hand though, a break below this support would weaken the bullish scenario and suggest further downside.
Just my take on support and resistance zones—not financial advice.
Best of luck in the markets.

PI Network token purchase pointshello friends
Due to the good growth of this token, now in case of correction, we can buy step by step within the specified limits and move with it to the specified goals.
*Trade safely with us*

XAUUSD SIGNAL 26/02/2025🚨 Attention Traders! 🚨
🟡 Gold is in a no-trade zone! 🛑 Stay patient as we monitor key levels.
📊 Critical Zone: 2915 - 2927 (Support & Resistance)
🔻 Bearish Breakout? If the price drops below 2915, we’ll target:
🎯 TP1 = 2907, TP2= 2895
🔺 Bullish Breakout? A move above 2927 signals upward momentum:
🎯 TP1 = 2942
🔥 Stay sharp & trade wisely! 💰📈

GBP_CAD RESISTANCE AHEAD|SHORT|
✅GBP_CAD has been growing recently
And the pair seems locally overbought
So as the pair is approaching a horizontal resistance of 1.8233
Price decline is to be expected
SHORT🔥
✅Like and subscribe to never miss a new idea!✅

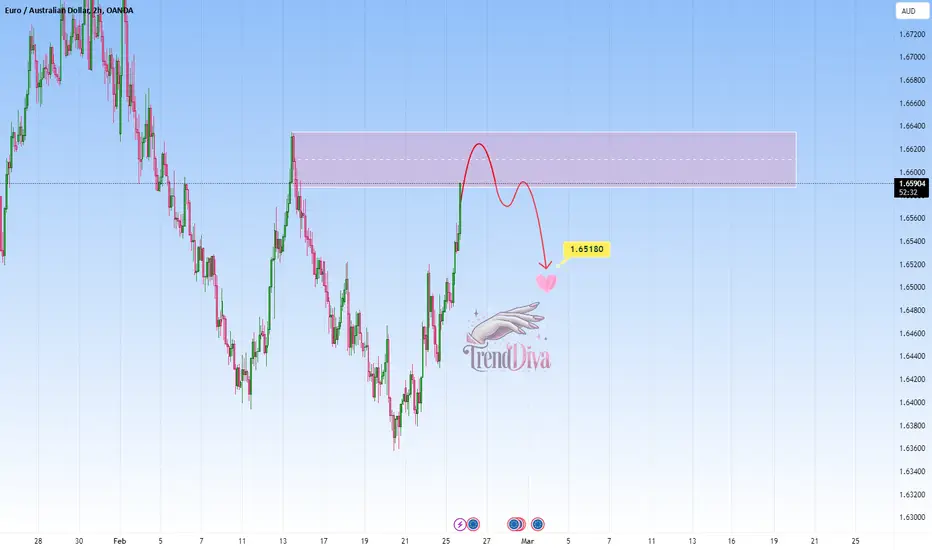
EURAUD - Short Setup at Key ResistanceOANDA:EURAUD is approaching a significant resistance area that has before reversed bullish trends. The current upward move into this zone suggests potential selling opportunities if rejection signals appear, such as bearish engulfing candles or upper wicks.
I find that a move toward 1.65180 is likely.
A break above this resistance, however, could indicate a shift in market sentiment.
Just my take on support and resistance zones—not financial advice.
Always confirm your setups and trade with solid risk management.
AUD_USD LONG FROM SUPPORT|
✅AUD_USD will soon retest a key support level of 0.6320
So I think that the pair will make a rebound
And go up to retest the supply level above at 0.6380
LONG🚀
✅Like and subscribe to never miss a new idea!✅

GOLD Bullish Bias! Buy!
Hello,Traders!
GOLD is making a bullish
Rebound from the support
Cluster of rising and horizontal
Support levels so as Gold is
Trading in an uptrend we are bullish
Biased and we will be expecting
A further bullish move up
Buy!
Comment and subscribe to help us grow!
Check out other forecasts below too!

GOLD GROWTH AHEAD|LONG|
✅GOLD is trading in an
Uptrend along the rising
Support and we are already
Seeing a bullish rebound
So we will be expecting
A further bullish move up
LONG🚀
✅Like and subscribe to never miss a new idea!✅

BITCOIN : Important support for the price of the last hope!hello friends
With Bit analysis, we have two scenarios:
1_ The price will return to the important support of 92 thousand dollars or even 90 thousand dollars and from there I will see the growth of the new wave of bit.
2- The important support price should break and continue to fall, and within the specified range with confirmation, we can enter a new upward wave.
What do you think? Will important support be lost?
In our opinion, due to the continuation of the trend and because the volume of sales has not happened, the first scenario is more likely and its target is 115-120 thousand dollars.
*Trade safely with us*

GBPUSD: Short Setup at Key ResistanceOANDA:GBPUSD is nearing a key supply zone that has been a critical area for bearish reversals in the past. The current price action suggests sellers may regain control at this resistance level.
If bearish patterns appear, such as long upper wicks or bearish engulfing candles, I anticipate a move toward 1.25890.
However, if the price successfully breaks and holds above the zone, this would invalidate the bearish outlook and might indicate further upside.
Proper risk management is essential, given the possibility of price breaking higher.
Just my take on support and resistance zones—not financial advice. Always confirm your setups and trade with solid risk management!

CHFJPY: Pullback From Support 🇨🇭🇯🇵
CHFJPY looks bullish after a test of a key horizontal support.
As a confirmation, I identified a double bottom pattern
on an hourly.
Its neckline was violated with the market opening today.
I believe that the pair will continue rising at least to 167.0 level.
❤️Please, support my work with like, thank you!❤️

SPY Bearish Breakout! Sell!
Hello,Traders!
SPY was trading in an
Uptrend but then the index
Made a bearish breakout
From the bearish wedge
Pattern and we are locally
Bearish biased and we will
Be expecting a local
Bearish move down
Sell!
Comment and subscribe to help us grow!
Check out other forecasts below too!

USD_CAD RISKY LONG|
✅USD_CAD has retested a key support level of 1.4150
And as the pair is already making a bullish rebound
A move up to retest the supply level above at 1.4300 is likely
LONG🚀
✅Like and subscribe to never miss a new idea!✅

USD-JPY Will Grow! Buy!
Hello,Traders!
USD-JPY has almost
Reached a horizontal
Support level of 148.530
After trading in a strong
Downtrend for some time
So a local bullish correction
Is to be expected with the
Aim of retesting the
Target level above at 149.665
Buy!
Comment and subscribe to help us grow!
Check out other forecasts below too!

CHF/JPY Analysis | Potential Reversal or Continuation ? CHF/JPY Technical Analysis & Forecast
📉 Market Overview: Swiss Franc / Japanese Yen (CHF/JPY) – 4H Chart : The pair is currently trading within a well-defined descending channel, signaling a sustained bearish trend. The price action has consistently followed a lower high and lower low structure, confirming the prevailing downtrend.
However, recent price movements suggest potential signs of reversal as the pair approaches a key support zone. Let’s dive into the details.
🔍 Key Technical Highlights:
✅ Descending Channel: The market has been respecting a downward sloping trendline, indicating ongoing bearish pressure.
✅ Major Support Zone: The pair has tested a crucial quarter fulfillment level, a historically strong support area.
✅ Double Bottom Formation: A potential reversal pattern is forming, hinting at a possible upward move.
✅ 50 EMA Acting as Dynamic Resistance: The price remains below the 50-period Exponential Moving Average, a key level to watch for bullish confirmation.
✅ Resistance Levels: The 169.000 (50% Fib) and 172.000 (75% Fib) levels are the next upside targets if buyers gain control.
📊 Prediction & Outlook:
🔹 Bullish Scenario: A successful break above dynamic support/resistance and the 50 EMA could trigger a bullish move toward 169.000 and potentially 172.000.
🔹 Bearish Scenario: Failure to hold the current support could see the pair continue its downward trajectory within the channel, with potential targets around 163.250.
🔹 Key Confirmation Point: A breakout above the support & resistance zone (~168.000) would strengthen bullish momentum, while a rejection could lead to further downside.
📢 Trader’s Takeaway:
🔹 Short-term traders should watch for confirmation of the double bottom breakout.
🔹 Swing traders may look for opportunities within the current channel structure, capitalizing on both reversals and trend continuations.
🔹 Risk management is crucial; a break below 166.000 may invalidate bullish setups.
Stay tuned for more updates and trade wisely!
🚀 Follow me for real-time insights and forecasts.
OANDA:CHFJPY FX:CHFJPY VANTAGE:CHFJPY

NZDSGD at Key Resistance – Will Sellers Step In? OANDA:NZDSGD has reached a significant resistance zone. This area has historically acted as a supply zone, increasing the likelihood of a pullback if sellers step in.
The current market structure suggests that if the price confirms a rejection from this resistance, we might see a move lower toward the 0.76670 level , a clear target based on past price behavior and current market structure.
Just my take on support and resistance zones—not financial advice. Always confirm your setups and trade with solid risk management.
Best of luck!

GBP_JPY SUPPORT AHEAD|LONG|
✅GBP_JPY is set to retest a
Strong support level below at 187.066
After trading in a local downtrend from some time
Which makes a bullish rebound a likely scenario
With the target being a local resistance above at 189.186
LONG🚀
✅Like and subscribe to never miss a new idea!✅

LTC BUYhello guys
Considering the good growth of the price and after its correction, now is a good opportunity to enter into a transaction with capital management.
We have specified a target for you.
*Trade safely with us*
