BITCOIN : FREE SIGNAL (DON'T MISS)Hello friends
According to the upward trend we had, you can see that the price is stuck in a channel and after the third collision with the channel ceiling, it has managed to break the channel, which indicates the power of buyers and you can buy within the specified support ranges with capital and risk management and move with it to the upcoming goals.
*Trade safely with us*
Freesignals

DOGS : be carefulHello friends
As you can see, after the price growth we had, the price has fallen. Given the severity of the fall, we recommend that you buy in stages, manage your risk and capital, and move with it to the specified goals.
*Trade safely with us*

SEI LIVE TRADEHello friends
Given the decline we had, we expect to experience another decline and we can open a trade in the direction of the trend with capital and risk management.
*Trade safely with us*

Buy in fear, sell in greed.Hello dears
Due to the price growth, now in the pullback you can buy in support areas in steps and move with it to the specified targets, of course with capital management.
*Trade safely with us*

Be prepared for everything...Hello dears
Given the recent growth, the price is stuck in a range and now that it has reached the bottom of the range, there are two options:
1_The price grows from here and hits our target.
2_The price continues to fall and falls to the support area below and our second buying step is activated and grows from there.
Buy a step and be ready for anything.
*Trade safely with us*

A bullish pattern was formed...Hello friends
Given the entry of buyers and the formation of an ascending pattern, you can enter into a transaction with capital and risk management and move towards the specified goals.
*Trade safely with us*

BTCUSD UPDATE - 22- 05- 2025This chart illustrates a potential rising wedge pattern in the Bitcoin/USDT (BTC/USDT) 45-minute timeframe on Binance. Here's a breakdown of the key elements:
Chart Analysis:
Rising Wedge Pattern (Bearish):
The price is moving within converging trend lines (marked in blue), forming a rising wedge — typically a bearish reversal pattern.
The projected breakdown (blue arrow) suggests a move downward out of the wedge.
Support Zone (Yellow Box):
A strong historical support zone is highlighted, around the $103,000–$104,500 range.
This is the likely target if the price breaks down from the wedge.
Bearish Target:
If the breakdown occurs, the price may fall to the yellow support zone.
Volume spikes on recent candles suggest increasing interest or volatility.
Stop Loss Zone (Red Area):
The red shaded area at the top of the wedge likely represents a stop-loss for a short trade setup.
Current Price: Around $110,708.20 at the time of the snapshot.
Summary:
The chart implies a potential short opportunity based on the rising wedge breakdown, targeting the yellow support zone. Confirmation would be needed from a strong bearish candle closing below the lower wedge boundary with increased volume.
Would you like help identifying entry/exit points or risk management strategies for this trade setup?

EURGBP: Potential sell setup towards 0.8500?OANDA:EURGBP has reached a notable resistance level, an area that has been a clear turning point in the past, leading to some notable reversals. Given this, there is once again potential for a bearish reaction if price action confirms rejection, such as a bearish engulfing candle, long upper wicks or increased selling volume.
If the resistance level holds, I anticipate a downward move toward 0.8500 , which for me is quite an achievable target now.
But if the price breaks above this zone and sustains above it, the bearish outlook may be invalidated, leading to further upside.
Just my take on support and resistance zones, not financial advice. Always confirm your setups and trade with solid risk management.

XAUUSD Chart 4H Analysis BUY GoldXAUUSD Chart 4H Analysis BUY Gold Doesn't Have To Be Hard Profit Surging!
The provided XAUUSD (Gold Spot/U.S. Dollar) 4-hour chart outlines a structured technical setup with clearly defined entry points, retracement zone, and multiple take-profit (TP) targets.
The current price at the time of analysis is **$3,198.67**, with the potential for a bullish continuation upon confirmation within the valid setup zone. Let’s break this down in detail:
**Current Price and Entry Strategy**
* **Current Price:** $3,198.67
* **Recommendation:** Look for better entry around or near the green support zone. The setup is bullish-biased, suggesting a buy-on-dip opportunity.
* **Support/Invalidation Zone:** If the price **closes below the green zone**, the setup will be **invalidated**. Hence, risk management and confirmation are crucial before taking any position.
**Target Levels Identified**
Three Take-Profit (TP) levels are established in the chart, each indicating potential upward momentum if the price respects the support and begins to rise again:
* **TP1: $3,220.67**
✔️ Gain of **22 USD (220 pips)** from current price
✔️ Represents an initial move post-entry confirmation
✔️ Ideal for short-term scalpers or conservative traders
* **TP2: $3,252.67**
✔️ Gain of **54 USD (540 pips)** from current price
✔️ Mid-level target indicating strong bullish continuation
✔️ Can be a good point for partial profit booking
* **TP3: $3,284.67**
✔️ Gain of **86 USD (860 pips)** from current price
✔️ Long-term or full swing trade target
✔️ Represents full bullish momentum with higher reward-to-risk ratio

LITCOIN : So what is an ETF ?Hello friends
Be careful with the recent fluctuations of this coin because the movements of this coin have become unpredictable and we suggest that if you want to buy, buy in the specified support areas and in steps, of course with capital and risk management...
We have also specified targets for you.
*Trade safely with us*

NOTCOIN AGAIN ...Hello friends
Due to the change in the bearish structure and the weakness of the sellers, you can see that the buyers entered and were able to create new ceilings.
Now, according to the trend, we can buy in steps at the specified support points and move with it to the specified targets.
*Trade safely with us*

XRP : LONG FOR THIS WEEK !Hello friends
Considering the good growth we had, you can see that the price has formed a double top pattern and corrected after reaching its ceiling.
Now, with the price correction, there is a good opportunity to buy in stages and with capital management and move with it to the specified goals.
*Trade safely with us*

SOLANA BUYLIMITHello friends
Considering the good growth we had, you can see that the price has made a small correction after reaching its ceiling and has entered a range.
Now, with the price correction, there is a good opportunity to buy in stages and with capital management and move towards the specified goals.
*Trade safely with us*

NOTCOIN : IT'S TIME TO BUY GUYSHello dears
If you are risk-averse, this analysis is for you...
According to the bullish pattern that has formed, you can see that we had a decline and now it is time to take a logical risk, that is, we buy at the specified levels with capital management to move towards the specified goals...
*Trade safely with us*

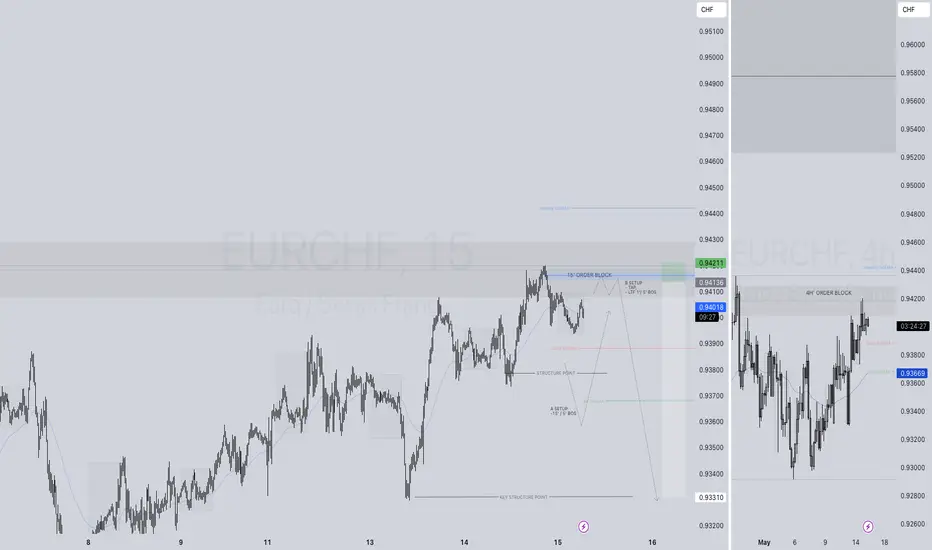
EURCHF SHORT FORECAST Q2 W20 D15 Y25EURCHF SHORT FORECAST Q2 W20 D15 Y25
Professional Risk Managers👋
Welcome back to another FRGNT chart update📈
Diving into some Forex setups using predominantly higher time frame order blocks alongside confirmation breaks of structure.
Let’s see what price action is telling us today!
💡Here are some trade confluences📝
✅4 Hour order block rejection
✅4 Hour 50 EMA rejection
✅Intraday 15' order block
✅Tokyo ranges to be filled
🔑 Remember, to participate in trading comes always with a degree of risk, therefore as professional risk managers it remains vital that we stick to our risk management plan as well as our trading strategies.
📈The rest, we leave to the balance of probabilities.
💡Fail to plan. Plan to fail.
🏆It has always been that simple.
❤️Good luck with your trading journey, I shall see you at the very top.
🎯Trade consistent, FRGNT X
EURUSD - at Resistance: Will it drop to 1.11300?OANDA:EURUSD price is now at a strong resistance level, this is an area where it has struggled to break through in the past and reversed to the downside. It's also where sellers have stepped in before, so it’s worth keeping an eye on, especially for anyone considering short trades.
If we start seeing signs that the price is getting rejected here: like long wicks, bearish candles, or buyers starting to lose momentum, I think we could see a move down toward the 1.11300 level. But if price breaks through this zone clearly, that might dismiss the bearish idea and suggest even more upside will continue.
This area is pretty important and could give us a better idea of where price is headed next.
Just sharing my thoughts on support and resistance, this isn’t financial advice. Always confirm your setups and manage your risk wisely.

If you're stuck, watch (full analysis)Hello friends
Given the high growth of this token, now that it has made a good correction, it makes sense to buy in stages and with capital management and move with it to the specified goals.
*Trade safely with us*

Today's signal is TONHello friends
Given the price growth after reaching resistance, it has entered a correction, which provides a good opportunity to buy in stages and with capital management and move to the specified targets.
*Trade safely with us*

Don't miss Ethereum todayHello friends
Given the good rise we had, you can see that the price has entered a correction and has provided us with a good opportunity to buy in steps, of course with capital and risk management.
*Trade safely with us*

TIA SIGNALSHello friends
As you can see, this currency has a beautiful chart and the technical analysis we did is that if the valid resistance is broken, we can open a buy trade with capital and risk management and move with it to the specified targets.
*Trade safely with us*

BITCOIN BUY LIMIT Hello friends
If you are a risk taker, this position is for you...
Given the price growth, we expect a correction, so in the pullback we have identified important points to buy with capital and risk management and move towards the specified goals.
*Trade safely with us*

LITCOIN SIGNALSHello dears
You see that after a good growth, the price was in a range and then we had a decline until the support area was identified, which is also a good area and it was able to record a new ceiling, which is a good sign. Now the best and least risky thing is to buy steps.
We have identified the buying steps for you and the targets...
Note that this analysis is in daily time and may take a while, so if you are not patient, do not enter.
*Trade safely with us*

RF 1D: Breakout or Just a Bullish Pause?Regions Financial (ticker: RF) finally escaped the descending channel it had been stuck in for nearly 8 months — like someone who missed their stop and woke up in a different state. The breakout came with volume and a hold above the 50-day MA, which technically gives the bulls a reason to stretch their legs — cautiously.
The price has already cleared the 0.618 Fibonacci level (~21.66), and is now pushing toward the 0.5 zone (~22.87). If momentum holds, the next key area is target 1 around 24.00–24.50. Beyond that — and this is where things get ambitious — we have target 2 in the 27.50–28.50 range, which aligns with pre-breakdown resistance from late 2024.
RSI is climbing into overbought territory but still confirms the breakout rather than warning of a top — at least for now.
On the macro side: U.S. regional banks have had a rough ride in early 2025, but RF has held up better than many peers. The recent earnings beat and visible uptick in volume suggest growing institutional interest. If bond yields keep cooling and risk appetite returns to the value sector, RF could remain in favor.
That said, bulls need to see a confirmed hold above 22.80. Otherwise, this could end up as another failed retest — and bears are always lurking just outside the channel.
