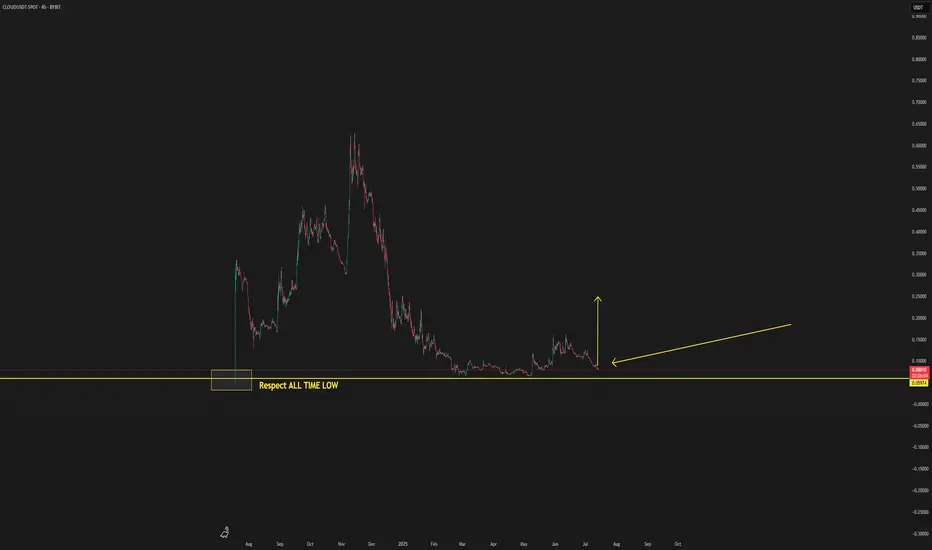
CLOUD THIS CAN BE THE BOTTOM STARTThis is a new coin to watch in the coming period, as it is showing signs of potentially forming a new bottom.
By respecting the previous all-time low, there’s a possibility that a new upward trend could begin from this level. Some indicators are also pointing toward this scenario.
If the coin provides further confirmations, updates will be shared below.
Friend
dm me if this is dont understandableall the meaning is on chart . u can use it to understand the future market when its move , dont try to trade it if u dont understand what u are doing . this is learning material u can use it for learning and increase ur knowledge .

EURNZD - The Trend is your Friend 📉Hello TradingView Family / Fellow Traders. This is Richard, also known as theSignalyst.
📈 EURNZD has been overall bearish, trading within the falling channel in red.
At present, EURNZD is undergoing a correction phase and it is currently approaching the upper red trendline acting as a non-horizontal resistance.
Moreover, it is retesting a strong resistance zone marked in green.
🏹 Thus, the highlighted red circle is a strong area to look for sell setups as it is the intersection of the green resistance and upper red trendline.
📚 As per my trading style:
As #EURNZD approaches the red circle zone, I will be looking for bearish reversal setups (like a top bottom pattern, trendline break , and so on...)
📚 Always follow your trading plan regarding entry, risk management, and trade management.
Good luck!
All Strategies Are Good; If Managed Properly!
~Rich

Hello Darkness My Old FriendI've come to talk with you again.
Because a vision softly creeping
Left its seeds while I was sleeping
and the vision that was planted in my brain
still remains
-------
Me and Viacom (now paramount) have history.
Apr 8th 2021 - It was the first stock I became invested in the markets 2 years ago (and lost 5 digits on)
Nov 12 2021 - I left this golden nugget of a game analogy for what was to come in markets.
Dec 11 2021 - The lessons I learned about the darkness of investing was eye opening.
Jan 8th 2022 - But it was too late. I had the Saturday Night Feature.
Jan 31 2022 - I learned to see the Risk as well as the Reward.
Jul 5 2022 - I could clearly the market was not the economy.
Thanks to those who encouraged me to keep posting ideas and learning econ and markets.

DXYUSDTJuly 5
hi traders
here in the chart we are sharing our idea on apple for you as you can see chart in the daily time frame we have a NAEEM wolf :) wave pattern and we expect these targets.
Good luck my friend NAEEM .


How to collect TradingView Coins and refer your friendsIn this video, we show how you and your friends can collect $30 in TradingView Coins to use toward paid plans like Premium. If you refer TradingView to a lot of people, make sure to follow this video closely. It's how you and your network can get $30 worth of TradingView Coins.
Step 1 - Visit the refer-a-friend page where you can find your unique link. You can find the refer-a-friend page in your menu or by using this link.
Step 2 - Copy your unique link and share it with your friends, colleagues or network. Your unique link can be shared as a tweet, Facebook post, email or text message. If you run a blog or website, you can also place your unique link there.
Step 3 - When someone signs up for a paid plan using your unique link, you will both receive $30 in TradingView Coins.
Step 4 - Your TradingView Coins can be used toward a paid plan. A single coin is equal to $0.01. When someone signs up for a paid plan using your link, you will both get $30 in TradingView Coins to use toward Pro, Pro+ or Premium.
Step 5 - You can also donate your coins to other users. For example, when you visit our profile page here , at the top right, there's a button that says Donate . Click that button if you think our ideas are awesome and send us some coins! We just may do the same for you. 😉
We hope you enjoyed this video and that you collect some TradingView Coins using your unique refer-a-friend link. If you have any questions, please write them in the comments below so our team can help.

Bitcoin forming an Adam & Eve Rounding bottom I think bitcoin forming an Adam & eve Rounding bottom with a 2 tragets. The first target at 8400 $ and the little more aggresive Traget at 9000-9100$.
No Financial advice


ArtI predict the bitcoin price solely to claim clout if I am right and to stay quiet when proven wrong. It's purely 'business'. TWITTER CLOUT IS IMPORTANT. TWITTER CLOUT ALLOWS GREAT THINGS. MEMES ARE LIFE, THE PRESIDENT OF THE UNITED STATES FEARS THE POWER OF MEMES.
sorry for caps

GBPCAD (1H): extreme volatility can be exploited. This is a shorter screencast where I show how the extreme volatility of GBPCAD on 1 hour time frame can be exploited. Expect to lose - just keep losses minimal, and maximise gains by keeping trailing stops reasonably wide.

Psychological trading hack #0003 - finding your true friendIs finding your 'true friend' a psychological issue? Absolutely! We normally think of 'friends' as people - and that can be something of a mistake (based on personal experience), as I explain.
Your true friend in trading is right there hidden in the backdrop behind the candles - and that's why you see no candles in the screencast.
So I'm saying, find the tools and the methods which will lead to finding the real true friend. Then let your true friend help you.

USDCHF looking for a pullback and shortprice broke uptrend and now in a downtrend. Which means I want to short pullbacks

EUR/USD:beginning of an short term up trend 1.1500-1.1510 was a strong support that kept bear attack.
Our pair is above 20-MA. This could signalize about movement UP.
Core points are 1.1715 and 1.1800.
Have a good trading week.

Interesting key levels on BTC!I was fiddling around with converting daily indicators to match the 4 hour chart when I noticed the support/resistance fight between these levels. Note how the 300 daily EMA has historically acted as support in the 2017/2018 bullrun. The 200 EMA on the daily is now working as a solid resistance, as it has done before. Now I mostly use Ichimoku nowadays, and as you can see the Kijun line has ever since the top at $10 000, acted as my support target. It's also moving inside the cloud. Ichimoku will therefore be the primary indicator. Do also notice the support trend reaching all the way back to December. Everybody knows this is a critical level.
My conclusion is that I will continue using these indicators as my tools for trading on long-term. And remember that in a highly manipulated market like this, it makes little sense analyzing anything less than the 4 hr chart if you're not a pro. This makes leverage trading harder of course.
My key levels for the next move: 9050, 8800, 8200, 8000


DOW JONES INDUSTRIALS: DOWI A Faithful Friend to TradersDow Jones Industrials: Easier than Nasdaq to Trade
It looks like a lazy continuation pattern is forming back to 22393 before a good rally sets in again. This pattern will only
change on any successful breach of either of the small parallels - to upside follow on successul break of upper
parallel for another test of the larger parallel above.And if the lower small lower parallel is sucessfully breached
on the downside it will seek support off the blue support line at 22995 - just much quicker than if it tracks within the flag.
The 22995 level is important to the medium term for the Dow. And we can see that the entire rally between the two blue
supports at 22995 and 22393 is, so far, uncontested. It would be easy pickings for bears should 22995 fail at any point.
It would fall quickly 600 points (a fabulous short if we see it at any point, worth setting an alert for) to 22393 at least and
quite likely to test the lower large parallel before the next rally could begin in earnest.
But until we see a break of those small parallels that form the flag top, this space belongs to day-traders. The 'perfect'
pattern will hold the flag fromation, zig-zagging down to 22995 on about 6th December before the great Christmas rally
kicks in. Only in the event that the two parallels that form the flag are broken in the interim will volumes pick up.
The three blue support lines then become the next obvious points to short from once broken.
MEDIUM TERM
The 22995 level is important to the medium term for the Dow.
And we can see that the entire rally between the two blue
supports at 22995 and 22393 is, so far, uncontested. It would
be easy pickings for the bears should 22995 fail at any point.
It would fall quickly 600 points (a fabulous short if we see it
at any point, worth setting an alert for) to 22393 at least and
quite likely to test the lower large parallel before the next
rally could begin in earnest.
But until we see a break of those small parallels that form the
flag top, this space belongs to day-traders.
LONG TERM
Long term, for what it's worth, this index should rally at least 4 X from the February 2106 low and quite easily 6 times. America has never had it so good since Ronald Reagan rode into the sunset. Happy thanksgiving to the USA. Long Term Cycle Analysis:
Dow and S&P 500: DOWI SPX500: Super-long-term Chart and analysis
LONG TERM
Over the longer term the Dow is still expected to rally at least 4 X and quite likely 6 x from the February 20016 low at 15513
over the coming 15 years.https://www.tradingview.com/chart/DJI/t9MH9rbb-Dow-and-S-P-500-DOWI-SPX500-Super-long-term-Chart-and-analysis/
Last Point: One other thing, this market is one of the best to trade, making conventional patterns, especially in continuation mode - making it muuch easier to 'read' than, say Nasdaq. Look atthe patterns - they're friendly, familiar. Are Nasdaq's? Find a friend you can trust. That would be the Dow.

WTI: USOIL Very Bullish - Buy dips up to 62WTI: USOIL See that Wave? Use it. It's free power.
The impulse wave on WTI is not quite so perfect as that on Brent (which is creating one of the most perfect trader-
friendly waves ever seen right now, check it out).
But the wave is beginning to take shape here nicely now too and looks full of intent and stored energy, ready to power it
higher over the next week or two ahead. As with the Brent impulse wave, use any further tests on the lower parallel as a
buying opportunity (with stops 30 pips below) and any test on the upper parallel as a near term selling opportunity with
stops 50 pips above if day trading this complex. The upper parallel here on WTI is sensational, really trustworthy, as good as
Brent's - and now the lower parallel is forming nicely too on WTI. We can use that for the next couple of weeks.
If WTI comes off from here and back to 55.00-54.60 it's a buy with stops 30 pips under the parallel. Although it's clear that
the entire area betwween 57.20 and those highs at 61.62 on left of chart is a real battleground, and that we are quite
likely to see a repeat of that whipsaw at the same levels and will need to take profits quickly (before someone else does
and price drops away again fast) ...but the trade has to be buying all dips as WTI grinds higher and higher , right up to
61.57 - 62.55 upside target - at which point, with bears squeezed tight, it will likely fall away again. (or if day trading
sell off the upper parallel and buy back from lower up to 62).
We are still long here on a long-pull swing trade from 43.74 and unlike the similar Brent trade this was never closed out
just before the last Opec non-event - this didn't look 'spent' but Brent did (so shorted it and left this long open, see older
comments if interested). It has a 61.47 limit order on it. One day...At any rate, last week's price action was super bullish
for WTI, turning old and powerful resistance at 55.06-54.60 into support and catching the market on the wrong foot by Friday.
This has more upside now. Use any weakness from here back towards the parallel as a gift of a buying opportunity until the
upside target is achieved, ideally as WTI hits the upper parallel at 62.40. Time, and trend-lines, as always, will tell.
So WTI is 'surprisingly' bullish. Solid bull move last week. This wave has more to run. It woukld have to close below 54.60 for
the bears to have even the remotest chance of getting a grip from here. Ain't gonna happen anytime soon. Last week told us that.


