FTM
SONIC | (Previously Fantom) | HUGE BULLISH PatternFTM has now officially been replaced on most exchange and is now trading as Sonic.
At first we saw an initial drop, typical "sell the news" actions, but now there is a bullish pattern forming in the 4h timeframe.
SONIC is bullish because:
✅ Upwards trendline trading
✅ Higher Lows
✅ Bullish chart pattern: W-Bottom
_______________
BYBIT:SONICUSDT
FTM Delisting | OFICIALLY Becoming SONIC (S)Although a name change for FTM was announced in Aug 2024 already, many exchanges still list FTM, and this will soon change.
It is expected the Fantom will officially be delisted and become SONIC within the next two months.
In August 2024, Sonic Labs announced that they would be replacing Fantom with a new token called Sonic (S). Sonic Labs have confirmed that all existing FTM holders would be able to convert to S at a fixed rate of 1 FTM : 1 S. However, many exchanges will only transfer now, as they will finally be delisting FTM for good and converting all FTM S. This will be done at a conversion rate of 1:1.
_________________________
Make sure you don't miss the latest ETH update, since BTC is likely heading towards a new ATH and ETH stands much more to gain.
_________________
CRYPTO:SONIUSD
POLONIEX:FTMUSDT
ALTCOINS | Alt Season | BUY ZONES1️⃣ATOM / BINANCE:ATOMUSDT
Ideal buy zone is the lower area, unless it CLOSES daily candles above the upper area - then the bottom is likely in and chance for lower entry is slim
2️⃣ Litecoin LTC / BYBIT:LTCUSDT
This likely means a longer wait until ideal entry points, weighted heavier towards the lower zones:
3️⃣ Fantom FTM / BITSTAMP:FTMUSD
Seeing a trendline here that should be noted for a likely buy:
4️⃣ DOGE / BINANCE:DOGEUSDT
DOGE price has not yet begun to trade UNDER moving averages in the weekly either, meaning the bearish cycle is still in early days:
DOGE ideal entry for me would be for accumulation, long-term:
FTM/USD 1D ChartHello everyone, let's look at the 1D FTM to USD chart, in this situation we can see how the price is moving in a descending triangle where we are approaching the moment of trying to choose the direction in which the price can go further.
Let's start by defining the targets for the near future that the price has to face:
T1 = 0.66 USD
T2 = 0.81 USD
Т3 = 0.93 USD
Now let's move on to the stop-loss in case the market continues to fall:
SL1 = 0.44 USD
SL2 = 0.31 USD
SL3 = 0.21 USD
If we look at the MACD indicator we can see a return to a local downtrend, however we are still in a place where the trend can reverse and surprise us with growth.
ALTS Shine, +55% INCREASE !! FTM | RNDR | Render and Fantom have made steep increases over the past two weeks.
In the past two weeks, FTM increased a whopping 55%:
And RNDR increased around the same amount:
This naturally makes it likely to see a correction soon, which may be the ideal time to get into the accumulation boat - or just for a swing trade.
________________________
GEMINI:RNDRUSD CRYPTO:FTMUSD
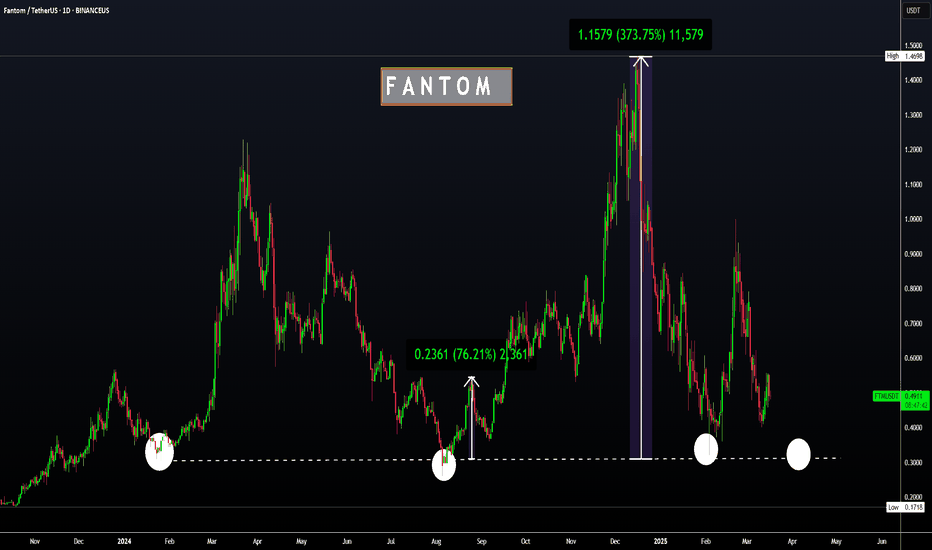
FTM | FANTOM | Altcoin with GREAT UPSIDE POTENTIALFTM has recently increased 11% in the weekly, but is making more red candles in the daily and the impulse up seems to be over for now.
Looking at the corrections, from -45% to -80% is not uncommon for Fantom.
The good news, is that the bottom is likely close - and from here, there exists great upside potential.
I am NOT saying we can't fall lower here - infact, a full retracement may be likely, just as we saw the previous cycle. In which case, the upside is even bigger. 30c is indeed a very popular demand zone:
_____________________
BINANCEUS:FTMUSDT
Major Levels – Is Sonic Ready to Pump?After reaching the daily resistance level ($0.7818), price faced strong rejection. The anchored VWAP, acting as dynamic resistance just below the daily level, provided additional confluence for a low-risk short opportunity.
Additionally, a key high at $0.7891 further reinforced this resistance zone. Following the rejection, price sharply declined -13%, retracing back into the previous trading range.
Support Confluence
Price is now approaching a well-defined support zone:
Bullish Order Block: $0.6816
Key Level Near Order Block: $0.6803
Golden Pocket (Fib 0.618 - 0.65): 0.618 at $0.6793 & 0.65 at $0.6739
Monthly Open: $0.6732
Point of Control (POC): $0.6732 (aligning with Monthly Open)
Daily 21 EMA/SMA: 21 EMA at $0.6835 & 21 SMA at $0.6790
Fib Speed Fan 0.7 (from $0.615 to $0.7818): Providing additional support in this zone
Long Trade Setup
Entry Zone: $0.6816 – $0.6732
Stop Loss: Below the Monthly Open ($0.6732)
Take Profit Zone: $0.7111 – $0.7201
Risk-to-Reward (R:R): 3:1 R:R setup, offering a high-probability trade
Take Profit Targets & Resistance Zones
Previous Swing Low: $0.7111 (untested)
Value Area Low (VAL): $0.7152
Anchored VWAP (from $0.615 low): $0.7137
Fib Retracement 0.382 (from $0.7818 high to current low): $0.7201
SONIC ( PRE FTM )Analysis of the FTM OR Sonic currency
It seems that a trend reversal has formed and has completed 5 microwaves in the form of a larger wave 1
Next we need to see if it can break the major ceiling to confirm the new move
If you liked the analysis, share it with your friends and write down your comments
Can FTM/Sonic Maintain Bullish trend?Can FTM/S Maintain Bullish trend?
Curious to hear your toughts on this.
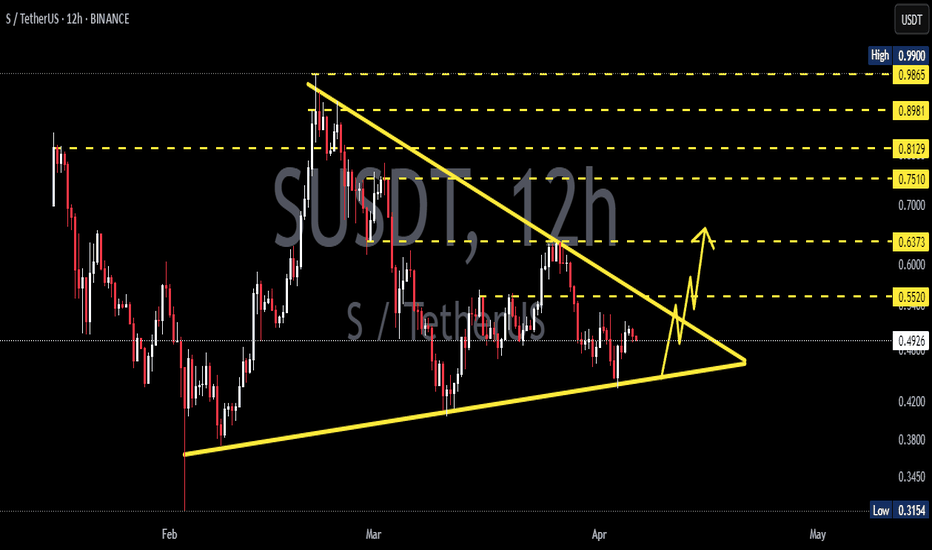
Fantom FTM => Sonic S price analysis💱 At the beginning of January 2025, the rather old #Fantom project #FTM rebranded to #Sonic #S
‼️ The previous history of #FTMUSDT trading disappeared from the charts, but we have recreated it for you on this OKX:SUSDT chart
Unlike most altos, the price is held and rounded up.
🆗 We have schematically depicted the levels for trading and the possible price movement of the #S on the chart.
In the long term, we can see growth to $8-8.50
_____________________
Did you like our analysis? Leave a comment, like, and follow to get more
FTM/USD 8H possible correction?Hello everyone, let's look at the 8H FTM to USDT chart, in this situation we can see how the price has broken out of the local downtrend line, which it is currently moving above.
Let's start by defining the targets for the near future that the price must face:
T1 = $0.75
T2 = $0.86
Т3 = $1.02
Т4 = $1.19
Now let's move on to the stop-loss in case the market continues to fall:
SL1 = $0.60
SL2 = $0.49
SL3 = $0.42
SL4 = $0.32
It is worth looking at the RSI indicator, which shows how strongly we have broken out of the upper limit of the range, moreover, here we can see how we have touched the level of 81, at which price rebounds were previously visible.
FTM low time frame update#FTM pattern tells us that the market is ready for a big rise
the pattern was a bind of an uptrend and a down trend the down trend wanted some liq to be stopped and it took this liq from stop losses and now its hungerness is done !
just because of the bearish pattern in the whole market we have 2 scenarios once is rising from here and the other one is rise after another down
there is a real positive pattern in higher time frames check this out
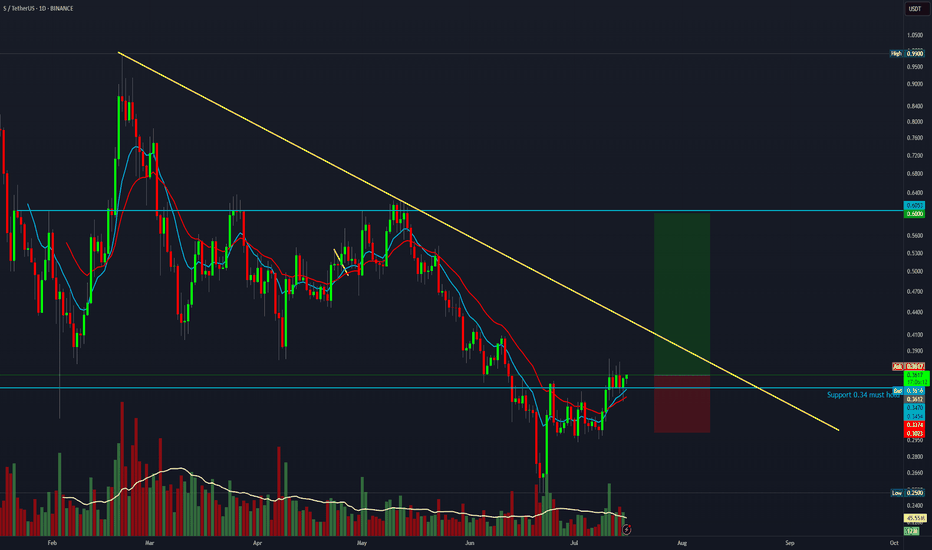
S 01/29/2025@Sonic has been abandoned by the market, market maker and team in terms of pricing and therefore has acted completely bearish, even in the positive parts of the market and the positive signals issued by the indicators, #Sonic still failed to grow and falls with the slightest event.
According to the Sonic team's opinion and conclusion to support the price, this trend will change soon and I think we will see the price increase according to the green line.
#S #FTM #FANTOM


