FTM
🔥 FTM Head & Shoulders: Peaking Into The AbyssFTM has been one of my favorite tokens during the bull-run, but has lost nearly all of its value over the last two years. In its current state, it's one of the weakest big alts.
In my eyes, there's potential for more bearish price action in the future. I think that FTM can fall as far as 0.03 USD. Consequently, this would be my ideal area to step in for a long-term position.
I'm waiting until the price closes below the neck-line of the pattern before making an entry.

FTM in the purchase zone!!!FTM price is in the global buy zone 0.27-0.12
The purchase level of 0.19 is below the volume price - 0.2407
The price of the total volume is 0.0174
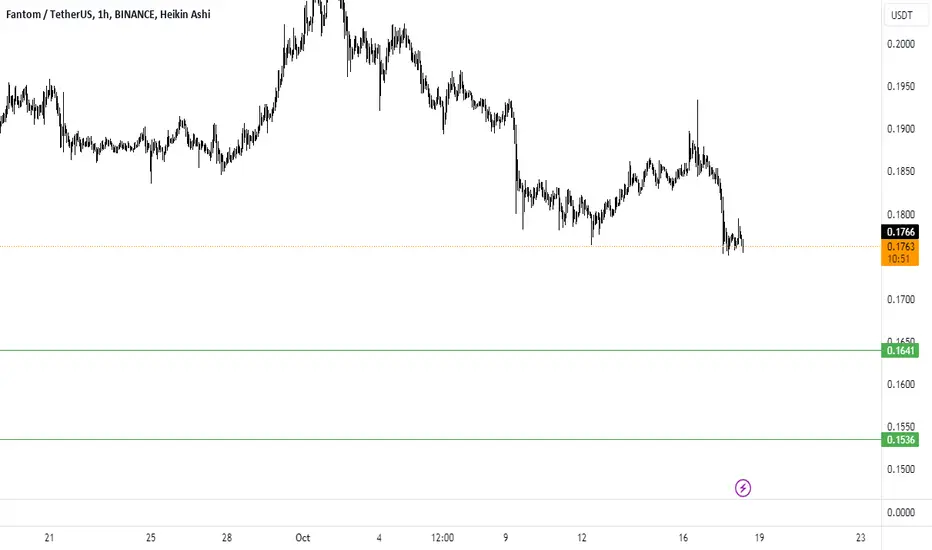
Test: A new purchase level has appeared on the chart! (green dotted line) 0.1831

FTMUSDT
FTM, continue the decline or test the upper resistance?, still 2 months left for the annual candle,.. some indicators show bearish... this is not a suggestion for trading, you should do research first and analyze further...

FTMUSDTBINANCE:FTMUSDT Long idea
⛔"Daily crypto market analyses I provide are personal opinions & not financial advice. Trading carries risks, so do your own research & seek advisor's help.#DYOR"
Don't forget to like and comment

FTMUSDT LONG IDEAFTMUSDT has break an strong resistance and after pullback it has shown trigger.
entry:0.1950
tp1:0.2018
tp2:0.2080
tp3:0.2151
sl:0.1895
r.r:3.65

FTM USDT
ftm is correcting or bearish again... note: don't use this idea as a trading idea, before you analyze and research it yourself...

Focus on FTM : Breakout on the Horizon with Rising Momentum💎Yello Paradisers! Prepare yourselves for an exciting journey with FTMUSDT. We've identified a successful exit from the descending channel, laying the foundation for a likely bullish rise.
💎Based on our previous evaluations, we observed the transformation of demand into supply, with FTM making contact with the lower channel support.
💎Currently, the notable volume in VRVP is hinting at a potential upward journey shortly. Surpassing the monthly resistance is expected to strengthen this upward momentum.
💎On the other hand, if the price penetrates the 0.1707 level, it may escalate the bearish momentum, with the price potentially reapproaching the previous support level.
💎Proceed with prudence and apply rigorous stop-loss protocols for trading Fantom. Remain alert to the unfolding market scenarios and stay updated with more insights!

Fantom might be a repeat setupFTM 1day took a good beating lately with the Multi exploit and other issues but the FF is still out there transparent and open with users and investors to build back This time is nothing they have not endured in the past to come back stronger like many other protocols With increased volume we think FTM could be a good bet for some gains through the coming months The team is still building and the release of the FVM is scheduled for the eoy 2023 The Foundation has acknowledged the need to be more attentive to business building into the future and to us is looking solid still Price is at long-term support from about a year ago and looks likely to be the pivot point Other indicators are backing the pivot but this will be relying on BTC behaving itself and also increased volume through October-November for the push to 0.33 resistance area first stop

FTM 40% pump is incoming 🆓🚦📌 #dyor
💰 Position size :: 1%
💱 Leverage :: cross ➖ 2-5x
🪙 UPCOM:FTM -USDT 📌
#futuretrade :: ↗️......🌴
#BUY :: $0.2160 - $0.2397 ( split % 💰 )
🎯
:: $0.2683
:: $0.2959
:: $0.3478
Stop 🛑 lose #SL :: $0.2056 🚏
📌 always move stop lose #sl
when target get reached 📌
#risk :: medium #scalping
#explanation 👉
day looking good 🙂 but weekend bearish 📍 let's hope postive

FTM Full Analysis For Long-TermHey Guys… How are you today? 👋👋
It's a new day and I want to talk about FTM (Fantom)…
✔️ Before that, I want to remember It's not financial advice.
✔️ I'm just sharing my view and opinion of the chart. Please see and think about that. The situation is so complicated.
It's my duty to tell you something honestly.
But, first, I ask you to Like my analysis, follow me, and Share this analysis with your friends.
It will give me more positive energy to publish more analysis.
So, thank you for your support.
Let's go into details.
As you see, we have Three Main support zones. The first one is around 10-11 Cent, the second is between 5-6 Cent and the last one is around 3.5-4.2 Cent.
Buying on Shadow will be very exciting. So, I will put my order on 4 Cent.
I'm sure the first support will be lost soon. If you check this asset's chart in the weekly frame, you see a Head and shoulder pattern that the neckline is breaking.
So, we have to focus on this support and it's very important to us to money management.
By the way, there is good news for FTM, if you can buy FTM at the lowest level, this asset will give you a huge profit of more than 50,000% at the end of the Last Bull Market.
If you need to analyze in another time frame, for example, 4H or 1H, please send me a message
It takes about 4-5 Years. I think you should know the worth of this asset and this huge profit … can you imagine this profit? 🙈 🙈
I want to buy and hold FTM on 3rd support zone and my final target to sell is around 20 USD.
I'm sure you are confused right now. But it's ok and there is no problem. Time proves everything.
If you have any questions, or if you need to know more details please don't hesitate to contact me.
🙏🙏 Please don’t forget to like 👍, follow ✌️, and share 👌 this analysis with your friends. Also write your comments below, Do you agree with me? do you think we are still on a downtrend? and what is the last target of this downtrend?
Thank you so much for your attention and participation 🙏🙏
Wish you the best 🧞♀️
Sincerely Yours
Ho3ein.mnD

FTM ANALYSIS (1D TF)Examining the waves, I found that FTM inside a time-consuming diametric. This corrective diametric is large and time consuming and is related to the daily time frame. Now, we seem to be inside this diametric wave E, which itself is a diametric. I have drawn the expected movement path from FTM on the chart. I have such an expectation from FTM.
For risk management, please don't forget stop loss and capital management
Comment if you have any questions
Thank You

FTMUSDT (Which move will happen? A:FTM 3$ or B:FTM 0.015)Which move do you think will happen?
A : FTM = 3$ ? __or__ B: FTM = 0.015$
It does not stay in the middle. One of these will happen, comment your opinion

short on FTMhi again
Since the FTM currency is in a downward trend in the 3-hour time frame, if we see a price increase that will bring the price to the 0.5 trading range of the higher time frame, short positions will have a relatively high probability of success.
For this reason, I share the above shorts position with you

FTM 1DThis is my final analysis on FTM long and short term. The price of the floor covering and the most important support of FTM is 15 cents. If this support is broken, we will have a 50% drop
MOTHER ALL SUPPORT 15C

🔥 FTM Head & Shoulders: On The Edge Of DarknessFTM has been one of my favorite tokens during the bull-run, but has lost nearly all of its value over the last two years.
In my eyes, there's potential for more bearish price action in the future. I think that FTM can fall as far as 0.05 USD. Consequently, this would be my ideal area to step in for a long-term position.
I'm waiting until the price closes below the neck-line of the pattern before making an entry, which is safer.

FTMUSDT LONG IDEAFTM has touched its important support and it shown a pin bar and an entry bar.
tp:0.32
sl: 0.1919

Ftm Preparing For Move Towards 0.50seems like has bottomed out and formed falling wedge in daily tf and approaching towards trendline incase of breakout expecting massive bullish rally
incase of successful breakout expecting move towards 0.50$ keep eyes on for breakout

1H SignalHello
You can take long position after fixation breaking out.
Don't forget SL/TP.
A nice double bottom.

FTM could turn bullish soonHi, dear traders. how are you ? Today we have a viewpoint to BUY/LONG the FTM symbol.
FTM ascended from where I entered "origin of motion" and removed 3 supplies and created ascending CH. The move continued until it reached a strong resistance, which I have marked with a yellow circle, and from there it underwent a correction after collecting many sell orders.
Now after a lot of correction it is coming back to the "origin of motion" where I think there are a lot of buy orders left. By hitting this area and collecting buy orders in this area, it can move up.
When the orders are collected and we move up, I have specified 2 TPs, but it is not necessary to be able to move up to the second TP. So you should take some save profit when we get to TP 1 and place your stop on the entry or you can completely exit the market at TP 1. It's really personal and up to you.
Also, in the chart, we have liquidity pools that I have shown with $$$. Pool 1 has been collected, but pools 2 and 3 have not yet been collected.
One thing you should know is that when candles reach a strong support/resistance and we have liquidity pools, after a CH, candles tend to collect liquidity pools ahead.
For risk management, please don't forget stop loss and capital management. Be sure to set a stop loss, because a smart trader will try to preserve capital before thinking about taking profit.
Comment if you have any questions
Thank You

Dangerous breakdown!Hello
Be carful about your money in this market in particular FTM.
There is a essential trendline like a tons of gas on your money waiting a Spark.
I think it relates to Ukraine and Russia's war.

FTMUSDTThis is a 1D frame analysis for FTMUSDT As you can see, the price has been ranging between the first support line and our resistance line for several days, forming double bottoms which is a sign of indecision in the market. The price is once again attempting to break the resistance line and double bottoms have formed. However, keep in mind that if the price cannot establish itself above the resistance line and fully break below the support line, it may start to move towards the next support line.
