FTM ANALYSIS (4H)Hi, dear traders. how are you ? Today we have a viewpoint to BUY/LONG the FTM symbol.
For risk management, please don't forget stop loss and capital management
When we reach the first target, save some profit and then change the stop to entry
Comment if you have any questions
Thank You
FTMBTC

FTM 1WThe weekly price has pulled back into the broken area
Important weekly support 0.2618. Nest > 2415-2412
Important daily resistances 4h-15min 0.2820 - 2858- 2912- 2940 - 0.3011 - 0.3070

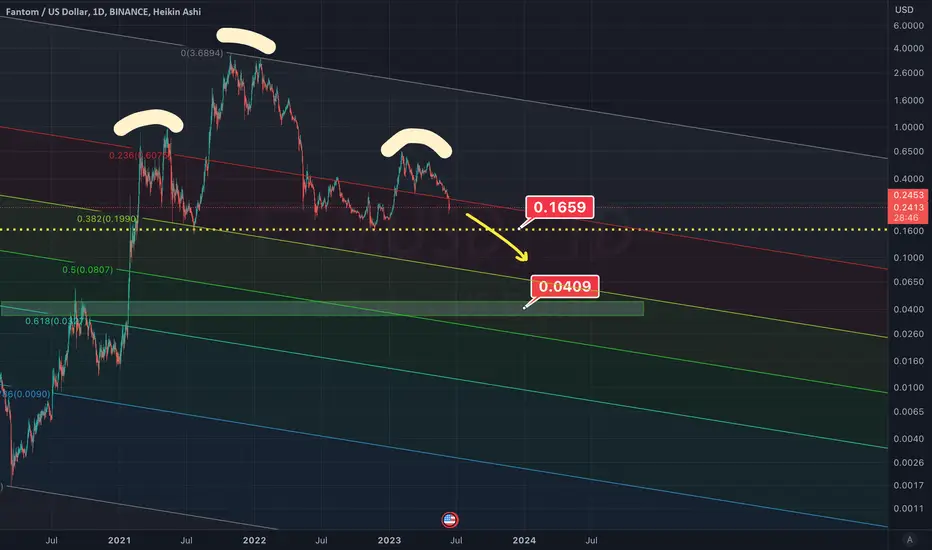
FTM is in Danger of Testing Much Lower Price RangesFTM chart is not looking very good in the near term.
If FTM breaks below 0.20 level, it could accelerate down to 0.04 level which is aligned with the 0.618 golden pocket.
FTM is also forming a head and shoulders pattern and if it breaks the neck line of 0.1660 the price target for that is also right below 0.04.
FTM 1WWithout the need for explanation and fully specified in the chart, the important weekly support of the FTM floor is currently 17 cents.

FTM longMarket is waking up and FTM, Fantom, are soon in a perfect position for a long trade. Buy the break (after confirmation).

FTMUSDT H1 : Situation for Trade Hi guys.
Share three situation for trade with you please do it with your own confirmation .(DYOR)
SecondChanceCrypto
⏰25/May/23
⛔️(DYOR)
always do your research.
If you have any questions, you can write them in the comments below, and I will answer them.
And please don't forget to support this idea with your likes and comment.

Fantom FTM to 0.5805$ ?👑 #FTM/USDT BUY 👑
Entry:
0.3780✅
Targets:
1️⃣0.4373🎯
2️⃣0.4790🎯
3️⃣0.5207🎯
4️⃣0.5805🎯

FTM/USDT LONG💎FTM/USDT
🟢long
🛑max lev 50
💵$3.6%-1.8% OF CAPITAL
🟩enter:0.37350
🟥stop : 0.37127
🔮target's
🪙0.37573
💶0.37796
💷0.38242
💴0.38688
💵0.38911
R/R = 7
RISK HIGH

FTM/BTC Looks like bottomedAs for me - looking great.
What do you think?
BINANCE:FTMBTC is one of my biggest hope for bullrun

✳️ Fantom vs Bitcoin 1.1 Months Later...Here is an update for a pair that we shared late November... A little over a month ago.
Fantom (FTMBTC) continues with a bullish bias.
It is growing slowly and steadily as it should.
While uncertainty can be seen with major pairs/altcoins, the smaller ones paint a clear picture.
After the low is in, we get a long drawn out accumulation phase before the next bullish wave starts.
On the daily timeframe, FTMBTC is trading back above EMA50 giving it mid-term bullish potential. This supports our view of a bullish Q1 2023.
We can see similar charts across hundreds if not thousands of pairs.
Meaning, higher lows positioned for a higher high since the June/July 2022 low.
Some altcoins hit their lows in November and these two are set to grow in the months ahead.
Here is the previous chart, 28-Nov-2022, see for yourself: Fantom vs Bitcoin Moves Above EMA50 (85% Target Mapped)
It takes time...
Patience is key.
Namaste.

Fantom outperform Bitcoin?Hello
I'll start to make once per week update from some chart now on, so better stay tuned.
Fantom looks really good against Bitcoin as long as price stays on top of that key level which I marked clearly with arrows .
You can see from the chart what happened last time it broke that level.
If we can't hold the level I let my risk managment do the work and look for new opportunity if the price comes back on top
We can also break and retest the level which actually happens quite often if you stay patience
Ethereum has also been outperforming Btc for 2 weeks now so that would support this and maybe move some money to alts. Everything depends of the Bitcoin Dominance chart.
Let's check some bigger time frame also
Not financial advice
If you do take trades always use stop loss!
1st mistake novice traders do I don't use them and their ass burned!
Check out my previous work "I think bottom is in"
-Palén


FTM NEW UPDATE (4H)We have risen from the range that we specified for the previous analysis, but we have a weak trend. With recent candlesticks, the FTM wave count should look like this. The place to buy is specified

FTM (D) longFantom is in buy-zone on daily time frame. This is a potential 70% trade. You probably can use the 200 MA as a back up support level where it's likely that FTM bounce if it's fall further down. If the altcoins start running this could be a great play. The BTC-dominance is falling right now. I even see this FTM price level (0.38-0.4) as a potential DCA zone for long term hold.

FTM SHORT trade IDEA Hello, due to a lack of volume in the market I haven't been posting as many updates in coins although we are still looking for opportunities everyday.
Analysis: In our previous LONG trade, we long from 0.35 to 0.53 netting a 51.93% profit. Our target was the #3 possible breakout on the white resistance line. However, we have been struggling to break past the resistance and are looking likely for a due correction to 0.38-0.41 level (green box).
Target: 0.39-0.41
Stop loss: 0.47 (break above )
Timeframe: 1D

FTM ROADMAPHi, dear traders. how are you ? Today we have a viewpoint to BUY/SELL the FTM symbol.
For risk management, please don't forget stop loss and capital management
When we reach the first target, save some profit and then change the stop to entry
Comment if you have any questions
Thank You

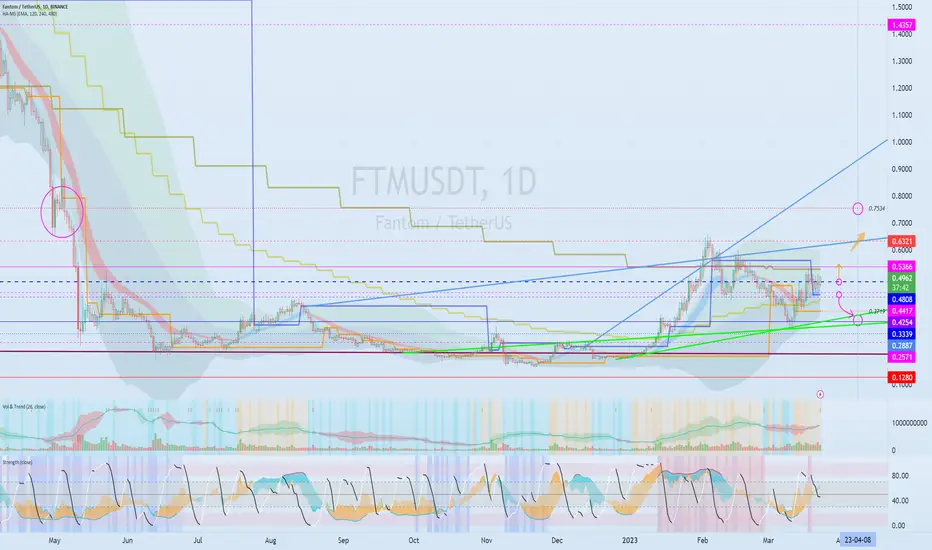
Significance of the interval 0.5366-0.6321...Hello?
Traders, welcome.
If you "Follow", you can always get new information quickly.
Please also click "Boost".
Have a good day.
-------------------------------------
(FTMBTC 1W chart)
The key is whether it can rise with support around 0.0000 1686 ~ 0.0000 2029.
--------------------------------------
(FTMUSDT chart)
(1W chart)
The question is whether it can hold the price above 0.4254 and rise above 0.6321.
(1D chart)
The key is whether it can rise with support around 0.5366-0.6321.
Therefore, if it rises above 0.7534, it is expected to show a sharp uptrend.
To do so, we need to see if the price can be maintained around 0.4808.
A drop from 0.4808 is likely to touch around 0.3339-0.3719.
-------------------------------------------------- -------------------------------------------
** All descriptions are for reference only and do not guarantee profit or loss in investment.
** Even if you know other people's know-how, it takes a considerable period of time to make it your own.
** This is a chart created with my know-how.
---------------------------------
[UPDATE FTM] Nothing to say. Macro Deviation or still in a rangeFantom is interesting. Let's see what it can do. In this case, It depends only on BTC.

ftm can make a correctionHi, dear traders. how are you ? Today we have a viewpoint to SELL/SHORT the FTM symbol.
For risk management, please don't forget stop loss and capital management
When we reach the first target, save some profit and then change the stop to entry
Comment if you have any questions
Thank You

ftm Breaking Another Bullish Pattern Seems Like getting ready for massive Bullish impulse
Breaking Bullish Flag In h12 Tf Incase Of successful Breakout Expecting 50 to 60% Bullish Move

FTM NEW UPDATEHi, dear traders. how are you ? Today we have a viewpoint to BUY/LONG the FTM symbol.
For risk management, please don't forget stop loss and capital management
When we reach the first target, save some profit and then change the stop to entry
Comment if you have any questions
Thank You

FTM IS VERY BEARISHHi, dear traders. how are you ? Today we have a viewpoint to SELL/SHORT the FTM symbol.
For risk management, please don't forget stop loss and capital management
When we reach the first target, save some profit and then change the stop to entry
Comment if you have any questions
Thank You

Fantom (FTM) formed bullish Gartley for upto 82% moveHi dear friends , hope you are well and welcome to the new trade setup of the Fantom ( FTM ) coin.
Previously we caught more than more than 44% pump of FTM as below:
Now on a daily time frame, FTM has formed a bullish Gartley move for another price reversal.
Note: Above idea is for educational purpose only. It is advised to diversify and strictly follow the stop loss, and don't get stuck with trade
