LONG FTM for 5X to 10X profits long term (2-6 months)$FTM is a very bullish lower cap coin. The coin definitely gives a BULL RUN when BTC STABLE and ALT Season Starts. In the previous 7 days, $FTM came back from 0.21 to 0.31, which means a 50% Gain already.
I could hold FTM for the Long term and my target will be 1.45 USDT, 1.69 USDT, 1.92 USDT
I am very bullish and expecting more than 10X profits from it with 2 to 6 months' hold
Let me know your thoughts
FTMBTC


Fantom (FTM) formed bullish Gartley for upto 1808% big moveHi dear patrons, hope you are well and welcome to the new trade setup of the Fantom ( FTM ) coin.
Previously we had a nice trade of FTM:
Now on a monthly time frame, FTM has formed a big bullish Gartley pattern.
Note: Above idea is for educational purpose only. It is advised to diversify and strictly follow the stop loss, and don't get stuck with the trade

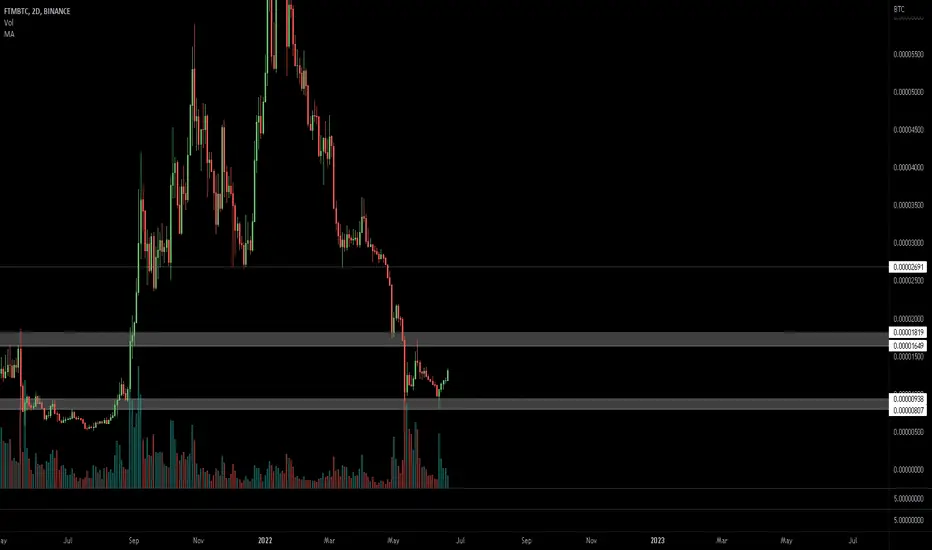
$FTM, Trying for 1800 sats as the first important level$FTM UCTS signaled a new 1D Buy (up 13% since entry) on yesterday's close
I believe it is time for a relief bounce, which has not occurred this year.
Trying for 1800 sats as the first important level #FTM

FTM SHORT Set up to 0.20FTM SHORT SETUP
ENTRY 0.245
T1 0.23
T2 0.22
T3 0.214
T4 0.19
ST 0.255
manage your R;R according to your postion

Fantom (FTM) - June 19hello?
Traders, welcome.
If you "follow", you can always get new information quickly.
Please also click "Like".
Have a good day.
-------------------------------------
(FTMUSDT 1W chart)
Below 0.6947 is likely to be a mid- to long-term investment area.
So, whether it can move higher than 0.6947 is the key.
(1D chart)
Whether or not it can rise above 0.26 to receive support is an important key.
In the short-term and medium-term perspective, it needs to move above 0.4254 to turn into an uptrend.
It appears to be entering the realm of long-term investments, falling below 0.26.
Therefore, if you want to invest in this coin in the mid- to long-term, it is possible to increase the number of holdings corresponding to profits through short-term transactions.
In the short term, you should buy when it falls and when it rises higher than the purchase price, you need to sell as much as the purchase principal (+ transaction fee X 2) to increase the holding quantity.
To do this, if you have to do it with a small amount, you need to buy in 10 installments or more.
It is important not to hold the purchase amount by increasing the number of installments by selling when you can.
These trades should continue until they turn into an uptrend in the short and medium term.
If you look at the current chart position, it is a position that has merit in terms of price.
However, it is not easy to trade as the price is likely to fall further.
However, if you do nothing, you will likely end up buying at a higher price point, so I think it's a good idea to start trading the way I've been told above.
------------------------------------------------------------ -----------------------------------------------------
** All indicators are lagging indicators.
Therefore, it is important to be aware that the indicator will move accordingly as price and volume move.
However, for the sake of convenience, we are talking in reverse for the interpretation of the indicator.
** The MRHAB-T indicator used in the chart is an indicator of our channel that has not been released yet.
** The OBV indicator was re-created by applying a formula to the DepthHouse Trading indicator, an indicator disclosed by oh92. (Thanks for this.)
** Support or resistance is based on the closing price of the 1D chart.
** All descriptions are for reference only and do not guarantee a profit or loss in investment.
(Short-term Stop Loss can be said to be a point where profit and loss can be preserved or additional entry can be made through split trading. It is a short-term investment perspective.)
---------------------------------

SHORTS ALL DAY BAYBEE! (The bulls are crying lol)If you’re still trying to go long against such heavy selling pressure then prepare to get absolutely rekt, my friend. No bottom yet.


FTM to FlyFTM breaks the local resistance and It is now on Uptrend zone again
If BTC stay above 30500, we will see FTM at around 0.43 USD soon

FANTOMFTM/USDT is now on support zone maybe will test resistance and will go down or breakout and drop down

FTM USDT UPTRED BREAKOUTWe are in LONG UP TREND... IF BTC is stablises on 32K on monthly close, we will see a Bull Run.

FTM/USDT BUYING SETUPvalid retest and EMA 20 & EMA 50 golden cross potential pump movement
Buy zone : 0.427 - 0.388
Target : 0.4523 - 0.4784 - 0.5219 - 0.5643 - 0.6133
Stop : 0.37

FTMUSDT - SETUPFTMUSDT price getting resistance from EMA 21 trading into a Symmetrical Triangle and holding the Higher Low. So we are expecting that if bulls get sentimental support from the market Fantom can print a good upside rally. Keep following the price action.

FTM/USDT BUYING SETUP$FTM Look's like make a bullish pennant. big volume on support , close with bullish enqulfing on support line. Potensial breakout
Buy zone : 0.365 - 0.34
Target : 0.3817 - 0.3994 - 0.4348 - 0.4747 - 0.5233
Stop : 0.32

FTM how about this possible move?How about this possible move for FTM. As ever, relies on bitcoin behaving.
Similar setup on ALICE coin which i will also post.
FTM/BTC @ support on higher time frame.

FTM APPROACHING RESISTANCE LEVELS Here is what I see that might be happening with fantom:
1) We are below the 200 ema, the ema ribbon, and the ichimoku cloud on the daily timeframe. Not a great sign, BUT we have managed to test the ema ribbon quite frequently during this downtrend, so we could very well break above it soon as the more often support/resistance is tested the more likely we are to break it.
2) If we do break the EMA ribbon to the upside we will again be testing the up trending zone of resistance we recently rejected from (red box). This has been used as strong support in the past and has already been used once as relatively strong resistance.
3) We have a relatively large red ichimoku cloud above us which isnt great, but for the past year or so we have been in relatively sideways price action, where the ichimoku cloud isn't as powerful.
4) If we do manage to get rejected from the ema ribbon, especially since volatility looks relatively weak right now, we could move to the bottom of the green box. This green box has acted as strong support/resistance in the past, so I would expect to find at least a bounce from the bottom of the box.
5) As of now, I am relatively bullish on this on the short term, especially if bitcoin keeps rising. FTM really needs to break the resistance ahead of it though or else it could send us lower.
6) This is not financial advice and always do your own research before entering the market.

FTMUSDT - SETUPFTMUSDT price again reached the buying zone for bulls, can bullish activity start in FTM? We are expecting the bulls may take control for some time. Price may move towards some good upside resistance areas. So keep watching the price action.

Dont give up on Fantom yet $FTM $1 is a great technical and psychological support.
The closer you can buy, the better off you would be.
You need to understand when $1 support is broken. you need to exit
Cheers,
Nav

FTM good to buy Here you can see FTM fall down 1.20 USDT because of BTC. Actually, Altcoins fall down if BTC continuously breaks every support.
Here is the best position to buy FTM at 1.15 USDT to 1.05 USDT . This is the accumulation zone for FTM.
My target will be for take profits on FTM :
1st Target: 1.28 USDT
2nd Target: 1.41 USDT
3rd Target: 1.72 USDT
The price will start up when BTC gets its stable position
Write down to know about your opinion

FTM fully gasoline okay
here we go with FTM
loss 1$
or
earn 18$
it's up to you
plz put SL its important


👻 FTM Bearish 📉FTM has been in this bear flag/uptrend and is now looking to possibly break to the downside.
I will be looking for short plays on this once we get a confirmed break downwards with a candle close below support.
