Ftmusd

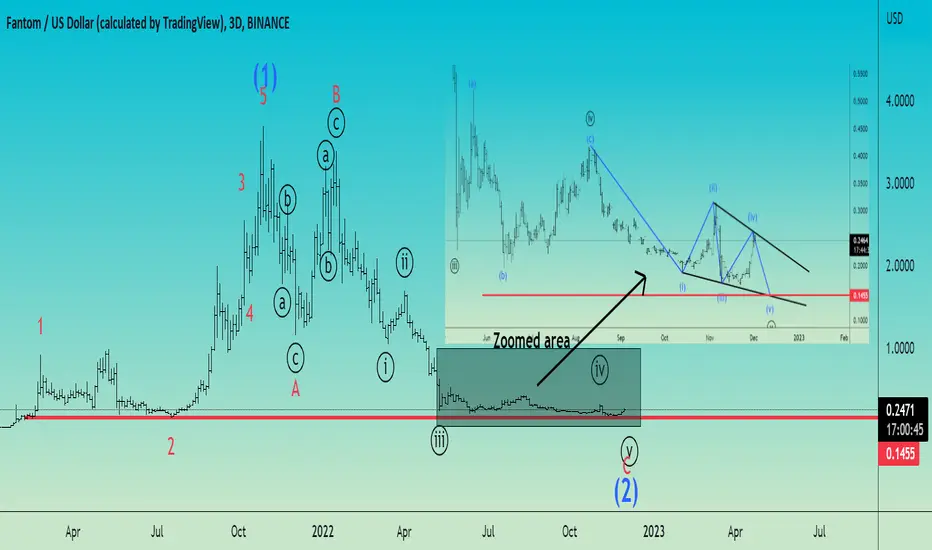
FTM/USDT Elliott Wave count 3D TFFantom may drop soon to end a 5th subwave from a 5th wave of a C wave from an extended flat correction that probably is wave 2.
What I expect next is a downward movement of the price to the 0.1455 zone marked by fib projection 3 vs 4 that you see in the zoomed picture of the last price action moments to complete this 5th wave from an ending diagonal .
I think that soon we will have the end of wave 2 and the Fantom will start the formation of wave 3 from a higher degree.
At this time I expect this wave 3 to start from 0.1455 zone where probably we will have the bottom of the correction.
I will stay short untill this ending diagonal is completed!
I have also a scenario with wave 4th a triangle but I will put it as a comment so as not to clutter the view but the overall things are bearish .
If you like my analysis please hit the like button and subscribe for future elliott wave counts!
Good luck!
FTM SHORT SETUPHello, dear traders. how are you ? Today we have a setup to SELL/SHORT the FTM symbol.
For risk management, please don't forget stop loss and capital management
When we reach the first target, save some profit and then change the stop to entry
Comment if you have any questions
Thank You

FTM time for a small pullbackFTM is at a pivotal point which gives us a great risk reward trade.
i am setting 3 short orders at
0.2425
0.2440
0.2480
I have 3 take profi points as well.
0.2402
0.2385
0.2352
Stop loss if 1h candle closes above 0.2480 so keep an eye on it.
max loss 1%
max profit 4%
LEV x2
( while writing this post,i got in at first entry,but you can set the orders,it is still valid)
FOLLOW FOR MORE

The next resistance levels!FTM has recorded very good growth in the last 24 hours. Its price, which was above the resistance level of $0.20 with increasing demand, continued to move upward yesterday and today. The next resistance levels that we can consider for FTM are in the range of $0.26 and $0.29-0.31. . Fantom is still bearish on the daily time frame, and the resistances it targets could come with a reaction. But in the 4-hour time frame, the trend is upward, and the pullback towards the supports can bring signs of support again for the short term.

Fantom (FTM) - November 29Hello?
Traders, welcome.
If you "Follow", you can always get new information quickly.
Please also click "Boost".
Have a good day.
-------------------------------------
(FTMBTC 1W chart)
It must rise above 0.0000 1374 to gain the strength of the rise.
--------------------------------------
(FTMUSDT 1W chart)
The key question is whether the price can sustain the move above 0.3339.
(1D chart)
The key is whether the price can sustain above 0.2280 to break out of the downtrend line.
If not, you should check for support around 0.1799.
-------------------------------------------------- -------------------------------------------
** All descriptions are for reference only and do not guarantee profit or loss in investment.
** If this chart is shared, you can use the indicators normally.
** The MRHAB-T indicator includes indicators that indicate points of support and resistance.
** HA SRRC indicators are displayed as StochRSI (line), RSI (columns), and CCI (bgcolor).
** The CCI indicator is displayed in the overbought section (CCI > +100) and oversold section (CCI < -100).
(Short-term Stop Loss can be said to be a point where profit or loss can be preserved or additional entry can be made by split trading. This is a short-term investment perspective.)
---------------------------------

FTMUSD ❕ under the resistance zoneRSI chart is in the bullish zone (4H, 1H and 30m TF)
Price is testing 200EMA as resistance (4H TF)
Fantom has already broken through the recently successful resistance zone.
If the asset quickly and successfully breaks through the mentioned resistance zone, I expect further price growth.

FTM has held its key support!FTM has held its key support in the $0.17-$0.19 range for the past few weeks and has moved back towards the $0.20 target as a positive divergence has formed in line with last week's formation. In the 4-hour period, the price trend is still in the range, and the resistance that we can consider is in the range of $0.193 to $0.200. Several negative reactions to this resistance have caused the trend to range.
If you look closely at the chart, the midline of the drawn descending channel has also overlapped with this range, which shows the strength of this range in the lower time frames. If this resistance is broken, support from buyers is needed to bring the price back above the $0.210 level. Otherwise, there is a possibility of fake breaking the resistance of $0.20 and returning to the main supports. But if the resistances are broken, and we see price consolidation, Phantom will find the potential for the price to rise to the top of the descending channel in the $0.25 range.

FTM is Long 👑Hello TradingView community 🚀 and my followers, please if you like the ideas, don't forget to support them with likes and comments, thank you very much and here we go.
Today I want to talk to you about the FTM chart.
At the moment price break the structure.
Then, I think FTM breaks continue to move up to my goal.
My target is located at charts level.
I expect this scenario.
This is my opinion, I really hope it will be useful for you.

Fantom (FTM) formed bullish Shark for upto 11% pumpHi dear friends, hope you are well and welcome to the new trade setup of the Fantom ( FTM ) coin with BTC pair.
Previously I shared a long-term trade setup of FTM , which is still in play as below:
This time on a 4-hr time frame, FTM has formed a bullish Shark pattern. At the moment, after the completion of final leg the priceline has slightly moved up, therefore, we can wait for some correction to buy it from the buying zone.
Note: Above idea is for educational purpose only. It is advised to diversify and strictly follow the stop loss, and don't get stuck with trade

✅TS ❕ ETHUSD: DROP BY 35%✅✅ ETH has fallen.
Now there is a small correction.
After it, we can expect a continuation of the fall.✅
🚀 SELL scenario : short to 1047.🚀
----------------------------------------------------------------------------
Remember, there is no place for luck in trading - only strategy!
Thanks for the likes and comments.

FTM Bullish momentum FTM seems to be in a Bullish Pattern. It will face some rejection between 0.30 to 0.48 USDT. Then we can expect 0.69 to 1.15 USD

FANTOM | Train has left the Station..!!
#FTM Descending Channel Upside Breakout & Retest Already Confirmed in DAILY timeframe Chart ✅
Expecting 300-400% Bullish Rally in the Midterm (Just Matter of time)
Please like the idea for Support & Subscribe for More ideas like this and share your ideas and charts in Comments Section..!!
Thanks for Your Love & Support..!!

FTM do or die (long term analysis)FTM / USDT
the coin is testing its massive support in confluences with massive downtrend resistance
– A breakout with strong volume here could send this coin up to 1$ (380% from current prices !)
– A breakdown can send it too but to other direction :-) down to 0.04$ (-80% from current prices !! )
Dont predict ..watch the price action here then react after
Best of wishes


FTM STATUSI think we will go up to the OB zone and undergo correction again.
This resistance is FRESH. There is no obstacle to go up to the OB area
Comment if you have any questions
Thank You

Fantom FTM: Detailed Technical ReviewToday you can review the technical analysis on the 1D linear scale chart for Fantom (FTMUSDT).
Fantom price is below the median line in the Keltner Channel which seems to be resistance for a while. I put various Support and Resistance lines on the chart as well as the Ichimoku Cloud which is serving as resistance. RSI, Stochastic RSI, MFI, and Volume are shown in the chart.
If price falls further lower, expand the chart to see lower support lines.
What are your opinions on this?
If you enjoy my ideas, feel free to like it and drop in a comment. I love reading your comments below.
Disclosure: This is just my opinion and not any type of financial advice. I enjoy charting and discussing technical analysis . Don't trade based on my advice. Do your own research! #millionaireeconomics


FTM CAN FALL HARDLYI think this symbol can experience deep drops. I also checked the larger structure

FTM on the hourly showes a breakout upword. FTM on the hourly showes a breakout upword. This is all dependant on BTC of course and right now its on the move. If BTC breaks up this can recover to the $0.30's very fast. Currently FTM sits above the 200 SMA on the hourly. Thats very bullish.

FTMUSDT BREAKOUT SOONFTM is forming a big falling wedge pattern. FTM price is moving inside this pattern since August. Breakout from here will be huge. So buy and add more near the support level.

FTM is going down more FTM is looking bearing...
It's just broken below the neckline of the Head and Shoulders...
If we take the difference between the high and low of the pattern, you'll get the first target of 0.07446.
Most penny cryptos are in trouble as the major Cryptos are leading the pact. And so, with the winter continuing, uncertainty in the market, the collapse of Ethereum after the merge and with Crypto going into a more centralised situation - we can expect the little guys to fall.
FTM is no exception.
