Possible scenario of FTM This is the possible scenario of FTM.
No matter what FTM will give you 10X profits in Bull Season.
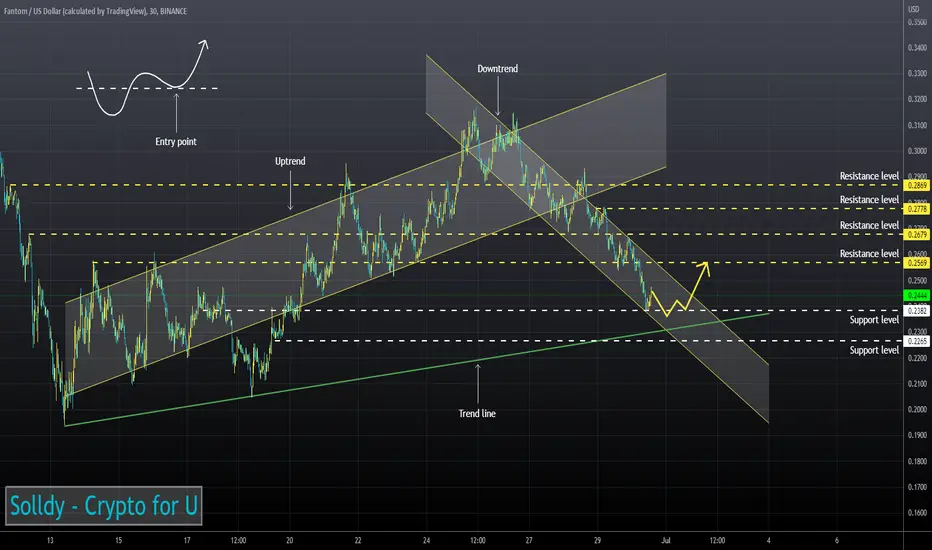
Ftmusd

Fantom FTM Long-term AnalysisHello friends,
I'm going to study long term FTM. It is indeed one of the most robust projects when you look at on-chain data and wallet movements.
We see that the uptrend from 0.0017 USD has been broken and has received a bearish confirmation.
If we consider USD 0.0106 as strong support, we have reacted as both trend and 0.5 fib support.
But do not be in a hurry to create a new uptrend.
The area where it will be accumulated is very important.
Finally, if we close below the green support channel, the support points that buyers and liquidation hunters are waiting for are indicated on the chart.
In order to create a possible bear flag from here, we can expect an increase to 0.72 cents.
It creates the opportunity for a person who wants to accumulate from this region to sell half of it twice.
Those who bought at the Fib 0.5 support sold half of the doubles. For accumulation, my advice is to wait for positive dissonances and support points that may occur in the 4H graph.
Don't worry, if you're patient, it won't flight without you. If you are inside at the right time, you will be the most profitable.
I wish you good luck.

FTM - THIS Altcoin can Easily +460%Hi Traders, Investors and Speculators📈📉
Ev here. Been trading crypto since 2017 and later got into stocks. I have 3 board exams on financial markets and studied economics from a top tier university for a year.
Here's an altcoin that I believe has parabolic potential - Fantom . FTMUSDT is no stranger to parabolic bullish cycles. In fact, if we take a look at previous fractals, it almost appears that FTMUSD has a parabolic run every single cycle! As noted in the video, I anticipate some more range trading before we see some serious price movement.
If you're interested in a quick overview on the stock market, check out this post on SPY . This covers the latest news and a very important update on the S&P 500 :
Also, if you have wondered about Bitcoin and what phase we're currently trading in, check out this idea on the Wyckoff Method:
Related news highlights across the markets :
📢 Binance CEO CZ files a defamation lawsuit against Bloomberg
📢 US POTUS Biden says "in his view" there will not be a recession
📢 The SEC charges former US Representative Stephen Buyer with insider trading
📢 Ripple XRPUSDT partners with FOMO Pay for cross border treasury flows
📢 Coinbase is under SEC investigation over unregistered cryptocurrency listing
💢 ...The SEC sure has been busy 🙄
_________________
👀Follow us here on TradingView for daily updates and trade ideas on crypto , stocks and commodities 📉
Hit like & Follow 🔔
We thank you for your support !
CryptoCheck

FTM/USDT Elliott Wave countFantom ended an abc correction to the upside and now formed a wave A or 1 to the donwnside

FTM Double Top - 4H ShortFTM has made a double top on the 4H chart so I am starting a short position here.
ENTRY - $0.35
TP 1 - $0.3057
TP 2 - $0.2895
TP 3 - $0.2733
SL - $0.420
After TP 3 leave the rest to go on to the bottom of the channel and / or beyond.

FTM/USDT strong buying opportunityWe are about to go long on FTM as it is one of the strongest buying opportunities, in the mid and long term. Trendline must hold!

✅TS ❕ FTMUSD: several peaks✅✅FTM has formed several peaks in the area of the resistance level. I expect a bounce down.✅
🚀 SELL scenario: short to 0.288.🚀
----------------------------------------------------------------------------
Remember, there is no place for luck in trading - only strategy!
Thanks for the likes and comments.

FTM next target $0.43FTM has very Good News Ahead ! So, $FTM is pumping daily and
In the long run, it is Very Easy to Take 10X to 15X profits from $FTM in the next Run.
According to the last run, FTM gained 70% from its bottom 0.21 USDT.
So, I can see FTM very bullish in LONG RUN at the target
0.43 USDT,
0.69 USDT,
1.05 USDT,
1.52 USDT,
1.72 USDT,
1.81 USDT and
3.50 USDT+ sure

Fantom FTM - Time for the bullish action! Elliott Wave + 200 MA
On the daily chart we have an impulse Elliott Wave that has been completed and because of that, I expect an ABC retracement to the upside!
A very strong resistance is at 1.13 - 1.00 USDT, we have a great confluence in this zone as you can see on the chart.
Confluence: start of the gap + end of the wave 1 + end of the second wave 1 + 0.618 FIB retracement + 200 daily MA + psychological level 1.00 USDT.
Price is printing a local descending channel and if bulls can break through this channel, then we can definitely go higher!
Overall structure on the daily chart is bearish and I recommend only a short term counter trade here.
I expect tremendous pumps for selected altcoins, you can find them in the related section down below ↓
For more ideas please hit "Like" and "Follow"!

✅TS ❕ FTMUSD: bounced off✅✅FTM bounced off the resistance level twice. I expect a fall.✅
🚀 SELL scenario: short to 0.288.🚀
----------------------------------------------------------------------------
Remember, there is no place for luck in trading - only strategy!
Thanks for the likes and comments.

FTMUSD ❕ Is it the end of declining?Fantom is moving in an upward channel within the liquidity zone.
Trading volumes show uncertainty.
Price has tested 100MA as support.
FTM has moved into the bullish zone RSI (30m TF)
I expect the continuation of growth after fixing above the resistance level.

FANTOMFTM/USDT We are watiching we have a BIG Resistance on Fantom resistance is on our Blue Zone Supply Touched and start to drop down now im waiting if the coin will broke Support in Yellow and to take SHORT Signal into our DEMAND ZONE
Disclamer:
We are not financial advisors. The content that we share on this website are for educational purposes and are our own personal opinions

Fantom FTM short Entry Range, Take Profit and Stop LossFTM/USDT short
Entry Range: $0.30 - 0.38
Take Profit 1: $0.27
Take Profit 2: $0.23
Take Profit 3: $0.19
Stop Loss: $0.43

FTMUSD - SHORTHey guys. Some distro happening. Could be accumulation but it doesn't look promising.
SHORT TP: $.06
EZ clap :)

✅TS ❕ FTMUSD: in a downtrend✅✅FTM continues to move in a downtrend. The price has formed a new low. I expect movement to the support level.✅
🚀 SELL scenario: short to 0.21.🚀
----------------------------------------------------------------------------
Remember, there is no place for luck in trading - only strategy!
Thanks for the likes and comments.

FTM Possibility to LongFTM seems to retest the 0.33 USDT , the 1st resistance, then 0.37 USDT and 0.43 USDT
Before that FTM needs to break 0.29 USDT THE LOCAL RESISTANCE


Fantom (FTM) - July 2hello?
Traders, welcome.
If you "follow", you can always get new information quickly.
Please also click "Like".
Have a good day.
-------------------------------------
(FTMUSDT 1W chart)
Whether or not it can move higher than 0.6947 is crucial.
To do this, it is necessary to check whether it can be supported above 0.0160.
(1D chart)
The key is to find support and move higher above 0.2600.
If not, it is likely to lead to further declines.
When a wiggle up and down to the 0.3438-0.4254 section, it is expected that the ascent will begin to rise above 0.6947.
------------------------------------------------------------ -----------------------------------------------------
** All indicators are lagging indicators.
Therefore, it is important to be aware that the indicator will move accordingly as price and volume move.
However, for convenience, we are talking in reverse for the interpretation of the indicator.
** The MRHAB-T indicator used in the chart is an indicator of our channel that has not been released yet.
** The OBV indicator was re-created by applying a formula to the DepthHouse Trading indicator, an indicator disclosed by oh92. (Thanks for this.)
** Support or resistance is based on the closing price of the 1D chart.
** All descriptions are for reference only and do not guarantee a profit or loss in investment.
(Short-term Stop Loss can be said to be a point where profit and loss can be preserved or additional entry can be made through split trading. It is a short-term investment perspective.)
---------------------------------

FTMUSD ❕ strong levelsFantom holds a strong support level.
TD Sequential - up reversal signal (30m, 1H and 4H TFs)
Price has exited the oversold zone of the RSI (30m and 1H TFs).
BB indicator - the asset is oversold (4H TFs)
I expect that FTM may retest the support level, but after fixing above it will start to bounce.
LONG FTM for 5X to 10X profits long term (2-6 months)$FTM is a very bullish lower cap coin. The coin definitely gives a BULL RUN when BTC STABLE and ALT Season Starts. In the previous 7 days, $FTM came back from 0.21 to 0.31, which means a 50% Gain already.
I could hold FTM for the Long term and my target will be 1.45 USDT, 1.69 USDT, 1.92 USDT
I am very bullish and expecting more than 10X profits from it with 2 to 6 months' hold
Let me know your thoughts

FANTOM PATH TO $10 MINIMUM..Fantom shows strenght for a next wave to ATH. Still looking at the project a minimum of $10 should be achievable.

