FTM going further down?- Rejected from 21 EMA
- Descending triangle
- Support held four times, making it weaker every time
Could see a breakdown into the golden pocket or the next support area around $1.55
Ftmusd

FTMUSDT Fantom big image.
Bullish view. FTM need to be break the all time high to turn bullish.
Bearish view. There's alot of rooms for bear. There's an rising wedge on FTM. If we break the rising wedge down side than the ftm target would be 0.05. Everything clear at the chart.

FTM, FANTOM, DAY TRADING, SIGNALWatching $FTM closely on the 4H chart. Waiting for directional confirmation before trading this one

FTMUSDT - Trend Breakout!FTMUSDT (4h Chart) Technical analysis
FTMUSDT (4h Chart) Currently trading at $2.11
Buy level: Above $2.15
Stop loss: Below $1.85
TP1: $2.42
TP2: $2.73
TP3: $3
TP4: $3.35
Max Leverage 3x
Always keep Stop loss
Follow Our Tradingview Account for More Technical Analysis Updates, | Like, Share and Comment Your thoughts.

Simple but smartHi guys
The downtrend line is broken, while the triangle pattern is formed and the price is pulling back. There is an expectation of price increase and decrease in the specified ranges.
what is your opinion?
Do not pay attention to shadows
If you have any questions, I will be happy to answer☺️
This analysis is a personal analysis and is not a buy and sell signal, so it is the responsibility of the person to buy or sell
This analysis (to determine the profit margin) will be updated here 🔄
Look at our past analyzes to trust us
If you liked this analysis, like and follow🙏

$FTM Fantom 4H chart update these lines have been good
missed the first break of key trendline
managed to capture some ltf trades only from late 2.3s
$AVAX $NEAR updates next

Simple but smartHi guys
A precise pattern has been formed. Given the support of Bitcoin, we can expect this resistance to be broken
what is your opinion?
Do not pay attention to shadows
If you have any questions, I will be happy to answer😊
This analysis (to determine the profit margin) will be updated here 🔄
Look at our past analyzes to trust us
If you liked this analysis, like and follow🙏

Moving FTM buying zone downFtm has pumped up a lot recently and now its is disturbing and this will the perfect time to scoop it more, so waiting for it to come to our buy zone. Ftm can shot up to $100 like Sol and Luna

Simple but smartHi guys
Support is valid. It can be a buy signal until this support is broken. But if this support is broken, getting shorts is a better option
what is your opinion?
Do not pay attention to shadows
If you have any questions, I will be happy to answer☺️
This analysis (to determine the profit margin) will be updated here 🔄
Look at our past analyzes to trust us
If you liked this analysis, like and follow🙏

FTM Fantom: 1D Chart ReviewHello friends, today you can review the technical analysis idea on a 1D linear scale chart for Fantom (FTMUSDT).
The chart is self-explanatory. There are many bearish signs so be careful when considering to trade Fantom. Keep an eye on the key support line as well as the 200D simple moving average.
Included in the chart: Trend line, Support and Resistance Lines, Ichimoku Cloud, VPVR ( Volume Profile Visible Range), Volume, RSI, MFI (Money Flow Index), Dead Cat Bounce.
If you enjoy my ideas, feel free to like it and drop in a comment. I love reading your comments below.
Disclosure: This is just my opinion and not any type of financial advice. I enjoy charting and discussing technical analysis . Don't trade based on my advice. Do your own research! #cryptopickk

FTM 1D Not a bad option for investing even nowToday we will analyze several possible movements of FTMUSDT price in future.
This trading pair will be 1 of 3 that you chose by voting in our recent BTCUSDT idea
The situation on crypto-market and stock market is so ambiguous now, that it would be wrong to argue for price movement up or down. We are trading probabilities... Only to the right, the price moves with confidence)
Positive points about the Fantom price :
September's fall in the crypto market formed point A, December's point C (which is above point A). FTM cryptocurrency performed very well during the recent fall. While the price of BTC and most alts updated their lows, the price of FTMUSD corrected only 50% of the previous C-D upward momentum. That is, it has not updated the minimum of the previous growth impulse.
Such inputs suggest that the FTMUSDT price consolidation is now at the final stage, as the price is getting higher and higher on corrections and the upside breakout is somewhere near.
Maybe, there is still some fundamental news that stimulates not to sell FTM, please write about it in the comments.
If the BTCUSDT price will hold above $34200-34300 in the next few days, FTMUSD should not break below $1.73-2.00 either.
From there, the way would open first to the ATH area of $3.40 , and then a breakout to $5.50-5.80 is also possible.
Also in the previous BTCUSDT idea, we wrote that if the price follows the fractal, then before the further upward movement, a possible breakout of stops, by shedding the price to $31500 is not excluded.
The price of FTMUSDT in such a case may squeeze down, but not below $1.32, where you can put buckets to buy, in this case they can fill up.
Globally, such a scenario could end up drawing a "Triple Top" pattern
The critical support zone is the range of $1.17-1.32 . Below this range, FTM holders nerves may give up, and mass selling will begin. Stops of the whole consolidation are also hidden below $0.90-1 , and their activation may lead to a strong price spill-down, down to 0.44 cents .
Probably the most conservative option can be called - blue - it is a smooth continuation of the consolidation in a wide range and as a result the maximum growth value to the area of $13 in the summer of 2022.
_______________________________
Since 2016 , we have been analyzing and trading the cryptocurrency market.
We transform our knowledge, trading moods and experience into ideas. Each "like under the idea" boosts the level of our happiness by 0.05%. If we help you to be calmer and richer — help us to be happier :)

FTMUSDT, This route can be happenHello everybody
In these days you hear about FTM very much, TVL is rising up, it wanna do ... , Do you know anything about Fantom ? Whats SDK ?
If you want to learn Fundamental & Technical analysis send us messages in private ---> Our id is in profile
According to the chart and last analysis, exactly both of the target was reached and we expect the price has some pullback and recover it self then ready to go up and reach to the 3rd target but the condition of market changed and the market fall down and you see what was happend in the market.
At this time according to the price and trend of the price that is downward we expect the price should rise up a little then its ready to dump again and maybe can break the trendline support zone area.
The most important thing is tomorrow we have event of FEDERAL RESERVE RATE and this is the most important event for all markets that can highlighting the markets.
Guys one point for anyone for your self, PLEASE GO AND LEARN MARKET
Market is not technical is not fundamental is not ... market is all of them
If you wanna make money from the market you should have to work and learn from a trader and you should have a teacher for trading.
Buy packages a lot because when you buy different packages you will become familiar with different view of how you can take profit, how you can trading and whats gonna do when ... this happen ??
All of my advice is for you guys, its take long time that i can be here like this i want to help everyone that want to be a trader
Good Luck buddies
Abtin
Previous analysis :

Fantom (FTM) looking strong despite global pressureFantom (FTM) looking strong despite global pressure.
The RSI support proved as valid another times - very nice.
What do you think? Can we see an ATH? 😎
Drop me a nice comment if you'd like me to analyze any other cryptocurrency.
*not financial advice
do your own research before investing

FTM, FANTOM, FUTURE, DAY TRADING, SIGNAL$FTM had a good 17% rebound but still a little way to go. The support at around $2 has been strong but we need to reclaim $2.48 before it can turn bullish #Fantom #DeFi #Alta

FTM rebounds after declines.The FTM remains above the uptrend line. The price has rebounded after the recent decline and is hovering near resistance at $ 2.38. Breaking the current level could be an impulse to increase to around USD 2.58.

FANTOM ECOSYSTEM (Request)- FTM is one one of the big winner in this bullrun, the price seems low in price, but i checked many indicators and noticed that FANTOM was bullish 80% of the time.
What is the Fantom ecosystem?
The Fantom Foundation is building a highly scalable blockchain ecosystem that facilitates decentralized, scalable, and secure technologies. Fantom is a fast, scalable, and secure layer-1 platform built on an aBFT consensus protocol. Dyor it if you want to know more about FTM.
- Basically, i don't see this coin retracing for now, but like always, all depends on TheKing. So manage your % investment.
----------------------------------
Trading Plan
----------------------------------
- Buy : Now
- Rebuy : 2.5$
- Rebuy : 2$
TP : 4.95$
----------------------------------
- Check in comments for Older Analysis.
Happy Tr4Ding!

Simple but smartHi guys
It has lost a very credible channel and is completing the pullback. According to the Bitcoin chart, we can expect a price reduction
Do not care about shadows
what is your opinion
Please like and follow for support 🙏

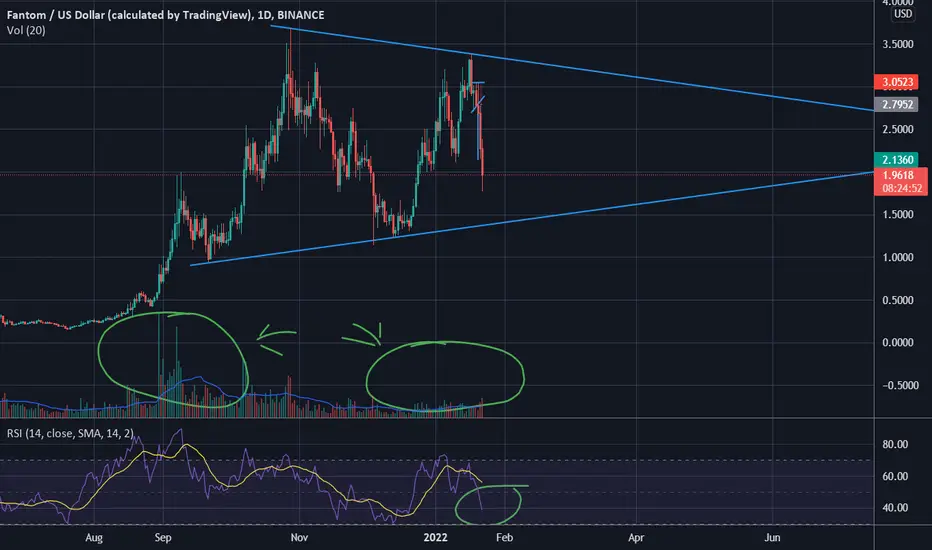
DONT FREAK OUT!! FTM is still in consolidation.On the longer term chart we can see that FTM is still in a bullish consolidation pattern. Even though we had a decent drop this is the best thing that could've happened for fantom on the long term. If we can get a third confirmation of the lower trend line as well as the upper, this pattern will be confirmed. Remember though, even confirmed bull flags only break bullish 60-70% of the time. Patterns can fail and do all the time.
I expect FTM to break out of this pattern sometime april-june, as these patterns usually don't exhibit breakouts until the price action has moved to about 70% the way through the pattern.
Notice where I have circled the volume. The volume now is much much lower now than it was when FTM was in a rally. This is also supports the idea that were still in a consolidation pattern, however a long-term one.
FTMUSD GLOBAL OUTLOOK WITH DAILYFTM/USDT
FTM still strong with Bullish trend
FTM must hold at $1,2 or Trend will change to bearish (ORANGE LINE)
If FTM can hold , can jump to $3,8 ( RED LINE)
Market so bad for now
Please becareful or better wait and see
#tipsfortradingplanning

FTMUSDT >>Regular flatI think Chart is making Regular flat of Elliot wave > wave B retest 90% of A (retestment) effect to wave C end 100% of A (projection)
Short
TP>>1.0700

FTM to $2.13 levelFantom just broke bearish from this continuation pattern which is nestled inside a larger H&S pattern.
FTM also rejected pretty hard right at the top of the red ichimoku cloud.
Both patterns give a target price of around $2-2.2
I am expecting FTM to pull up a bit and touch the trendline it broke out of before continuing to the downside. This would be optimal as it would reset the RSI on lower time frames for a continued downward move.
I have set up on the chart my intended play with take profit and stop loss levels.
This is not financial advice. Trade at your own risk.
*NOTE* If fantom does not retest the trend line I will likely set up a long position after the price target has been reached. FTM needs to do this rather soon or else it will continue to fall, in accordance to the ichimoku.

potential FTM long- bullish TK cross
- low RSI
- multiple candle closes in the ichimoku cloud which indicates the candle should close above the cloud
- target is between a resistance and the top of the ichimoku cloud

Fantom longFantom bounced off the support area. Asset bounced off the ascending trendline. Bullish movement to resistance level at 3.38 is expected to happen.
