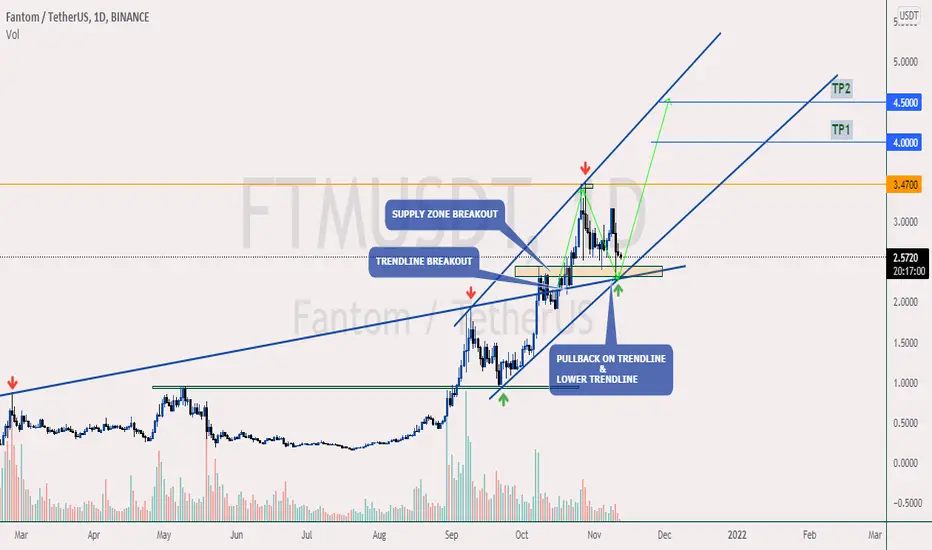
💥FTM IS READY FOR NEW ATH AT $4 & $4.5Please support this idea with a LIKE👍 if you find it useful🥳
We have more two bullish confirmation on this chart right now.
First is an upward breakout and a pullback from the trend that started around March 2021.
Second is supply zone breakout to ATH and a pullback to the zone as a demand zone.
Another bullish confirmation is price rejection at the lower trendline of the ascending broadening triangle.
With these three bullish confirmation, I expect price to rise to a new ATH at $4 & $4.50.
What do you think?
Share your opinion in the comment section✍️
Follow me to receive more updates on FANTOM (FTMUSDT ) 🤗
Happy Trading💰🥳🤗
Ftmusd
FTM/USD FANTOM Fifth wave Target $6.00 Fantom looks like it is completing the 4th wave and may touch $1.90 before next move up to about $6.00 and possible blowoff top of $8 depending on how aggressive Bitcoin runs. Indicators are pointing to a short term correction maybe over the next week or so then onward and upwards to the top of wave 5 before any kind of consolidation correction. I will revisit when we get to that point and see if there is more steam left of if it has topped out. Thank you for checking out my charts and if you have any charts you would like me to look at let me know and I will do a chart analysis on it. Not financial advice just my opinion.

$FTM bullish viewFantom has the potential to reach $16 and above. It depends on a few things such as the overall marketcap moving higher, BTC moving higher and continued momentum behind the project.
This had to be a short video, my dinner is ready,

#FTM Fantom Lower High on DailyFantom (FTM) on the 1D chart shows a lower high. I charted a few trendlines to consider keeping an eye on along with a fib retracement.
What are your thoughts? Comment below, hit the like and follow me. Thank you!
Disclosure: This is just my opinion and not any type of financial advice. I enjoy charting and discussing technical analysis . Don't trade based on my advice. Do your own research! #cryptopickk #bitcoin #altcoins

FTMUSDT : WILL FTM HIT 10$ SOON ? Fantom is a highly scalable blockchain platform for DeFi, crypto dApps, and enterprise applications.
Described as an acyclic graph (DAG) smart contract project which offers decentralized finance (DeFi) services to developers utilizing its own bespoke consensus methodology.

✅FTMUSDT - Spike as planned ! and new SLBYBIT:FTMUSDT
-
If you're following the trading strategy as below, you must have a nice profit right now.
-
Due to a M pattern formed before, resistance might be around here.
Therefore, I set a new SL $3.0040 to protect your unrealized profit.
You can still set the original SL $2.5505, all depend on the risk you wanna take.
Have a good day!.
-
If you like this analysis, smash the like button and leave a comment below to share your thoughts
or let me know what crypto you want to see!
Trading is a reflection of yourself. Learn more daily and be ready for every opportunity.
Have a nice trading!

FTM 12h How much more strength and enthusiasm do buyers have?Trading pair FTMUSDT is probably one of the few, which in the last month is only growing, relentlessly, despite the trading maneuvers of the pair BTCUSDT.
Let's try to understand what is happening now on the FTMUSD price chart.
We can assume that an expanding triangle was forming on the chart from March to August, but usually such a pattern is formed on global highs or lows for a trend reversal.
But on this chart, the price of FTMUSDT confidently broke through the upper boundary, and on the sharp correction of the crypto market on 07.09.21, the price of FTM fell by 39%. On the one hand — this strong fall eliminated a large number of margin positions, but on the other hand — this fall was sharply bought off and looks like a retest of the upper boundary of the triangle for strength.
The growth in the FTMUSD has been going on for quite a long time and without a pullback, so it is worth suggesting several possible developments in the future:
1) if the buyers do not allow the price of FTM to fall below $1.75 today/tomorrow, we can count on the growth to $2.30-2.40.
2) below $1.75 we have a buyers' bastion of protection around $1.13. If the buyers show their activity there for the second time, the consolidation can be prolonged, but the target for the global growth will grow to $5.20
3) The price fixing under $1.13 will mean that the buyers gave the initiative to the sellers, and this in turn will mean the continuation of falling price. The first strong support from the bottom is near $0.55 , and the global fall may finish near $0.30.
_____________________
Do you like the idea fulfilment? Does it help you trade and make a profit?
Do you want more forecasts from us?
Give us motivation! (Like, comment and donate). These little things won't make us rich, but they will warm the trader's soul while writing the next idea!

Bearish signals for bullish coin FTMFantom is truly my favorite coin with 1600x run from the 2020 Covid lows. In March 2020 the Market Cap was some 4.7m (#380), now some 7.2b (#32). That is absolutely amazing.
But how much upside potential is there left? Honestly, I do not know. In this case, it is wise to be aware of the chart signals and be reactive for whatever price action.
First of all, there is a strong dynamic resistance that FTM has not been able to overtake. Thats the higher highs’ trendline that the price action rejected a week ago.
Secondly, there is bearish divergence seen on the RSI and other indicators since early September indicating potential reversal of the price action.
Thirdly, there is a bearish rising wedge from which the price already broke down.
All this resembles the situation in early March. The indicator in the lowest panel, Phoenix Ascending, presents a more or less identical pattern to the present situation. The lines in this 3d TF are heading towards the zone below 50, but they are not there yet. If it plays out like it did between March and May the price would first retrace and then pump to a new higher high (ATH), and after that start retracing again. I see that price pattern (copied over as extension from the present) as one plausible scenario.
I will be observing the price action from the sidelines in the near future, being ready to jump in if necessary.
Trade with caution, take care
Cheers
Whoop

FTMUSDT - The key point for entryBYBIT:FTMUSDT
4H trend chart
-
FTM is building an inverse HS pattern.
We notice that 4H candle never stand firm at 2.875, which is the neckline and Fib(0.618)
If price can break through 2.875 w/o wicks top, trading strategy as below.
-
Profit Targets:
a) 3.49----Fib(1)
b) 3.928~4.105----Fib(1.272~1.382)
c) 4.4845----Fib(1.618)
Stop losses:
a) 2.5505-----Red horizontal ray
-
If you like this analysis, smash the "like button" and leave a comment below to share your thoughts
or let me know what crypto you want to see!
Trading is a reflection of yourself. Learn more daily and be ready for every opportunity.
Have a nice trading!

FTM! Swing We might see the previous resistance become support.
MR. Mark CUBAN started to invest in FTM! Shark tank Billionarie.
We been banking this one out. 10TP.
This one Falls In our research on swing set ups with a good ratio of Risk and Reward.
As always we put quality over quantity, don’t forget to follow us for SWING trades research on risk and Reward Ratio.
Subscribe and don’t miss OUT the next research.
Swing trading is great because you can create a lot wealth in % by risking less $$. Compound Gains.
Thank you for the Love, I really appreciate those likes, makes a difference and pushes me to keep on posting more of these!

FTM/USDTesting/tracking elliot wave theory. Please do not trade off idea without S/L. Not financial advice.

FTM is gonna reach 3.4$?Hi every one
FANTOM / TETHERUS
FTM has formed a big Bullish Flag! This pattern can Increase the Price as much as the measured Price movement which in Flag patterns are the Flag Pole! so we can See FTM even at 3.4$! There is no Break out yet, But when It happens we can see FTM create a New All Time High!
Summery:
-Bullish Flag can Increase the Price of FTM up to 3.40$
-No break out, No confirmations!
💎Traders, if you liked this idea or have your opinion on it, write in the comments, We will be glad.
Things can change...
The markets are always changing and even with all these signals, the market changes tend to be strong and fast!!
Thank you for seeing idea .
Have a nice day and Good luck

FTM to SPEED UPFantom is a fast, high-throughput open-source smart contract platform for digital assets and dApps.
Fantom is about to jet-speed...
FTM at a good support level, find key entry-level, Take profits in the TA
$FTM
Trade safe....
#ftm #e2kclicks

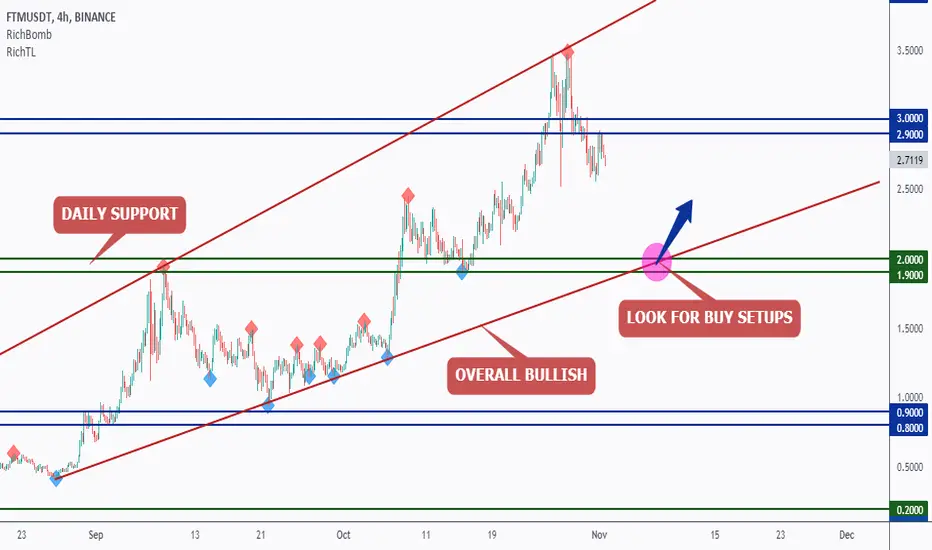
FTM - Trend-Following Setup!Fantom broke below the 3.0 zone... WHAT NEXT?
FTM is overall bullish trading inside our brown channel so we will be looking for Trend-Following Buy setups as it approaches the lower brown trendline.
Moreover, the area 1.9-2.0 is a "Resistance turned into Support".
So the highlighted purple circle with the blue arrow is a very strong area to look for buy setups as it is the intersection of support in green and lower brown trendline.
As per my trading style:
I will be waiting for it to approach the highlighted purple circle (area) to look for possible buy setups (like a double bottom, trendline break, and so on...)
Always follow your trading plan regarding entry, risk management, and trade management.
Good luck!
All Strategies Are Good; If Managed Properly!
~Rich
FTMUSDTThe fantom currency is in a bat pattern that is completing its final wave. According to FiboNachi, the price is expected when the price in the probable area (blue line) reaches the price range of $ 4.


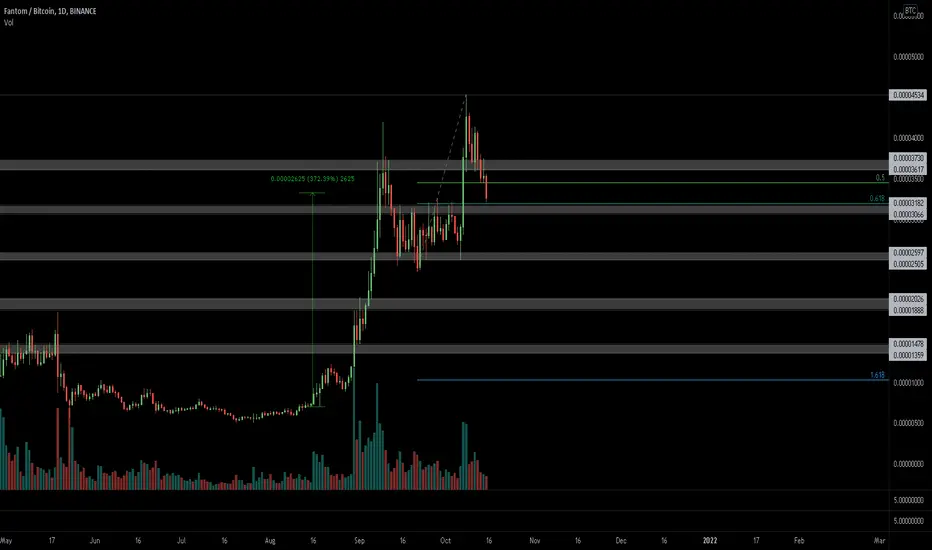
$FTM, One of the few that the UCTS bot is still long$FTM
One of the few that the UCTS bot is still long
Willing to see if its able to hold/flip ~3200 sats that was never retested since the breakout (Matching .618 fib)
Chilling on a ~360% profit since latest 1D Buy signal
Not aiming for tops or bottoms but trends
#FTM
FTMUSDT what a nice Eve Eve double top!Based on the chart I'm guessing that the Fantom will have a downward movement in the next days. The target is on the chart. Although mid-term movement of Fantom is really higher targets but in the next few days (short term) my analyses is a down move.

#FTM Fantom 1D Chart - DOWN WE GO!Simple chart analysis matching up lines on a long term trend. It seems that we are on the top of the rising wedge. Also 1D bearish divergence in sight (using RSI). I also took a look at the last top to bottom of the wedge and it seems about a 50% correction before going back up. I assumed about the same matching up some support structures for the upcoming potential drop. Be careful going long on this.
HIT THE LIKE AND COMMENT BELOW PLEASE. THANK YOU!
CHART ON TRADINGVIEW USING MY AFFILIATE LINK: www.tradingview.com (thank you in advance!)
Disclosure: This is just my opinion and not any type of financial advice. I enjoy charting and discussing technical analysis . Don't trade based on my advice. Do your own research! #cryptopickk #bitcoin #altcoins #ftm #fantom

Fantom is Lunching 🎇🚀After breaking a downtrend and hitting a pullback, the Phantom is ready to move upwards and aim at the charts.
Currently, due to the increase in the bitcoin range and its movements, all altcoins will be affected by it. The analysis is just a series of probabilities.
I hope you find this analysis useful🌹
Follow for more...
#DYOR

FANTOM - Over 1000%! When Will It Stop? 😱From one of our first analysis on Fantom, price has moved up over 1000%! We had a few more analysis posted where you could have got in on the way up.
See the linked charts to see all of our Fantom analysis.
Right now price seems to be respecting the ascending trendline. The best bet would be to watch for price to come back to the trendline and enter with stops below the trendline.
Who knows how much higher Fantom can go!

$FTM /USD, Just 15% away from a new ATH$FTM /USD
Just 15% away from a new ATH
Volume spiked yesterday, willing to see how it will go from here
Either retesting & flipping ~1.5$ area or straight volume toward new highs
#FTM

FTMUSD Riding the trend with risk managementIn order to jump on the ftm we need to have tight stop losses on the higher lows on hourly time frame.
Entry : Current Price
Stop Loss 1 : 3.13
Stop Loss 2 : 2.86
