FTM/USD Looking to Short Not looking to trade perp but instead I'm offloading some of my spots and will re-evaluate when I get a better discount.
Ftmusd

FTM Looks Braish (4H)From where we placed the red arrow on the chart, it seems that FTM has entered the correction phase.
It seems to correct an ABC with a more complex pattern.
Now it seems that wave A and B are completed and the price is entering wave C. Wave C is bearish.
The targets are marked on the chart.
Closing a daily candle above the invalidation level will violate the analysis
invalidation level : 0.7695
For risk management, please don't forget stop loss and capital management
When we reach the first target, save some profit and then change the stop to entry
Comment if you have any questions
Thank You

FTM potential mid/long term view FTM / USDT
Fantom is trying to print huge I H&S on HTF which is great bullish pattern if completed
If my plan succeeds and the pattern is completed …the right shoulder is located between 1.2$ -1.5$ (first TP)
And if we breakout the neck line the next targets zones will be 2.9$-3.5$ and 5$-6.8$ (optimistic)
Note : We bought this coin around 0.48$ area few weeks ago which was a great entry…. price could also pullback again to low 0.6$ - 0.5$ (buy back zone if market provides)
Invalidation: Weekly support must hold to remain bullish

FTM Long Scalp Trade Round 2 (Limit Order)Looks like FTM is very close to touching our 1H and 4H key level.
I'm going to place a limit order here for another round up. It may or may not hit the price so you can adjust it accordingly.
Entry Price: 0.6657
(You can sent the entry a little early if you can afford taking the wider SL.)
SL: 0.6566
(Manage your risk accordingly)
We will keep the same price targets:
TP1: 0.6924
TP2: 0.7149
TP3: 0.7330
This will be a risky trade and will depend on BTC's momentum. But in my opinion, I'm predicting BTC to move sideways for a few days so will just be scalping.
Let's see if the limit order hits.
Good luck and happy Trading!
Note: This is not a financial advise. Just for education and personal growth as a trader. Do your own research.

FTM Long Scalp OpportunityFTM sort of pumped while I was typing this up, but FTM seems to be retesting the 1 Hour and 4 Hour key demand zone and looks good for a long opportunity. to the next supply zone.
We see that previously it has bounced off of these levels and getting a strong buy support.
Entry Price: 0.6724
SL: 0.6610
TP1: 0.6924
TP2: 0.7149
TP3: 0.7330
Some price action will also depend on BTC moves, so manage your risks accordingly.
Good luck and happy trading!

FTM, Flight-to-Moon soon, bound for massive reversal this year!FTM has reached parabolic highs of 1.2 on the first quarter this year after that long hibernation from 2023. From that peak, as with any overheated coin - heavy correction ensues week after week following the market's big red move.
Now, a massive shift has been transpiring this past few days. A break in structure has been spotted. It has broken the ''maximum pessimism'' curve line indicating the first step towards price recovery. Significant price growth will be followed by this elusive break.
Net buying metrics / volume has been surging notably hinting of increased net positioning towards the multiple x growth scenario.
Expect a series of stair ups from this range going forward. Multiple x gain prospect targeting its recent peak at 1.2 zone.
The current price is a definite bargain, an ideal seeding opportunity.
Goodluck.
Spotted at 0.370
TAYOR.

Inverted Head & Shoulders Pattern in Fantom (FTMUSDT)BINANCE:FTMUSDT
As you can see in the chart, it looks like we are confirming an Inverse Head & Shoulders Pattern on the Fantom Token (FTMUSDT). To confirm it, we will need to break above $0.54 USDT, and if we do, it will give us a price target of $0.85 USDT. If you buy it from here, is more than a 100% return. Stop should be at the bottom of august 5,2024 at $0.2575 USDT.
Good luck to you.

Short Trade on FTMthis is my first trade in 2024 , and i wanna short on FTM
the reason behind this trade:
weekly FVG
5 eliot waves
lets see what will happen.
this is not a financial advice .pls #DYOR

#FTM/USDT#FTM
The price is moving within a descending channel pattern on the 12-hour frame and is expected to break upwards
We have a downtrend on the RSI indicator that has been broken upwards and we have a tendency to stabilize above it
We have a major support level in green at a price of 0.300
We have a tendency to stabilize above the moving average 100 which supports the rise
Entry price 0.3300
First target 0.4648
Second target 0.4648
Third target 0.5448

FTM looks bullish (4H)From where we put the red arrow on the chart, it looks like the FTM correction has started.
This correction appears to be a double correction that is over.
We are looking for buy/long positions in the green range.
The targets are clear on the chart.
Closing a daily candle below the invalidation level will violate the analysis.
For risk management, please don't forget stop loss and capital management
When we reach the first target, save some profit and then change the stop to entry
Comment if you have any questions
Thank You

FTMUSDT Bullish Head and Shoulders!FTMUSDT Technical analysis update.
FTM has formed an inverse head and shoulders pattern on the daily chart. The price is now moving towards the neckline for a potential breakout. Once the breakout is confirmed, we can expect a strong bullish move in FTM.
Buy level: After breakout confirmation on the daily chart.
Regards
Hexa

FTMUSDTFTM ~ 1D ✅
#FTM Make purchases gradually after successfully breaking through this resistance line. at least for a minimum increase of 15%++

FTM: FML! If you find this information inspiring/helpful, please consider a boost and follow! Any questions or comments, please leave a comment!
Bounce out of Golden Corner Pocket, reaction off PF median line. 👌
May have one more W4 in there.
Looking for an impulse down and internal retrace, as
always.
Trade Safe,
Trade Clarity.

FTM#FTM / USDT
Price is showing bullish signs:
1- Falling wedge breakout
2- Potential inverse H&S
Conformation:
ema 200 breakout (red dotted line) will be the conformation for trend reversal
Best of luck

Fantom FTM price forming a powerful movementThe #Fantom price has been accelerating upwards quite aggressively for 3 days now.
Now OKX:FTMUSDT is approaching the neck, which is the critical point of the inverted head and shoulders pattern.
And now we have two options:
1️⃣ wait when #FTM price to breakout and consolidate above $0.51 and take a long from there.
2️⃣ or put “buckets” in the global purchase zone of $0.36-0.42, which we wrote about in our previous idea. 👇
Well, the take profit is $1 or $1.8, it depends on your trading strategy and patience)

FTMFTM has surpassed the 0.40 level, indicating a potential opportunity to enter a short position after a retest.

FANTOM (FTMUSDT) Short trade setup in 4H Time frameFANTOM (FTMUSDT) Short trade setup in 4H Time frame
Short entry at $0.4513
Profit target of $0.4 reached
Target 2: $0.3169
Target 3: $0.2338
Target 4: $0.1825
Trailing stop loss: $0.4630
Good luck! and do follow to motivate me and support my work.

Fantom (FTMUSDT) Bullish - 1st Target Done!Fantom coin (FTMUSDT)
Got an entry at 4049
Stoploss - 3322
Trailing Stop Loss at 3997
Upper targets (Resistance) - 4947 - 6399 - 7852 - 8750
Good luck traders! God bless you!

FTM Daily ProjectionPrice breaks the downside trendline in the daily time frame and closes above. Before initiating long positions, wait until the price retests the trendline, creating a bullish price action structure.
Good Luck.

FTM ANALYSIS (4H)From where we entered start on the chart, it seems that FTM is forming a diametric pattern.
Soon it seems that FTM will enter the G wave.
In the supply range, look for sell/short positions and in the green range, you can look for buy/long positions.
Closing a daily candle above the invalidation level will violate the analysis.
For risk management, please don't forget stop loss and capital management
Comment if you have any questions
Thank You

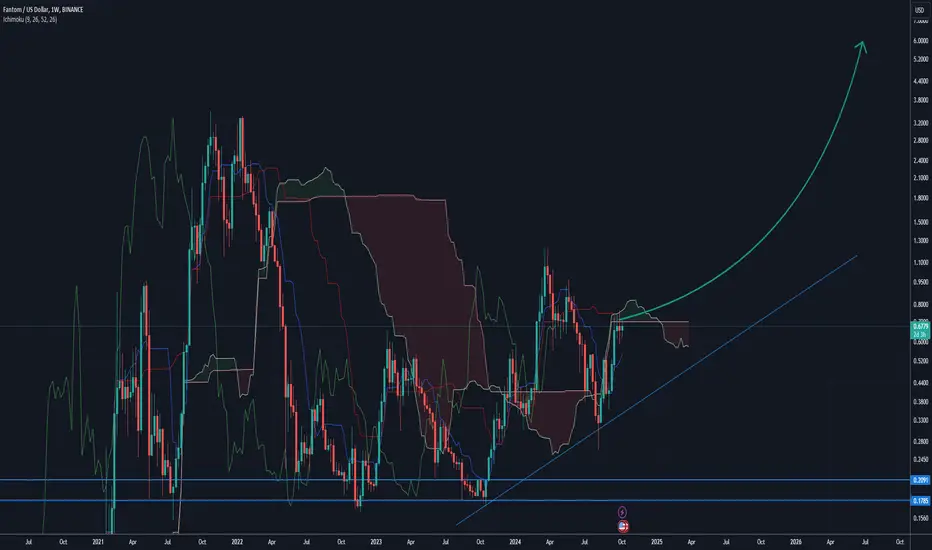
Fantom weekly updateFantom weekly update
The market is profitable and the possibility of price reduction is also possible.
Every price drop is a buying opportunity
Phantom targets are attractive.
The final target of Fantom or Sonic Foundation is $7 and $26

FTM buy/long setupWe have a bullish iCH on the chart.
A liquidity pool can be seen above the chart.
The price has not reached the main supply and the internal structure is still bullish.
FTM is expected to move from the demand box to the supply box.
Closing a daily candle below the invalidation level will violate the analysis.
Note that the financial market is risky, so:
Do not enter a position without setting a stop and capital management and confirmation and trigger.
When we reach the first TP, save some profit and try to move the stop continuously in the direction of your profit.
If you have any comments please post them, comments will help us improve our performance
Thanks
