FANTOM needs time to decide, FTMUSD, FTMUSDTHello my friends, another analysis with Fantom. Everything is clear in the chart for you.As always, keep your eyes on the circles and base bands, for growth the price needs to break the base band and fib 0.38 and trend line. so keep it in your watch list. Good luck.
If you like the idea, do not forget to support with a like and follow me for next analysis :)
Ftmusd


FTM/USDT - Possible Double BottomHello traders and community, today we will tell ourselves shortly about the situation of FTM/USDT
Trend analysis
- As you can see from the FTM/USDT daily chart, the price of Fantom token started stabilizing (range movement) and started forming double bottom pattern (white line on the chart), that's why we can expect upper movement with 60 % probability in short time period of time. As a trader I recommend to wait for correct signal and put short buy position up to 0.55 price level. Today's fibonacci support level (green line) is on 0.34751 price level, resistance level (red line) is on 0.55211 price level and global trend (orange line) is still bullish enough. Wish you good trades with this pair!
Chart pattern
- Bullish Double Bottom Pattern (processing)
Technical indicators
- RSI: market is still in boarders and is located near 50 level (not overheated, Neutral signal)
- MACD: MAs are prepared for downward movement + they started moving away from each other (Bearish signal)
- BB: Volatility of the market started stabilizing after volatile movement accomplished (Neutral signal)
- MA (10,20): MA10 is below the level of MA20 and stabilizing (Neutral signal)
= Overall neutral signal movement
Dear friends, please push the like button, write comments below, follow me for more technical analysis and share this post with other traders - that would be the best support, Thank you for your attention!
Tell us about your opinion for making better decisions :)
P.S.: Information provided is only educational and should not be used to take action in the market.

FANTOM - Trend-Following Setup FormingFANTOM is overall bearish (short-term / correction), trading inside our red channel but since it is approaching a strong demand zone in green we will be looking for buy setups to catch the next impulse.
Before we buy, we want the buyers to prove that they are taking over again.
You don't want to buy a bearish market right?
Our upper red trendline is not valid yet, so we are waiting for a new swing high to form around it to consider it our trigger swing. (projection in purple)
Trigger => Waiting for that swing to form and then buy after a momentum candle close above it (gray zone)
Meanwhile, until the buy is activated, FANTOM would be overall bearish and can still break the green demand zone downward.
In this case, a movement till the next support zone in blue would be expected where we will be looking for new buy setups to form.
Always follow your trading plan regarding entry, risk management, and trade management.
Good luck!
All Strategies Are Good; If Managed Properly!
~Rich

FTMUSDT (FANTOM) - POTENTIAL BREAKOUT ANALYSIS 🔎
- FTMUSDT is printing a falling wedge (FW) pattern.
- This is a reversal pattern.
- A bullish pattern to be precise.
- RSI is printing a bullish divergence signal.
- There's a breakout potential.
BUY ENTRY ⬆️
- Breakout above the falling wedge's resistance.
TARGETS 🎯
- Horizontal resistance level (R1).
- Horizontal resistance level (R2).
- Horizontal resistance level (R3).
SETUP INVALIDATION ❌
- Breakdown below the falling wedge's support.

FTM preparing for a 50% move up in the next 48 hours38 c is now a very well tested floor and should hold with high degree of confidence. Expecting to see a move up to low to mid 40s, rejection, then tension building up on the down sloping resistance until an eventual breakout to 65 cents which represents at 55% return from here.
Here is the hourly ribbon just for a different glance.

FTM strong support at 45 cents whales accumulatingVolume profile shows huge activity between 43-45, this is whales accumulating for the next leg up.
FTM did an explosive 42x return from January 22 to February 23 from 2 cents to 80 cents and it's retracted down now to 45 cents.

FTM will moon follow UN presentationSimple analysis but for big gains!
We're looking at mainly a fundamental here. Tomorrow the Fantom Foundation will present it's blockchain to the United Nations’ Central Bank Digital Currency (CBDC) Architecture Group. (March 11)
If we break the bottom trend line, trade in invalid. However as fundamentals are strong, I'll paying very close attention for an entry.
Other than that
Expecting yet another big pump for FTM following the UN presentation tomorrow

FTMUSDT (FANTOM) - BUY ENTRY ANALYSIS 🔎
- FTMUSDT was bounded in the descending triangle pattern.
- Price brokeout above the descending triangle's inclined resistance.
- This is a bullish signal.
- There's an uptrend continuation possibility.
BUY ENTRY ⬆️
- Conservative entry : breakout above the previous swing high horizontal resistance level (R1).
- Aggressive entry : market price.
TARGETS 🎯
- Horizontal resistance level (R2).
- Horizontal resistance level (R3).
SETUP INVALIDATION ❌
- Breakdown below the descending triangle's horizontal support level (S1).


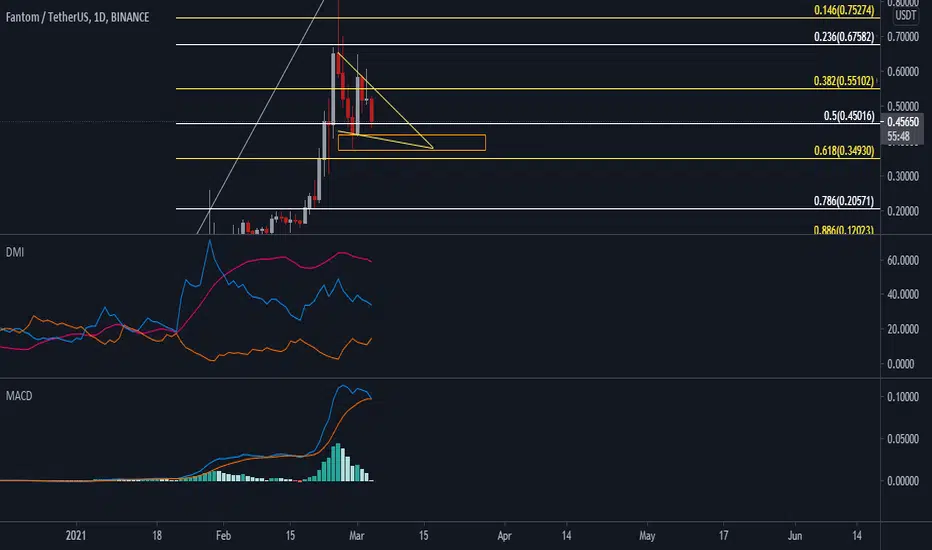
We have kept the 50% level.Our flag pattern is formed. We have kept the 50% level. But the indicators have taken the form of a fall. I can estimate the red shadows in the orange rectangle, but my candlestick body will remain in the flag.
FTMUSDT LongDescending Triangle potentially forming. Trade the breakout (Close above on atleast 1hr). Or enter at the Higher Low formed around the 38fib-0.5fib.
Good Luck.

FTMUSDTAnother hot coin, FTM is trying to test a resistance right now.
Just like the previous idea, wait for the confirmation which happens right after the closure of the 4H candle above resistance as shown on the chart. Then enter and open your positions.
⚠️ NOTE: This usually happens when a coin gets hot on crypto platforms: it might go down by a little and then get back up to a new high.
Good Luck 🎲
Tell me your ideas. Like and Share 🗣✅

FTM - The Fantom strikes again!Excellent Bullish price action, with recent pullback to support at .85 Fib, now attaching a hold level which lines up to the .5 fib area. Entry would be either be buy 1 Hold level and .75 fib and/or buy 2 hold level (.666 fib) as indicated on the chart.
Sell would be time resistance trend line or one of the given targets which ever is first.

FTMUSDT (FANTOM) - POTENTIAL BUY ENTRY ANALYSIS 🔎
- FTMUSDT is printing a falling wedge pattern.
- A falling wedge pattern is a bullish reversal pattern.
- RSI is printing a bullish divergence signal.
- There's a breakout potential.
BUY ENTRY ⬆️
- Breakout above the falling wedge's resistance.
TARGETS 🎯
- Horizontal resistance level (R1).
- Horizontal resistance level (R2).
- Horizontal resistance level (R3).
- Horizontal resistance level (R4).
- Horizontal resistance level (R5).
SETUP INVALIDATION ❌
- Breakdown below the falling wedge's support.

🆓Fantom/USDT Analysis (25/2) #FTM $FTM0.8$ is a strong resistance and this zone may be the peak of FTM in this wave.
I think it will have a big correction phase to at least 0.6$ zone or even 0.4$ in next days
But if FTM conquers 0.8$ zone successfully, we could see it at 1.3$ but long at the high price like this is not really a good idea
📈BUY
-Buy: 0.585-0.615$. SL if B
-Buy: 0.39-0.41$. SL if B
📉SELL
-Sell: 0.78-0.82$. SL if A
♻️BACK-UP
-Buy: 0.78-0.82$ if A. SL if B
-Sell: 1.25-1.3$. SL if A
❓Details
Condition A : "If 8H candle closes ABOVE this zone"
Condition B : "If 8H candle closes BELOW this zone"

FTMUSDT✅ FTMUSDT got on a rally and pumped up today as well, it also passed KSMUSDT with a sudden change of 33%.
Many people might have got into it too, but there are still some chances to profit. there might be a downtrend now that the price is pushing the resistance.
We can see that it bounced on support on 0.425 and now going back up.
The target for now might be the highs of 0.499
⚠️ NOTE: This usually happens when a coin gets hot on crypto platforms: it might go down by a little and then get back up to a new high.
Good Luck 🎲
Tell me your ideas. Like and Share 🗣✅

💡FTM: BUY Trade🚀🚀🚀🚀🚀🚀 #ALTSEASON2021FTM is trading in Rising channel, Lower trendline has gave support.
and price maintained very well above trendline.
📈#FTMUSDT
➡️Entry: 0.166$
🎯Target 1: 0.19$
🎯Target 2: 0.22$
🎯Target 3: OPEN

FTM could double in the next 10 daysFTM as shown a big big Signal of strenght in the last 2 weeks.
Usually that kind of move consolidate in a bowl form before popping much higher.
Look at UNFI and COTI to understand...
In that case, we could see it happen fast.
Also, its in the famous DEFI list of coins, wich gives me confidence.

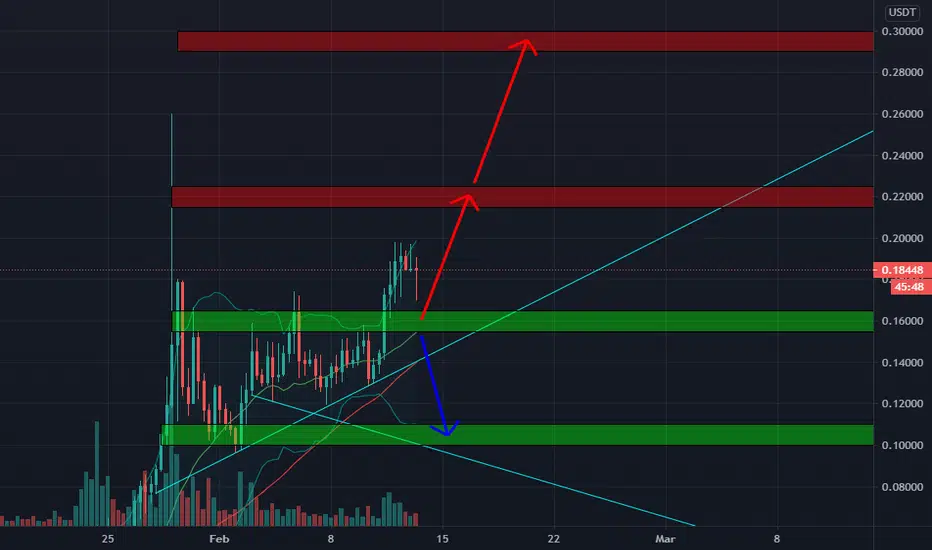
🆓Fantom/USDT Analysis (13/2) #FTM $FTMFTM has conquered $0.16 zone and is ready to go up in the next few days.
But if FTM loses 0.14$ zone, it will be a bearish sign to FTM
📈BUY
-Buy: 0.155-0.165$. SL if B
📉SELL
-Sell: 0.215-0.225$. SL if A
-Sell: 0.29-0.3$. SL if A
♻️BACK-UP
-Sell: 0.155-0.165$ if B 0.14$. SL if A
-Buy: 0.01-0.011$. SL if B
❓Details
Condition A : "If 8H candle closes ABOVE this zone"
Condition B : "If 8H candle closes BELOW this zone"

FTM/USDT SELL SIGNALThere are two potential downside targets. Let's see whether the first will get broken.

BreakoutThe ascent has just begun after the breakout, which can have a pullback and continue the ascent.
