Fantom/usdtBest Chart You can see today
fantom looks really interesting but we need just a breakout the trend ( as chart shows ) and close above with daily candle & high volume
Target on chart Starting from 1.5$ to 3.5$
for 5.5$ maybe it will take couple of months
this is a personal opinion and NFA
Thank you
Ftmusd

there are two bullish scenario on FTM coini am still bullish on BTC and ALTcoins. Please don't be afraid to buy altcoins. Good Luck. Make Money.

FTMUSDT Buy Opportunity!!FTMUSDT a layer1 project, has experienced a significant 90% decline from its previous all-time high (ATH). Currently breaking through resistance, it's on its way to the next level at $0.65.
FTMUSDT (1W Chart) Technical analysis
FTMUSDT (1W Chart) Currently trading at $0.33
Buy level: Above $0.31
Stop loss: Below $0.25
TP1: $0.38
TP2: $0.45
TP3: $0.5
TP4: $$0.65
Max Leverage 2x
Always keep Stop loss
Follow Our Tradingview Account for More Technical Analysis Updates, | Like, Share and Comment Your thoughts

FTMUSDImpulsive price action add credence that wave (3) of ((3)) unfolds with possible target 1.618 fib extension.
We used log scale on this count!

FTM Critical key resistance Hey everyone. After my previous bullish FTM scenario, we faced a strong resistance which we have yet not broken and instead has shown us it is strong.
Eyes on the direction this line ends whether we break the resistance or get rejected .

FTM (Macro Picture)FTM / USDT
Fantom is one of my favorite coins so far
I made alot of signals and calls in FTM recently which ended in nice profits
Macro Picture :
This is the long term / macro picture which can updated per weeks to months only
Mid term targets (wave 3) : 1.8$ - 2.2$
Then a possible huge correction (wave 4)
Long term targets (wave 5) : 5.5$ - 8.8$++
If we reached there the holding in this area will considered a risky as the distribution phase will start near there
Confirmation : breaking 1.15$ weekly
Note : this is my long term view .. in short term strong fluctuations expected to happen
DYOR

Who Wants To Double? #FTMFTM has formed a reverse head and shoulders pattern in 3D chart and ready to explode any time soon.
RSI currently: 75 Ultra Bullish,
Macd: Golden Cross already came in,
DMI seems to be bullish in lower time frames as well,
Ichimoku also gives every possible bullish signal it can give,
Well everything on the chart.
If it closes 0.556 in weekly time frame I'm going in with 5X leverage.
Good luck to us all.

FTM: 3-hit in high📊Analysis by AhmadArz:
🔍Entry: 0.9312
🛑Stop Loss: 0.9881
🎯Take Profit: 0.8719-0.8131
🔗"Uncover new opportunities in the world of cryptocurrencies with AhmadArz.
💡Join us on TradingView and expand your investment knowledge with our five years of experience in financial markets."
🚀Please boost and💬 comment to share your thoughts with us!

BTCUSD - the breakdown of a breakdownUsing the BTCUSD 4H chart, here I show how to do:
1. Projection for upside target;
2. Identify and qualify a breakdown.
First, if you scroll to the left of the chart, you will see that a rally and retracement was identified. An arrow was mapped to the length of the first rally. Then clone the arrow and shift the clone to start at the bottom most point of the retracement. This extension rally typically has a few characteristics...
a. MACD and VolDiv will spike high and cross down, but linger in the bullish area gradually falling (as opposed to a quick cross down and drop below the zero line); and
b. Price will rally and stall and repeat a pattern of higher lows and higher highs.
Now, typically, an extension rally should target for the 1.62 Fibonacci level before a proper stall. But in this case, a stall came in about 1.23 Fib level. This has been observed to frequently happen and then it can rally up another extension to 1.62.
As in this case it failed and started a breakdown pattern.
The breakdown pattern starts with a flattening out of prices. In this case, price started deviating from the projected path.
This comes with a bearish divergence in both MACD and VolDiv, in the forms of lower highs as opposed to price higher highs.
Then, a series of lower highs and lower lows will form... this is shown in the blue line. Note that the level formed by Point C is the ultimate breakdown level. once price completes the pattern and breaksdown below Point C, it is completed and a flush down typically follows.
By this time, the technical indicators MACD and VolDiv should clearly show a crossdown into the bearish area below the zeroline.
So, we then can do the projections to the downside, in a similar fashion. This time instead of using the arrows, the Fibonacci levels are shown...
For this case, a confluence is seen about 62K... and hence, expected a bounce about that level. But the target is a little further down at 60K. (Yellow and Red ellipse, respectively).
I had earlier posted via mobile a 62K target and within an hour or so, it swiftly hit that level.
Now to watch how it breaks down to 60K...
So there you have it, my descriptive of how I identify the trend change / retracement / pullback.
PS. I wanted to mention that time line on 14 March 2024. It was drawn in advance and denotes the peak point in time.
The next is about a month's time where is should bottom out in the middle of April (not shown in this chart.

FTM tries to make a new breakout !FTM / USDT
FTM is just printed new bullish pattern on HTF
Breaking-out this pattern will result in strong bullish wave
Keep an eye on it
Note :
this coin above our 2nd entry by 37%
And from 1st entry by 105%
Yet still looks very bullish in HTF
Best of wishes

AT CryptoScan: Why I like FTMUSD... Projection to 1.10This is the FTMUSD chart and how I do the projection.
I like FTM cos of
1. What it is
2. It is a reliable laggard that moves after BTC or ETH moves
3. It moves more in percentage terms
4. Technical indicators and chart patterns are relatively stable
Do note that there is a target and a top out date/time.
So... here it is! Let's track it!!!

FTMUSDT has surged by an impressive 101.24%#FTMUSDT
Target 4️⃣ : done✅
Entry price: 0.4251$✅
Price reached : 0.8555$ ✅
Profit: 101.12% ✅🚀🚀🤑
The cryptocurrency FTMUSDT has surged by an impressive 101.24%, reaching a price of 0.8555. This significant increase underscores strong market demand and bullish momentum for FTMUSDT. Such a surge may signal further investor interest and potential price appreciation in the near term.

FTM : trade in reng📊Analysis by AhmadArz:
🔍Entry: 0.634
🛑Stop Loss: 0.597
🎯Take Profit: 0.664 - 0.668
🔗"Uncover new opportunities in the world of cryptocurrencies with AhmadArz.
💡Join us on TradingView and expand your investment knowledge with our five years of experience in financial markets."
🚀Please boost and💬 comment to share your thoughts with us!

FANTOM to 64c#FTM looking good
forming an inverse head and shoulders
As #ETH gas fees explode
layer 2's . EVM forks should start catching a bid
teased us with a false breakout ,,,, but giving us more of an opportunity to accumulate
I expect next summer to be well above a $1

FTM's attractive roadmapFirst of all, pay attention to the time frame, the time frame is big and time consuming.
A large and time-consuming diamond diametric has started from where we entered "Start" on the chart.
It seems that we are now in the indiametric "G" wave, which is the last wave.
A supportive "flip" area has formed on the chart, which is very strong. According to the order flow, now the buy orders that can start the rising wave towards the target of "$1.9" are within the "damnad" range.
The targets are listed on the chart.
Closing a candlestick below the invalidation level will violate the analysis
For risk management, please don't forget stop loss and capital management
When we reach the first target, save some profit and then change the stop to entry
Comment if you have any questions
Thank You

FTMUSD 1WFTM ~ 1W 📈
#FTM Successfully penetrated this resistance at Time Frame 1W. This Is Bullish For FTM. Make purchases in stages with a minimum target of 20%++. Rocket #FTMUSD Will be leaving soon 🚀

#FTM #FTMUSD #FTMUSDT #Analysis #Eddy#FTM #FTMUSD #FTMUSDT #Analysis #Eddy
(("All the relevant areas and explanations on the chart are clear and clear, the trading setups need to get confirmation to enter, if you don't know how to get a trigger and confirm entering into transactions, this analysis is not suitable for you, the above analysis is for professionals. and if you are a beginner, my suggestion is that you don't destroy your capital and first learn technical analysis and basic trading along with psychology and risk and capital management from reputable sources and courses, and then enter the financial markets."))
(("The above analysis and setups and points and areas are combined with most of the combined styles such as price action, supply and demand, RTM, ICT and also with the analysis of important indicators such as Dominance Tether and Bitcoin.
If you are familiar with the mentioned styles and know how to get approval to enter the above styles, use the above analysis.
This is not an investment proposal and only my opinion, please act based on your experience and decisions."))
~~~~~~~~~~~~~~~~~~~~~~~~~~~~~~~~~~~~~~~~~~
BTCUSDT.P Setups 1+2 :
BTCUSDT.P Setups : 3+4 :
I also suggest you to view my #Analysis of #Bitcoin from the link below :
Related Tether Market Cap USDT Dominance Analysis : (( USDT.D )) : Check Link :

FTMUSDTHi traders!
All is clear!
Fantom USDT , Entry: 0.4235
Stop: 0.3989
TP: 0.5
Duration: about 7 Days. (Until Feb 23th)


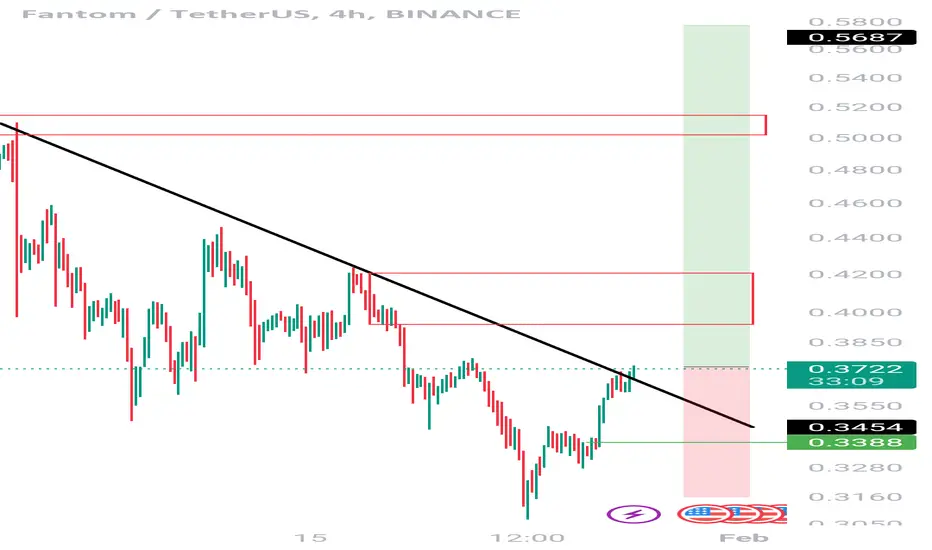
Ftm/Usdt Trying For breakout FTM/USDT is currently attempting a breakout on the 4-hour time frame. In the event of a successful breakout, there is potential for a bullish move ranging between 30% and 60%. However, it is important to note that this information is not to be considered as financial advice. It is recommended to conduct your own research and analysis before making any investment decisions.
fantom ⇒ get a short positionhello guys...
get a short position on 0.3794
tp1: 0.3685
tp2: 0.3280
tp3: 0.3070
______________________
always do your research.
If you have any questions, you can write them in the comments below, and I will answer them.
And please don't forget to support this idea with your likes and comment

FTMUSDTBINANCE:FTMUSDT Long idea
2 entry point
4 targets
❌every TP can act as a resistance and dump the price
⛔"Daily crypto market analyses I provide are personal opinions & not financial advice. Trading carries risks, so do your own research & seek advisor's help. #DYOR
Don't forget to 🚀 and comment

(Phantom) FTMUSDT AnalysisA short foreword. I do believe Bitcoin will come back to retest around the 40k levels. It is currently consolidating in a range with equal lows. Below the equal lows lie a void on the futures chart that has not been filled yet. I'm expecting some sort of manipulation move to the downside then a bounce back up as i'm still overall bullish on Bitcoin for now.
Everything I had to say about Phantom is in the video.
