FTM BUY SETUPFTM has an ascending structure. If it reaches the green range, we will enter the buy/long position.
Pay attention, we are only looking for buy/long positions on the green range and we will not enter positions in higher areas
Closing 1 daily candle below the green range will violate the analysis
The targets are clear on the chart. for risk management, please don't forget stop loss and capital management
When we reach the first target, save some profit and then change the stop to entry
Comment if you have any questions
Thank You
Ftmusd

FTM's Situation: What Shall we Expect ?➡️Double bottom is in forming on weekly timeframe.
Looking for the retest of the neckline, If the neck breaks, it will witness good growth.
- High potential areas are clear in the chart.
- You can look for reasons to enter according to your own personal strategy after approval.
-AB=CD
🤑Stay awesome my friends.
_ _ _ _ _ _ _ _ _ _ _ _ _ _ _ _ _ _ _ _ _ _ _ _ _ _ _ _ _ _ _ _ _
✅Thank you, and for more ideas, hit ❤️Like❤️ and 🌟Follow🌟!
⚠️Things can change...
The markets are always changing and even with all these signals, the market changes tend to be strong and fast!!

FTM intraday setupFTM inside falling wedge pattern,
short below resistance or at current price 0.4672
target at 0.4513
good luck

back to breakeven...? (FTM)❤️❤️Thanks for boosting 🚀 and supporting us!
📈wait for pollback to break of zone/
📊 (Buy) : 0.3725
🔴 Stop Loss : 0.3404
🎯 Take Profit : 0.3970 - 0.4409 - 0.4965 - 0.5285
🔗 For more communication with us, In the footnote and send a message in TradingView.
👨🎓 Experience and Education: Our trading team has five years of experience in financial markets, especially cryptocurrencies.

$FTM Reached to 2nd Target & Ready To Attack The 3rdHi guys,
UPCOM:FTM was finally able to reach the 100WMA and by crossing this resistance level, it crossed 50 cents and touched our second target. Regarding the crossing of the 50 cents level, as I wrote earlier, if we see a weekly candlestick above $0.5 tomorrow night, we can expect the third target at the $0.64 level to be available soon. Also another important event is the formation of an intersection between the 100WMA and the 200WMA, which can easily throw UPCOM:FTM towards $1.
CRYPTOCAP:BTC has given investors rich profits since its last recorded low, and now there is an opportunity for "Smart Money" to flow into the top projects of the crypto market. After Solana's CRYPTOCAP:SOL and Avalanche's CRYPTOCAP:AVAX we all know about the high potential of Fantom's UPCOM:FTM and this has made us wait longer for the growth we expect from $FTM. But at the same time, we should not forget to save profits and not be greedy.
This is not a financial advice & do your own research.
Please "Like" & "Follow" if you want to see more of these ideas.
BJWise,
Goodluck

Fantom: A thing that exist only in your imagination!FTMUSD is a great opportunity to take profits!
Extraordinary Risk to Reward trade for a cryptocurrency that is favored by crypto experts fundamentally! around days which BTC potentially is experiencing last days before a sharp move!
Look at my old days BTC analysis and see how easy was to get a good profit out of short and long positions during the last 24 months!
What we see in the chart is a powerful OB+ and what we expect is a reversal!

A Trader's Perspective on the Formation of a Triangle PatternHello, friends! I want to share my forecast for the FTM coin in the cryptocurrency market. Recently, I noticed the formation of a triangle pattern on the weekly chart, and I believe that this could be an interesting signal.
My analysis suggests that there is a possibility of a pullback to the range of 0.24, where I plan to consider buying FTM for a long-term position. However, I want to emphasize that this is just my opinion and should not be taken as financial advice.
As a trader, I understand that making decisions in the cryptocurrency market requires thorough analysis and risk assessment. Therefore, before making any transactions, it is important to conduct your own research, consult with professional financial advisors, and evaluate the current market conditions.
Remember that the cryptocurrency market is highly volatile, and investments always come with risks. Be cautious and make decisions based on your own analysis and careful consideration.
I wish everyone successful trading and the ability to make well-informed investment decisions! Stay updated with the market, be prepared for changes, and never stop learning and growing as traders. Good luck!

FANTOM - Boom! +150% Banked ✨In our last analysis, we identified we were in a correction were looking for a move up to complete wave B, subwave c. We are now nearing its completion and have banked over 150%.
We are now focusing our efforts on finding the reversal point for the next big trade. We have the fib levels falling in line with the recent highs.
Trade Idea:
- Watch for price to enter our reversal zone within the fib levels
- once there, look for rejection signs
- use trendline break or BOS for entry
- Targets: 0.17, 0.8, taper thereafter
Goodluck and as always, trade safe!
See below for our previous analysis.

FTM ANALYSISBy examining the FTM waves, it appears that the formed pattern is a diametric one. From the green range it can step to complete the G wave. It takes some time to complete the F branch.
What the chart tells us is that the phantom rise will continue. The resistance range is the two red lines that I have marked.
For risk management, please don't forget stop loss and capital management
Comment if you have any questions
Thank You

#FTM/USDT#FTM
The price has been moving in a descending triangle since last February
The price gained support at 0.1730
The price is expected to break the downtrend at the current price
First target : 05160
Second target : 0.6555
Which represents 200% of the current price
With an oversold presence on the MACD
✅Thank you, for more ideas, hit 🚀 Like❤️ and 🌟Follow🌟!

$FTM of Fantom Easily Reached To 1st TargetHi Friends
After breaking through the 50WMA resistance, Fantom ecosystem's valuable cryptocurrency, UPCOM:FTM , easily reached the first target and reached above the $0.4 level. Currently, 100WMA at the level of $0.5 is still considered the main resistance of UPCOM:FTM before reaching the important level of $1.
Therefore, if UPCOM:FTM can cross the 100WMA and register a weekly candle above the $0.5 level, the 3rd target and higher targets will be easily available before reaching $1.
More than 30% net profit has been made since my last update. Don't forget to save profit, avoid greed and do your own research.
"Like" & "Follow" if you want to see more of these ideas.
BJWise,
Goodluck

//\\ Charming FTM //\\Will we see the terrifying rise of the FTM and its ecosystem? The ecosystem updates are very interesting and you can see the climb on the weekly chart, is FTM close to the following numbers?
$2 ,
$3 ,
$5 ,
$6 ,
$9 ,
$12

Long-Term Analysis of Fantom (FTM) CoinIf FTM experiences a decline within the specified range of $0.2246 - $0.208 in the coin analysis, it may be considered for long-term investments. If it encounters strong buying reactions from the mentioned support range, the initial upward target is $0.357, with the next target being $0.414.
Should FTM continue its downward movement, and if it drops to the $0.1856 level, a final addition can be made. However, if FTM closes weekly candles below the $0.17 level, it should be stopped.
Not financial advice (NFA).

$FTM ready to Fly strong supports zones are indicated in Green , Targets are indicated in yellow
Good volume are entering Fantom after many good upgrades

Fantom (FTM) coin completed setup for upto 26.50% pumpHi dear friends, hope you are well and welcome to the new trade setup of the Fantom (FTM) coin with US Dollar pair.
Our last successful trade of FTM was the below one, and it was almost 44% pump:
Now on a daily time frame, FTM has formed a bullish Gartley move for the next pump.
Note: Above idea is for educational purpose only. It is advised to diversify and strictly follow the stop loss, and don't get stuck with trade.

FTM daily 🔥 FTM is very nice, with great marketing, I hope you only see green candles and the news of its ecosystem will come out soon, everything will be compared to Bitcoin.

FTMUSDT UPSIDE IS COMINGFTM has breakout on the weekly and there is upside coming in the next 3 months
not FA.

#FTM #FANTOM long-term targets, until the end of 2025Fantom's long-term targets, until the end of 2025
According to Elliot's wave count conditions, from March 2020 to January 2022, a five-wave structure can be observed, which can be a small part of a larger structure, i.e., it is either wave 1 or wave A of a five-wave or a three-wave. . From January 2022 to October 2023, a corrective structure will be observed as wave 2 or B, and now we are forming the next rising wave, which according to Elliott's rules should be formed as five waves and as wave 3 or C. Depending on whether the new movement wave is formed as wave 3 or C, different targets will be created.
Therefore, our target range will be relatively large, but according to the shape of the movement structure and also the estimate of the end of the climb, we can reach relatively suitable points in the specified time.
The targets are:
TARGET1: 6$
TARGET2: 15$
TARGET3: 60$
TARGET4: 270$
ENTRY: 0.33 -0.21 $
STOP LOSS: 0.15$

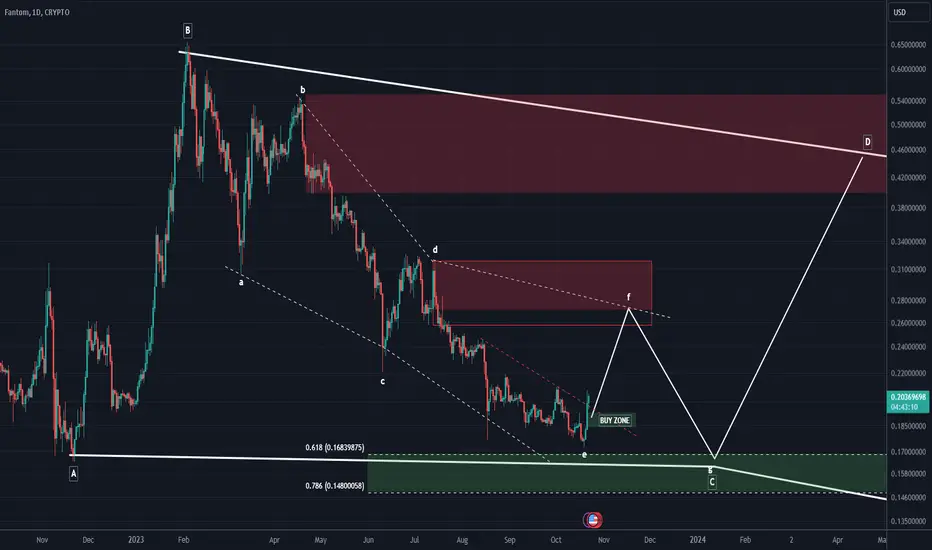
The FTM chart is amazing!The FTM symbol is inside a very large structure. Wave C of this large structure is a diametric, whose sides I marked with dashed lines. Now wave e is ending and we are entering wave f.
The Fibonacci on the chart is the ratio of wave A to G of the diametric pattern that I marked with a dashed line, and it is expected that wave G will end in this area in the future.
We expect the completion of the drawn movements from the FTM as shown.
For risk management, please don't forget stop loss and capital management
Comment if you have any questions
Thank You
Fantom sonic breakout imminent FTM 1day is right on queue with a beautiful touch of the downward trendline resistance from Feb 2023 A breakout around here at the 0.26 area would be very bullish Maybe a retest but short-term target 0.33 would be inevitable and with blue sky to 0.53 the ride will be worth it Parameters are looking positive reset ready and back this idea Fantom 2.0 Sonic test net reports are all positive with increased speed (+2000tnx/sec) and scalability and 90% reduction in storage space requirements

FTM doom predictions and golden opportunityFTM looks bearish.
Expecting a small bounce and getting rejected from the resistance .
Many altcoins have started making new lows so we believe that FTM will catch up and 0,1590 support will fail.
Looking for a buy orders in the green area:
0,055 - 0,038 usd
Long way to go. FTM may drop another 80 % from the current levels.
2 possible scenarios are shown on the chart.
Short it at the resistance or wait for a price to reach the buy zone .
Do you agree? Feel free to leave a comment

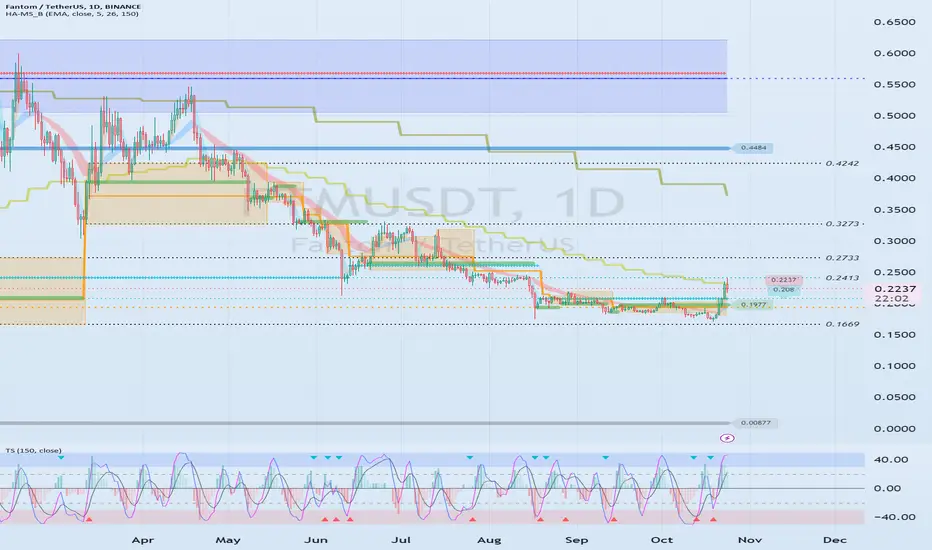
The key is whether it can rise above 0.2413Hello?
Hello traders!
If you "Follow" us, you can always get new information quickly.
Please also click “Boost”.
Have a good day.
-------------------------------------
(FTMUSDT chart)
The key is whether it can receive support and rise in the 0.2002-0.2732 range.
(1W chart)
The key is whether it can receive support and rise in the box range of 0.2127-0.3683.
(1D chart)
It is necessary to check whether it can rise beyond the previous box range of 0.1669-0.2733.
To do so, the key is whether the price can be maintained above 0.208 and rise above the M-Signal indicator on the 1W chart.
Accordingly, it is important to be able to maintain the price above 0.2413.
-------------------------------------------------
The important support and resistance point on the current chart is at 0.4484.
Therefore, you can set the 0.4484 point as the target point.
If you have set a target point like this, you must create a trading strategy to determine how you can wait until this target point.
If you are thinking of waiting as a trading strategy, it is better to place a pre-order at 0.4484 and not look at the chart.
If not, you must focus on stabilizing your psychological state and making it possible to wait until the goal point.
--------------------------------------------------
- The big picture
The full-fledged upward trend is expected to begin when the price rises above 29K.
This is the section expected to be touched in the next bull market, 81K-95K.
-------------------------------------------------- -------------------------------------------
** All explanations are for reference only and do not guarantee profit or loss in investment.
** Trading volume is displayed as a candle body based on 10EMA.
How to display (in order from darkest to darkest)
More than 3 times the trading volume of 10EMA > 2.5 times > 2.0 times > 1.25 times > Trading volume below 10EMA
** Even if you know other people’s know-how, it takes a considerable amount of time to make it your own.
** This chart was created using my know-how.
---------------------------------
FTM Weekly Analysis - Have We Hit The Bottom? Long for 2024!FTM has been bouncing off and consolidating in its major support zone of $0.15-$0.20 since it made contact in June of 2022. After a quick bounce to the $0.60 area, the price has remained in that support zone. We have now had a third touch point on this support, and so far, the bull response is strong.
Bitcoin has also been consolidating in its support zone of $25,000-$30,000. My analysis of Bitcoin is we will see a bull run in 2024 and new all-time highs by April of 2025. If the Crypto market repeats history, the Alt market will follow Bitcoin to the upside when it finally breaks out.
FTM remains #62 in market cap as of this posting, a good spot to be in for a riskier yet probable investment. What remains an open question is; will the Alt market be strong this time around? We don't know, and that's a conversation for another post. As traders and investors, it's important to speculate about the future based on historical data * first *, then inject fundamental analysis to determine the probability of a deviation from history.
Key Points:
1. If FTM doesn't fall out of the top 100 in market cap during the next couple of years, I expect the price to at least reach the resistance zone of $0.55 - $1.00 by 2025, a conservative estimate of about 500% up from today's price.
2. If the alt market responds to Bitcoin's bull run in 2024-2025 reaching previous all-time highs, it's possible that FTM will also soar to its previous all-time highs of around $3.50. That is a roughly 1700% increase from today's price.
These are great outlooks on FTM, but we should always proportion our investments relative to the risk of the asset. 2 years is a long time in the market, especially in a young market like Crypto, especially with an altcoin.
As always, trade at your own risk, you are responsible for your trades, and I hope this information was helpful.
Trade wisely and let us know what you think in the comment section below!
