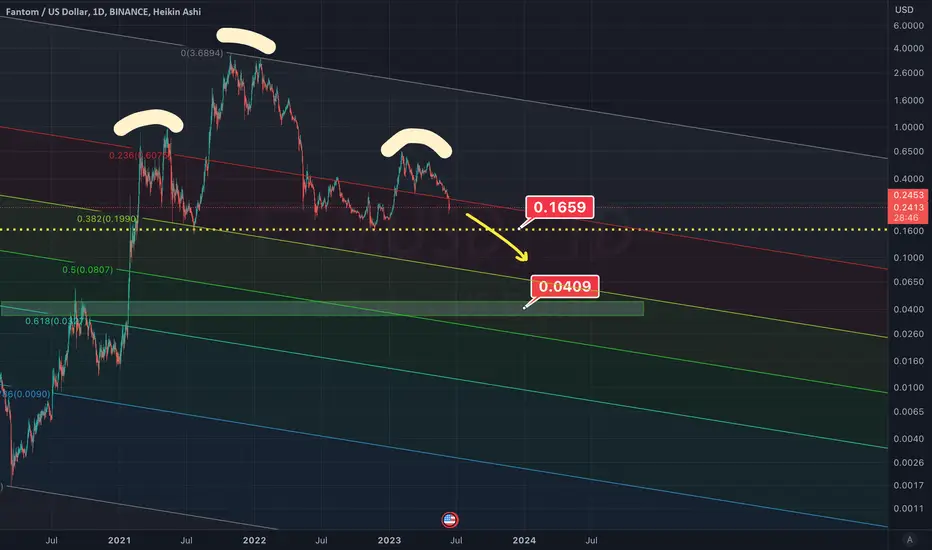
FTM is in Danger of Testing Much Lower Price RangesFTM chart is not looking very good in the near term.
If FTM breaks below 0.20 level, it could accelerate down to 0.04 level which is aligned with the 0.618 golden pocket.
FTM is also forming a head and shoulders pattern and if it breaks the neck line of 0.1660 the price target for that is also right below 0.04.
Ftmusd
Fantom at a clean looking channel I don't know, some nice looking touches. Everyone thinks alts are dead, anything is possible but I'm not giving up on the altrun yet, Bitcoin has followed my plan so far, didn't think alts would go this comeback down again but we'll see if we can get going again.

#FTM Daily fantomAs you can see in the chart, I think the past trend has been repeated and soon after touching the support of 26-25 , we will go up.

[UPDATE FTM] Ok, they did it again. Next is 0.27.Redistribution is happening fast. Schematic #1 was invalidated. Now we are going down fast.

FANTOM - Get Ready...Fantom is currently in an ABC correction for a move higher.
We've already made the bottom so we have a strict invalidation level to work with. The upside potential is incredible (1500% gains) compared to the downside risk associated with this trade.
Trade Idea:
- For a safe entry, watch for a break of the channel
- For a risk entry, enter on break of lower timeframe trendline
- stops below the bottom
- Targets: 0.97,1.47, 3.5, HODL the rest and manually close.
Goodluck and as always, trade safe!

Fantom will explosion soonI think that Fantom is ready to fly to return to its top point again.
My Entries
My entry 1: 0.3235
My entry 2: 0.3185
My entry 3: 0.3092
My entry 4: 0.3057
My Targets:
Target 1: 0.03538
Target 2: 0.03865
Target 3: 0.04033
Target 4: 0.4143

FTM target 35% (RRR 10)4h time frame
-
FTM retesting support from triangle now
Set up a good plan to trade here with low risk
Target will be 0.44
SL is 0.317

FTMUSDTThe weekly chart shows a bigger picture of what is happening. We can see that the 6th week is ending with a red candle for Phantom. This is not a good sign. But the price is approaching the important support of 0.3 and also in this area we have the support of the dynamic trendline, both of which can cause price stability and growth. But as you can see in the chart, I chose 2 scenarios for the currency. The first scenario is the price meeting the support of 0.3 and growth again. The second scenario is the failure of the support and reaching the next support, which is 0.25. So it is better to wait and see the price reaction to these supports
⚠️"Daily crypto market analyses I provide are personal opinions & not financial advice. Trading carries risks, so do your own research & seek advisor's help."

FTM Next Possible Move #FTM breakdown and retest
Be prepared for FOMC, use proper risk management and keep an eye on #BTC

FTM Long Term Idea 🚀🚀🚀FTM long term idea, Green box strong buy area 0,3340-0,3000
Tp1 %62 0,5287
Tp2 %97 0,6434
Tp3 %192 0,9534
This is not financial advice ( DYOR )

Fantom FTM to 0.5805$ ?👑 #FTM/USDT BUY 👑
Entry:
0.3780✅
Targets:
1️⃣0.4373🎯
2️⃣0.4790🎯
3️⃣0.5207🎯
4️⃣0.5805🎯

FTM/USDT LONG💎FTM/USDT
🟢long
🛑max lev 50
💵$3.6%-1.8% OF CAPITAL
🟩enter:0.37350
🟥stop : 0.37127
🔮target's
🪙0.37573
💶0.37796
💷0.38242
💴0.38688
💵0.38911
R/R = 7
RISK HIGH

FTMUSD ❕ downtrendFTM held the descending line.
The chart immediately reacted to the resistance level.
I believe that the asset will continue to decline if it is fixed under the support level.

Fantom FTM price does not want to fall, so it will grow🚀It is very likely that the FTMUSDT price is completing its corrective consolidation in the white liquidity zone.
And it looks like FTM holders may be in for a +100% price increase.
The first target for Fantom token growth is $0.80
The second target is $1.75, but this is a long process
_____________________
Did you like our analysis? Leave a comment, like, and follow to get more

ETH - FTM comparison; apples and oranges? updateETH - FTM comparison; apples and oranges? update
this chart comparison fascinates me. whats crazy is i STILL cant tell which of those two points in more likely. though it does seem overall very very similar.
i think with their dev runway etc ftm will pump hard for the first big bear market rally.
using that same ratio of time gone by since x point; seems we already bottomed. but macro in general indicates we haven't. id be ready to buy, but try staying above fake small time frame pumps.
gl

FTM to the 0,54 zonemy favorite FTM, we'll see if he tests the higher zones, I expect some retest sooner or later, anyway SL and be careful

✅TS ❕ FTMUSD: support area✅✅ The chart has broken the downward structure.
Fantom has once again reached the support area.
We believe that the asset will start to bounce from the current area. ✅
🚀 BUY scenario: long to 0.4481 🚀
----------------------------------------------------------------------------
Remember, there is no place for luck in trading - only strategy!
Thanks for the likes and comments.

FTMUSD ❕ under the rangeThe asset has fallen below the range and is now trading under liquidity.
On the main timeframes, the FTM is down under the 50 and 200 EMAs.
I think that the price will continue to decline after fixing under the current level.

FTM idea sharingFTM has a double-top pattern in the four-hour chart, and the price rebounded after reaching the support near 0.3161, and broke through the downtrend line.
-
After breaking through the downtrend line, FTM has a chance to appear in a bull flag pattern, and the current price is near the downtrend line.
If the four-hour closing price is higher than the downward trend line, you can enter the market with long orders:
Stop loss: 0.3954
Take profit: 0.5329, 0.5631, 0.5990
-


✅TS ❕ FTMUSD: upward structure✅✅ FTMUSDT broke through and fixed above the strong resistance level.
The chart maintains an upward structure.
The price will continue to rise. ✅
🚀 BUY scenario: long to 0.5293 🚀
----------------------------------------------------------------------------
Remember, there is no place for luck in trading - only strategy!
Thanks for the likes and comments.

FTM - Road to 2024Already down 95%
Crypto winter will not be short imo and we will range bound for a while.
Either scenarios, I will be DCAing on a weekly basis like the rest of my trades.
Short term is very difficult to read for me and I don't use margin so I will do what I did back in 2018-2019 and pick strong coins to DCA for a year.
2024-2025 will be exciting...
