AT CryptoScan: FTM second bite at the cherry?Just a quick note that FTM is now looking like a possible breakout for the next couple of weeks/months. After an extended consolidation period, it had worked its way into a long term range and is probably in a squeeze of sorts.
It is likeable that the MACD is rising, and better yet, the VolDiv is increasing so much more. So, if this is correct... the second bull run is possible. Early days, but worth to keep an eye on.
Potential strong bull rally still baking... wait for it
Ftmusd

Fantom Menace ($1.60)- one of strongest Layer 1s off the lows
- catalysts w/ upcoming account abstraction + Fantom Virtual Machine
- much lower market cap than other premier SC platforms w/ only ~1.4B
- retest of multi-month range highs, don't want to see this trade back into the range on weekly basis
- intra week dips into higher low of weekend from SVB implosion + USDC depeg + banking contagion fears should be good buys

FTMUSD ❕ under the liquidityIndicators suggest that the initiative is in the hands of the sellers.
The chart has broken down the range boundary.
I think FTM will continue to decline.

FTM NEW UPDATE (4H)We have risen from the range that we specified for the previous analysis, but we have a weak trend. With recent candlesticks, the FTM wave count should look like this. The place to buy is specified

FTM/USDT🐇FTM/USDT
🪄 FTM Scalp Position | You Can See Liquidity Zone in Chart
#FTM #Fantom #eth #btc #bitcoin #ethereum #cryptocurrency #crypto #Trade #trading #Trader #Signal #forex #Scalp #altcoins #chart #RTM #ICT

FTMUSDT - Buy Setup!FTMUSDT (1D Chart) Technical analysis
FTMUSDT (1D Chart) Currently trading at $0.492
Buy level: Above $0.485
Stop loss: Below $0.37
TP1: $0.58
TP2: $0.66
TP3: $0.85
TP4: $1
Max Leverage 2x/Spot Market
Always keep Stop loss
Follow Our Tradingview Account for More Technical Analysis Updates, | Like, Share and Comment Your thoughts

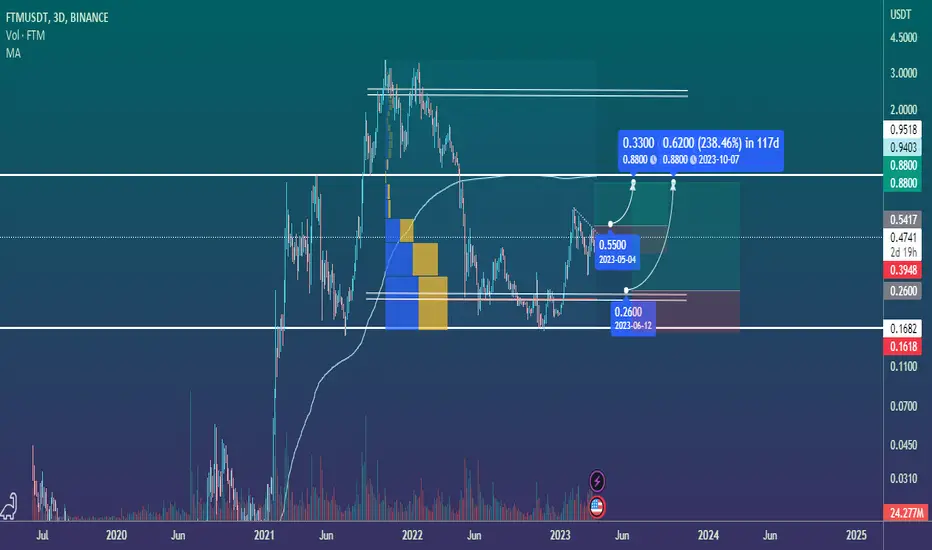
FTM/USDT🐇FTM
🪄 2 Scenarios for FTM Midterm Long
- If Break 0.55 First
- or Around 0.25
+ TP Around 0.9
#Fantom #FTM #FTMusdt #FTMUSD #eth #btc #bitcoin #ethereum #cryptocurrency #blockchain #crypto #coinbase #bitcoins #trading #money #investing #forex #cryptocurrencies #altcoins #bitcoinnews #investor #altcoin #hodl #binance
✅TS ❕ FTMUSD: downtrend✅✅ FTM USD is moving in a downtrend.
Buyers are showing weakness.
The asset will continue its decline. ✅
🚀 SELL scenario: short to 0.3901. 🚀
----------------------------------------------------------------------------
Remember, there is no place for luck in trading - only strategy!
Thanks for the likes and comments

FTM SHORT trade IDEA Hello, due to a lack of volume in the market I haven't been posting as many updates in coins although we are still looking for opportunities everyday.
Analysis: In our previous LONG trade, we long from 0.35 to 0.53 netting a 51.93% profit. Our target was the #3 possible breakout on the white resistance line. However, we have been struggling to break past the resistance and are looking likely for a due correction to 0.38-0.41 level (green box).
Target: 0.39-0.41
Stop loss: 0.47 (break above )
Timeframe: 1D

FTM ROADMAPHi, dear traders. how are you ? Today we have a viewpoint to BUY/SELL the FTM symbol.
For risk management, please don't forget stop loss and capital management
When we reach the first target, save some profit and then change the stop to entry
Comment if you have any questions
Thank You

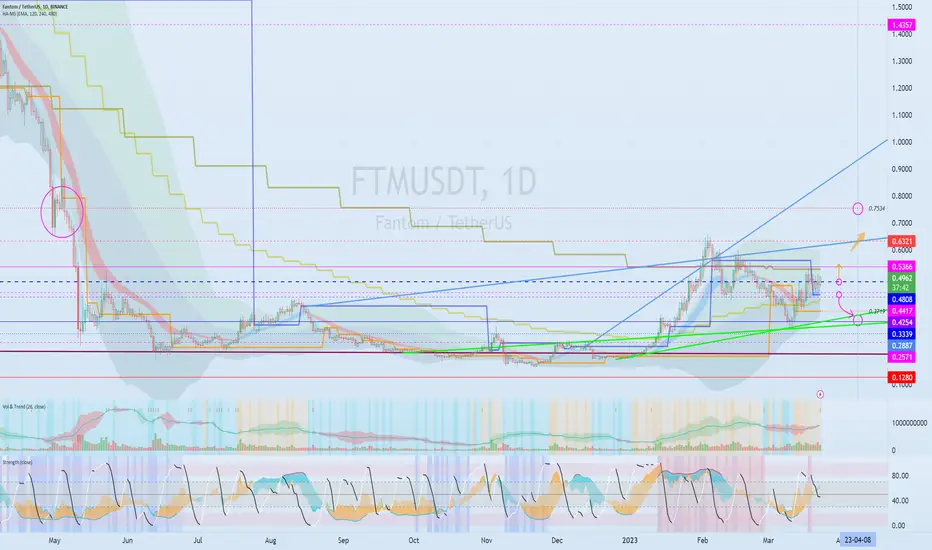
Significance of the interval 0.5366-0.6321...Hello?
Traders, welcome.
If you "Follow", you can always get new information quickly.
Please also click "Boost".
Have a good day.
-------------------------------------
(FTMBTC 1W chart)
The key is whether it can rise with support around 0.0000 1686 ~ 0.0000 2029.
--------------------------------------
(FTMUSDT chart)
(1W chart)
The question is whether it can hold the price above 0.4254 and rise above 0.6321.
(1D chart)
The key is whether it can rise with support around 0.5366-0.6321.
Therefore, if it rises above 0.7534, it is expected to show a sharp uptrend.
To do so, we need to see if the price can be maintained around 0.4808.
A drop from 0.4808 is likely to touch around 0.3339-0.3719.
-------------------------------------------------- -------------------------------------------
** All descriptions are for reference only and do not guarantee profit or loss in investment.
** Even if you know other people's know-how, it takes a considerable period of time to make it your own.
** This is a chart created with my know-how.
---------------------------------
[UPDATE FTM] Why do they keep manipulating in the same way? Stay safe and ready. Long + Short at the right moment = Heaven? Let's ee


✅TS ❕ FTMUSD: wedge✅✅ FTMUSD has broken through the descending wedge.
The chart has fixed above the support.
The asset will continue to grow after it fixes above the resistance. ✅
🚀 BUY scenario: long to 0.5293. 🚀
----------------------------------------------------------------------------
Remember, there is no place for luck in trading - only strategy!
Thanks for the likes and comment

Will FTM rise 100% this month ?!!Hello Traders !!
Feels like BINANCE:FTMUSDT having a Falling wedge getting formed on 4H timeframe !!
Fantom went down massively before even BTC start to fall.
Surely we all know that 1- Falling wedge is a bullish pattern 2- the target for the falling wedge will be the top of the wedge
Will FTM do it ? OR we gonna get a new low ?
What do you think ?
Thumb up for more !!
Follow for more ALTCOINS <3

$FTMUSDT: Bullish weekly trend now...Great upside vs risk here in #Fantom. As long as above the consolidation area it will sky rocket within 6 weeks or less.
Best of luck!
Cheers,
Ivan Labrie.

🟢 FTM Falling WedgeFTM Falling Wedge - 25% scalp possible from here and 0.50 target if wedge consolidation breaks out to the upside.

FTM: INCREASE VIEWFTM seems to enter into a new uptrend.
Will follow coming time to see if it's able to show new changes.

FTMUSD ❕ trading in the rangePrice has fixed below 200EMA (4H TF)
TD Sequential formed a reversal signal downwards (4H TF)
I expect a reversal if price holds in the range.

FTM IS VERY BEARISHHi, dear traders. how are you ? Today we have a viewpoint to SELL/SHORT the FTM symbol.
For risk management, please don't forget stop loss and capital management
When we reach the first target, save some profit and then change the stop to entry
Comment if you have any questions
Thank You

Fantom (FTM) formed bullish Gartley for upto 82% moveHi dear friends , hope you are well and welcome to the new trade setup of the Fantom ( FTM ) coin.
Previously we caught more than more than 44% pump of FTM as below:
Now on a daily time frame, FTM has formed a bullish Gartley move for another price reversal.
Note: Above idea is for educational purpose only. It is advised to diversify and strictly follow the stop loss, and don't get stuck with trade

🚨 FTM: What's next???As long as we are moving below the downtrend, we cannot speak of a global development trend, despite the fact that this causes an aggressive inflammatory development.
I marked the support levels with orange lines, the resistance levels with red lines.
Key resistance: $0.46-$0.48. It is necessary to try this range and log in higher on 1D TF. Then the likelihood of a hike is very high.

FTM/usdtwe will see a dead tiger bounce long it high chance we will see 0.39 do not levereg the tit out of it
