Reversal Pattern, A Triple Bottom | Long BiasOn Week TF
Easily spot the reversal pattern which is triple bottom.
Now, Fantom is trading at 0.231x and will being move up to resistance 0.33
Fantom is trading in Triangle Pattern so wait for a breakout
FTMUSDT

The Dollar Shop💵: ADA, FTM, CTXCHi Traders, Investors and Speculators of Charts📈📉
I'll be making a series on altcoins that are trading well under 1 dollar. These coins make for great additions to a diversified portfolio AND with such a cheap price, why not get a few. You never know which one will 100x 🤑
Incase you missed the previous one, find it here :
NOTE that these are accumulation ideas ideally. You can definitely swing trade once they have doubled, but keep a few around for incase one of them x10 or x100.
_______________________
📢Follow us here on TradingView for daily updates and trade ideas on crypto , stocks and commodities 💎Hit like & Follow 👍
We thank you for your support !
CryptoCheck

Next weeks for FTM#FTM is very nice, with great marketing, I hope you only see green candles and the news of its ecosystem will come out soon, everything will be compared to Bitcoin.
🔜🔥

Is that a super morning star?Is that a super morning star?
A morning star on valid weekly support and a +RD.

FTMUSDT UPSIDE IS COMINGFTM has breakout on the weekly and there is upside coming in the next 3 months
not FA.

Quick Update FTM Quick and short term update from FTM, the market is taking a break as we have talked about before and the next stage of the climb will be realized soon, the market is ready and the critical point of the FTM is 24 cents, as long as it is above this number it is possible to climb was hopeful.
#FTM

fantom is preparing for a bull runHi
ftm has finished subwave x of wave X and has started to cover wave y recently.

#FTM #FANTOM long-term targets, until the end of 2025Fantom's long-term targets, until the end of 2025
According to Elliot's wave count conditions, from March 2020 to January 2022, a five-wave structure can be observed, which can be a small part of a larger structure, i.e., it is either wave 1 or wave A of a five-wave or a three-wave. . From January 2022 to October 2023, a corrective structure will be observed as wave 2 or B, and now we are forming the next rising wave, which according to Elliott's rules should be formed as five waves and as wave 3 or C. Depending on whether the new movement wave is formed as wave 3 or C, different targets will be created.
Therefore, our target range will be relatively large, but according to the shape of the movement structure and also the estimate of the end of the climb, we can reach relatively suitable points in the specified time.
The targets are:
TARGET1: 6$
TARGET2: 15$
TARGET3: 60$
TARGET4: 270$
ENTRY: 0.33 -0.21 $
STOP LOSS: 0.15$

BULLISH ON THIS FTM TWO-YEAR APEXIn this chart of BINANCE:FTMUSDT , we saw an apex pattern and I would consider bullishness for this coin because of these factors:
Triangle and its past. The specific pattern shown is a descending triangle from its prior uptrend movement from a daily and weekly timeframe, indicating a higher chance of a resistance breakout.
Respecting the elderly. In terms of the seniority, the current resistance line is formed in January 2022 while the support is two years old and six months older. In my trading experience, the old will have the "firmness" and conviction.
I also posted this on my past idea of this two-year support, true enough the market respected it.
Take note, price rejection can happen, plot your support lines on an hourly perspective as possible.
I would add more goodies in the comments down below.
Always PLAN your trades and happy trading!

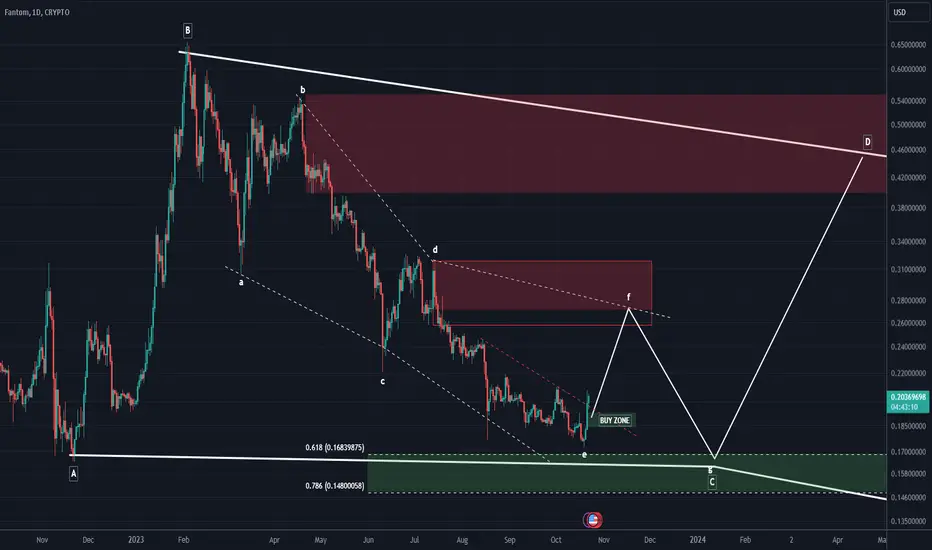
The FTM chart is amazing!The FTM symbol is inside a very large structure. Wave C of this large structure is a diametric, whose sides I marked with dashed lines. Now wave e is ending and we are entering wave f.
The Fibonacci on the chart is the ratio of wave A to G of the diametric pattern that I marked with a dashed line, and it is expected that wave G will end in this area in the future.
We expect the completion of the drawn movements from the FTM as shown.
For risk management, please don't forget stop loss and capital management
Comment if you have any questions
Thank You
ftm long term i saw ideas that when some coin goes up publish the bullish when its goes down they say its dead man
i think
the market cap of ftm is small even small money can change the market
i analyzed ftm like this for long time ago
ftm will see 30 cents but it may stay there for a cuple of the time
but 30 cent resistance is powerful and when its goes over it it can be a powerful suport line
i think
the capacity of ftm is 1.5B so the real price is
50 to 60 cents (as i marked)
in the other hand
ftm has 22cent
and the 16 cent suport line
when its crash
i think ftm goes to 5 cent and it can be a bad ending
beware that any news can change the price extremely
the best news that i want to hear is ftm become layer 2 and nfts maket hype again or etc
many thx

🔥 FTM Daily 🔥I hope the market will remain bullish, the indicators are showing signs of growth.
This is not an investment offer
FTM DAILY

🔥 FTM 🔥Bull 🔥
Macd 🔥
Rsi 🔥
I hope the market will remain bullish, the indicators are showing signs of growth. This is not an investment offer

Fantom (FTM) long - big breakout soon!?FTM are squeezed between the daily 20 MA and 200MA, and at the same time the weakly trend are about to break to the upside. It could lead to big move to the upside.
If a weekly trend break will be confirmed, I don't think it takes much time before we can see a 100% move.
Zoom in to smaller time frames to find a perfect entry with lower risk and adjust your stop loss according to your trading style.
The main idea is - big move is probably coming for Fantom - prepare to catch it
The idea in the chart have risk/reward ratio 6, with potential 100% profit

FTMUSDT.1DBased on the given market data, FTM is currently trading at a price of $0.2376 against USDT.
Starting with the 4-hour chart, the Relative Strength Index (RSI) is at 48.95, which suggests that the market is near the neutral zone, neither being overbought nor oversold. The Moving Average Convergence Divergence (MACD) value is 0.0015, indicating a relatively stable market. The Bollinger Bands (BB) value is at 0.2497, which is slightly above the current price, suggesting a potential for a slight upward movement. The first, second, and third support levels are at $0.2166, $0.1965, and $0.1830 respectively, while resistance levels are at $0.2577, $0.2813, and $0.2911.
Moving on to the daily chart, the RSI is at 74.12, indicating that the market is approaching overbought conditions. The MACD stands at 0.0137, suggesting a bullish market. The Bollinger Bands stand at 0.2596, which is slightly above the current price, indicating a potential for price increase. The support levels are at $0.2154, $0.1920, and $0.1735, while resistance levels are at $0.2600, $0.2916, and $0.3220.
On the 7-day chart, the RSI stands at 47.38, suggesting a neutral market. The MACD value is -0.0342, indicating a bearish trend. The Bollinger Bands stand at 0.3120, which is significantly above the current price, suggesting a potential upward movement. The support levels are at $0.2332, $0.1747, and $0.1516, while resistance levels are at $0.2583, $0.3315, and $0.4140.
In conclusion, the FTM market shows mixed signals across different time frames. While the daily chart suggests a bullish trend, the 7-day chart indicates a bearish trend. Traders should pay close attention to these indicators and consider other market factors before making a decision. Please note that this is just a technical analysis and not financial advice. Always do your own research before investing.

FTM has a dropWe have reached the weekly resistance and weakness can be seen in the upward trend. A liquidity pool is created under the candles.
It is expected that the liquidity pool will be broken and we will move towards the green box
For risk management, please don't forget stop loss and capital management
Comment if you have any questions
Thank You

FTM BULLThe FTM ecosystem is getting better every day, we will see good targets soon, due to the strong team and its blockchain events, we will see the price of each FTM at 6 dollars, experience the real DeFi, you can also check the project

FTM doom predictions and golden opportunityFTM looks bearish.
Expecting a small bounce and getting rejected from the resistance .
Many altcoins have started making new lows so we believe that FTM will catch up and 0,1590 support will fail.
Looking for a buy orders in the green area:
0,055 - 0,038 usd
Long way to go. FTM may drop another 80 % from the current levels.
2 possible scenarios are shown on the chart.
Short it at the resistance or wait for a price to reach the buy zone .
Do you agree? Feel free to leave a comment

Fantom – Channel BreakoutFantom is in a downtrend since February 2023.
Fantom’s PA created a descending channel, with the 50D EMA acting as additional resistance.
Today (October 23rd), FTM broke out of the channel and formed a bullish ChoCh.
Fantom presents a long opportunity. IMO, you should consider the following factors:
Pros:
1. FTM is above the 21D & the 50D EMAs.
2. Channel breakout.
3. FTM is above the immediate resistance level of 22 Cents.
Cons:
1. the daily RSI is elevated. Daily RSI is at 74. I am not sure it can support continuation without a pullback.
2. The channel resistance line was not tested as support.
3. the 22 Cent level was not tested as support either.
4. Fantom made more than 25% gains in five days. This pace is unsustainable.
Suggestion:
Wait for a pullback. A pullback will confirm the trend and show us where the support is.
Possible Trade Ideas:
Trade Idea 1:
• Entry: 0.21 (ChoCh line)
• SL: 0.19 (just below the 50d EMA)
• Target: 0.31(weekly resistance)
• TP: 0.26 (200D EMA), 0.31
• R: R: 1:3.8 to first TP.
Consider leaving some on the table. FTM could go much higher.
Trade Idea 2:
• Entry: 0.22 (local s/r flip)
• SL: 0.205 (ChoCh line)
• Target: 0.31(weekly resistance)
• TP: 0.26 (200D EMA), 0.31
• R: R: 1:2.8 to first TP.
Consider leaving some on the table. FTM could go much higher.
NFA.
What do you think? Please share in the comments.
Best Wishes.

FTM/USDT bullish horizon? 👀 🚀 FTM Today analysis💎 Paradisers! FTMUSDT is currently on the radar, nearing a potential break above its supply zone, signaling a heightened likelihood of a bullish trajectory.
💎 After its recent emancipation from the descending channel, FTM has been charting an upward course. Presently, there's a strong probability it will approach and potentially challenge the supply level at .2169.
💎 Should it successfully surpass this threshold; the odds lean towards targeting the primary supply zone. However, if the coin faces resistance and doesn't breach the supply, there's a chance it might seek bullish momentum from the demand level at .1949
💎 The VRVP's notable volume further underscores this potential shift, suggesting a pivotal moment when the price converges on that mark. A descent below this point, however, could tilt the scales towards a bearish outlook. Stay informed and strategize accordingly!

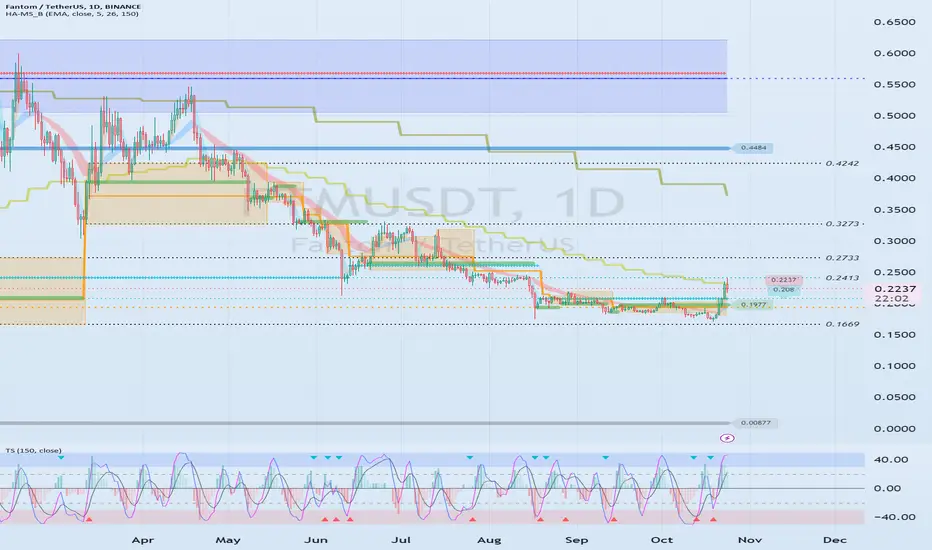
The key is whether it can rise above 0.2413Hello?
Hello traders!
If you "Follow" us, you can always get new information quickly.
Please also click “Boost”.
Have a good day.
-------------------------------------
(FTMUSDT chart)
The key is whether it can receive support and rise in the 0.2002-0.2732 range.
(1W chart)
The key is whether it can receive support and rise in the box range of 0.2127-0.3683.
(1D chart)
It is necessary to check whether it can rise beyond the previous box range of 0.1669-0.2733.
To do so, the key is whether the price can be maintained above 0.208 and rise above the M-Signal indicator on the 1W chart.
Accordingly, it is important to be able to maintain the price above 0.2413.
-------------------------------------------------
The important support and resistance point on the current chart is at 0.4484.
Therefore, you can set the 0.4484 point as the target point.
If you have set a target point like this, you must create a trading strategy to determine how you can wait until this target point.
If you are thinking of waiting as a trading strategy, it is better to place a pre-order at 0.4484 and not look at the chart.
If not, you must focus on stabilizing your psychological state and making it possible to wait until the goal point.
--------------------------------------------------
- The big picture
The full-fledged upward trend is expected to begin when the price rises above 29K.
This is the section expected to be touched in the next bull market, 81K-95K.
-------------------------------------------------- -------------------------------------------
** All explanations are for reference only and do not guarantee profit or loss in investment.
** Trading volume is displayed as a candle body based on 10EMA.
How to display (in order from darkest to darkest)
More than 3 times the trading volume of 10EMA > 2.5 times > 2.0 times > 1.25 times > Trading volume below 10EMA
** Even if you know other people’s know-how, it takes a considerable amount of time to make it your own.
** This chart was created using my know-how.
---------------------------------
SasanSeifi 💁♂️FTM/USDT 👉1DHey there!😎 In the daily time frame, as you can see, after a price decline from the $0.17 range, there was a positive reaction, and it is currently trading within the price range of $0.19 while following a downward trend line. In the daily time frame, one can expect that if the downward trend line is broken and the price consolidates above the $0.20 range, we may see the price experience further growth after a minor correction and pullback to the level of the downward trend line, potentially reaching the significant supply zone at $0.24.
For a better understanding of the continuation of the price movement, it's important to observe how the price reacts when approaching resistance levels. The likely trend is also indicated in the image above. Maintaining the support range of $0.17/$0.16 is very important. Additionally, in case the price gets rejected from the $0.20 resistance range, there is a possibility of witnessing a sideways trend.
✨What's your opinion? Do you agree?
🔵Remember, always conduct your own analysis and consider other factors before
making any trading decisions. Good luck!"✌️
❎ (DYOR)...⚠️⚜️
Sure, if you have any more questions or need further clarification, feel free to ask. I'm here to help!
if you found my analysis helpful, I would appreciate it if you could show your support by liking and commenting. Thank you!🙌✌

FANTOM BULLISH SETUP🚀🚀🚀The Liquidity Abyss:
At the lower price levels, FANTOM (FTM) presents a peculiar scenario: a deep well of liquidity that seems resistant to being outmatched. This situation can be seen as the result of strategic market dynamics and could pave the way for a promising uptrend. 🌊🚀
Imbalance as a Catalyst:
The key to unlocking the bullish potential lies in mastering the weekly imbalance at the $0.5 level. An imbalance refers to a situation where a significant excess of either buy or sell orders accumulates at a specific price point. Breaking through this imbalance can trigger substantial price movements. 📊🌕
Trading Strategy:
Monitor Weekly Imbalance: Keep a close eye on the weekly imbalance at the $0.5 level. A successful conquest can be a defining moment for FANTOM's price.
Risk Management: Implement solid risk management strategies to protect your investments in the event of unexpected price movements.
Fundamental Awareness: Stay updated on FANTOM's fundamentals and market news that may influence its trajectory.
Conclusion:
FANTOM's journey reflects the intricate dance of liquidity and imbalances in the cryptocurrency market. The promise of a bullish surge, driven by a well-timed strategic move, is an enticing prospect.
Remember, the crypto market is rife with complexities, and the potential for manipulation always exists. But, with a keen eye, a well-thought-out strategy, and a cautious approach, you can navigate these waters effectively.
The liquidity abyss might just be the starting point for a remarkable journey ahead.
❗️Get my 3 crypto trading indicators for FREE! Link below🔑
