Fantom FTM price time to "catch up" with the marketToday, let's take a look at the global chart of FTMUSDT
Finally, yesterday the altcoin market revived and started to grow, and XRP was the luckiest with the court decision that recognized it as a non-security)
The FTMUSDT price hasn't really grown much compared to many altcoins.
We can assume that the coin still has growth potential:
- The liquidity zone is $0.45-0.55 , and we would consider this zone as the first medium-term target where you can fix part of the profit on a long position.
- "the final", probably it should be called a long-term target for the FTMUSDT price in our opinion is around $0.80
_____________________
Did you like our analysis? Leave a comment, like, and follow to get more
FTMUSDT

BTCUSDT H4: WYCKOFF PATTERN ?Hi Guys,
Well , I thinks bitcoin in H4 will complete this patter let see .
SecondChanceCrypto
⏰12/JULY/23
⛔️DYOR
Always do your research .
If you have any questions, you can write them in the comments below.and I will answer them.
And please don't forget to support this idea with your likes and comments.

BTCUSDT H1 : SHORT SETUP Hi guys , Hope you well
As you can see, the weakness in the upward trend is evident. We can have a fall by hitting the red box level in the step of 29500 and even in the next step to 27600. Also, a Wykoff pattern is forming in the higher time that I load the chart. Don't forget that we have important economic news today.
SecondChanceCrypto
⏰12/JULY/23
⛔️DYOR
Always do your research .
If you have any questions, you can write them in the comments below.and I will answer them.
And please don't forget to support this idea with your likes and comments.

#FANTOM #FTM Long-Term Targets#FANTOM #FTM Long-Term Targets
With the survey that has been done, we will probably reach one of the following goals in the next 3 to 6 months.
0.75 $
3.2 $
After bitcoin halving, the next strong upward wave will start and as a result, we will reach the following goals one by one in the next two years, and the probability of the $6 level is very high.
6 $
14 $
61 $
stop loss:
under 0.15$

FTM 1WThe weekly price has pulled back into the broken area
Important weekly support 0.2618. Nest > 2415-2412
Important daily resistances 4h-15min 0.2820 - 2858- 2912- 2940 - 0.3011 - 0.3070

ftmusdt 4h#ftmusdt 4h
Targets and stops are marked in the photo
Targets and stops are marked in the photo .

FTM/USDT 4H ReviewHello everyone, let's look at the FTM to USDT chart on a 4-hour timeframe. As you can see, the price has broken out of the local downtrend line.
Let's start with the support line and as you can see the first significant support is at $0.25, then we have the second support at $0.20 and then the third support at $0.16.
Looking the other way, we can determine a significant resistance zone that the price has to face from $0.35 to $0.39, only when we move up from this zone, the price can move towards resistance at $0.46.
The CHOP indicator indicates the ending energy, which gives small price movements, the MACD tries to return to the local uptrend, while the RSI after a visible rebound, we have an attempt to return to the uptrend.

LINKUSDT DAILY : WHERE IS THE FLIPHi Guys Hope you well,
As you can see, the link was able to make a good move and the price of almost 35% growth in the daily time, according to the conditions of Bitcoin, it can be expected to experience a weak decline and then reach the supply areas in the daily time form. Two zones have been specified for the return of the price, which should be checked when arriving according to the conditions of Bitcoin.
SecondChanceCrypto
⏰2/JULY/23
⛔️DYOR
Always do your research .
If you have any questions, you can write them in the comments below.and I will answer them.
And please don't forget to support this idea with your likes and comments.

FTM- Updated Chart 💹 FTMUSDT This has been a phenomenal trade for me and I am still holding half my position from 'entry uno'
0,322 is the resistance we must keep in mind now.
Hopefully Bitcoin will help break higher./.let's see:
0.40 is a valid target that can be achieved this summer and i think we are over 68% possible to see it happening
Then again, we could go parabolic but let's go step by step now and monitor the market and the charts so: 0.3049 is support, under there i do have a SL to secure more profit.
One Love,
The FXPROFESSOR

Fantom Weekly Elliott wave countFantom looking promising on log scale.
Price was rejected into 1.618 fib extension of an impulse that may be Wave 1 than moved down into a correction that may be an expended flat pattern.
The price held an important level from 0.1530.
Keeping 0.1642 level and than clearing 0.5468 it may start an impulse that may be the 3rd wave from a bigger degree 5th wave.
Hit the like button if you like my analysis and follow me for future updates!
Good luck!

Fantom – Second Entry Point• Please read my previous FTM idea for context.
• It looks as if FTM has taken the straight route up. (Green Scenario)
• If FTM moves above 0.333 USD I will consider it a ChoCh on the daily chart . Meaning, a move from a downtrend to an uptrend.
• IMO, there are two ways to play this. In the end they are all the same:
1. Simple Support/Resistance Flip trade: Wait for FTM to test the 0.333 USD Level as support to enter long with the SL below the previous low.
2. Wait for a pullback to the demand zone with a SL below the zone. FYI, this demand zone was tapped once on June 24th, but it doesn’t mean that price will not test this demand zone again.
Trade Idea 1 (Support/ Resistance Trade):
• Entry: 0.333
• SL: 0.2876
• Target: 0.546 (TP along the way, leave a moon bag)
Trade Idea 2 (Demand Zone):
• Entry: 0.3
• SL: 0.2876
• Target: 0.546 (TP along the way, leave a moon bag)
NFA.
What do you think? Please share in the comments.
Best wishes to all.


FTMUSDT H1:Long setup for tradeHI Guys ,Hope you well.
I explain you a Long setup in chart but please trade with confirmation in lower time frame .
SecondChanceCrypto
⏰27/JUNE/23
⛔️DYOR
Always do your research .
If you have any questions, you can write them in the comments below.and I will answer them.
And please don't forget to support this idea with your likes and comments.

FTMUSDT in Short term analysisHello. To all my loved ones and those who follow me!
This time my analysis is about FTM currency. In my opinion, according to the upward trend of the market. Phantom climbs up to the resistance range of 30-31. And then according to the pattern of the head and shoulders that you see, it falls to the target point that is written. Of
course, pay attention to the MACD indicator

SWING LONG FTM/USDTswing long please use low leverage this position
Also, you should pay special attention to the trend of Bitcoin, if the trend of Bit continues up to 32 thousand, I expect to pump this currency

FTMAfter supporting the desired area, the sharp move started. The first level I expect to react to is the red box.

FTMUSDTFTMUSDT was in bearish trend and recently give breakout from falling trendline. Will the instrument continue with bullish momentum?

Fantom – The Path Ahead, Deep DiveTLDR:
Unfortunately, Fantom lost all bullish structure.
The upside of this correction is that FTM’s price is good enough to DCA if you are a long-term investor. I provided the next support levels; in case you are interested.
I charted three scenarios, two relatively bullish and one bearish scenario.
I included two possible swing trade ideas. However, I must say, there are better trades out there, IMO.
Background:
On November 2022 fantom created a bottom in the region of 0.1636 – 0.19 USD in a double bottom.
The first significant resistance FTM had to breach to was in the region of 0.255 – 0.276 USD, which is the same as FTM’s current price.
During FTM’s impulse to the upside it achieved nearly 300% price appreciation in 74 days.
In the past 4.5 months FTM’s price corrected by more than 67%. The time ratio between impulse and correction is 1:2 which is indicative of a deep correction possibly paving the way for the next leg up.
I immediate Support & Resistance Levels:
Resistance:
0.2761. Weekly & Daily Level
Support:
0.255. Previous ChoCh level.
0.2251. 50% of the Wick and 0.786 Fib Retracement (approx.).
0.2124. Daily Wick.
0.1883. Double bottom Support.
0.1637 Double Bottom Support.
Where Do We Go from Here?
Green Scenario:
If BTC and the broader crypto market change direction in the next few days, there is no reason why FTM should be the exception. The first sign of recovery would be a break above the immediate resistance of 0.2761 USD, retest as support and a strong move up.
Orange Scenario:
Assuming that the current correction is not resolved to the upside in the short-term, I expect FTM to retrace at least to the 50% of the wick, move up towards the 0.2761 level resistance and continue up.
Red Scenario:
If the whole market goes to crap, FTM will continue to dip further. However, I don’t think it is likely to drop more than previous bear market low. But, who knows!? Everything is possible (just remember that the good is also possible).
Possible trade Ideas:
1. Support/Resistance Flip
Entry: 0.2761 USD, after retest as support
SL: 0.25 USD, below the last support level
Target: 0.55 USD
TP: 0.33, 0.39, 0.55 USD.
R: R: 1:5 assuming TP2 is achieved.
2. Wick Fill Trade
Entry: 0.2252 USD. 50% of the Wick + 0.786
SL: 0.21 USD. Below the wick.
Target: 0.39 USD
TP: 0.276, 0.33, 0.39 USD. Leave a moon bag.
NFA.
What do you think? Please share in the comments.
Best Wishes to all.

Fantom towards Moon..?👀!! 🚀FTM Today Analysis💎FTM has been tracing a downward channel for approximately a month, signaling a bearish trend. a bullish scenario could unfold if a breakout takes place.
💎If successfully breaks free from the channel, it could signify a change in market sentiment and the onset of a bullish phase.
💎High demand implies substantial buying interest in the token, which could potentially elevate its price.
💎When its price crosses above its EMA 20, it's seen as a bullish signal. This crossover suggests a potential transition from a bearish to a bullish phase.
💎In the dynamic world of crypto, staying informed and adaptable is key. Stay tuned for more updates and enjoy your trading journey!

FTM entryftm stochastic on the 4hr needs to reset or bottom that correlates with the touch of the trendline this being our entry after which we can look for a 5% push to the next order block that also correlates with the upper trendline

FTMUSDT.4HHello dear friends,
*Mars Signals Team wishes you high profits*
This is a time frame analysis for FTMUSDT.4H
We are in a 4 hour period. As you can see, the price is moving above our first resistance zone and we have two scenarios.
First scenario: If the price can stabilize above our first resistance line, we expect it can move to our second resistance zone.
The second scenario: if the price stabilizes below our resistance line, we expect a further drop to the first support zone.
Warning: This is just a suggestion and we do not guarantee profits. We advise you to analyze the chart before opening any positions.
Take care

FTMUSDTHello dear friends
The price range of $0.2929 is very attractive for Phantom, it has reacted interestingly when approaching this range in the past. Of course, it should be noted that the reaction did not create a higher ceiling.
If the downward trend line is broken upwards, provided that the loss limit zone is maintained, there is a possibility of forming an upward trend.

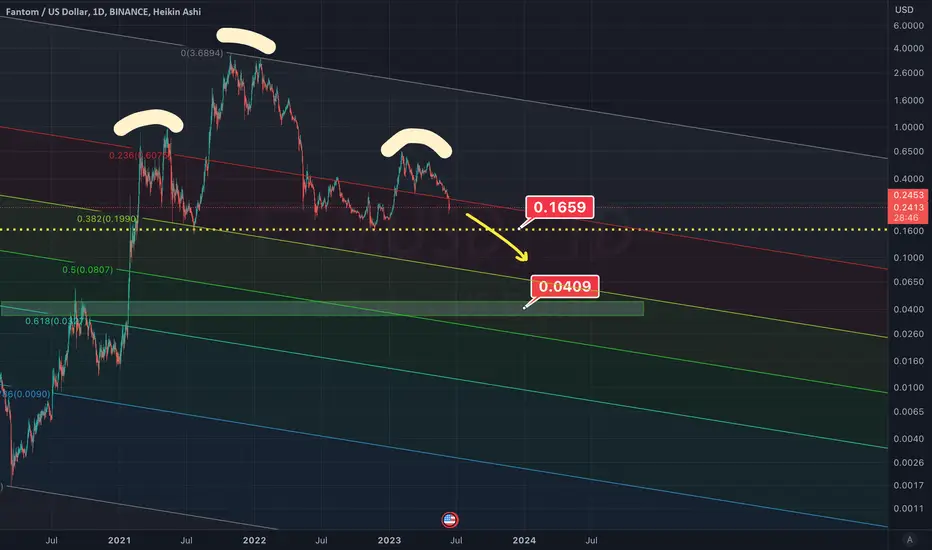
FTM is in Danger of Testing Much Lower Price RangesFTM chart is not looking very good in the near term.
If FTM breaks below 0.20 level, it could accelerate down to 0.04 level which is aligned with the 0.618 golden pocket.
FTM is also forming a head and shoulders pattern and if it breaks the neck line of 0.1660 the price target for that is also right below 0.04.