FTM/USDT🐇FTM/USDT
🪄 FTM Scalp Position | You Can See Liquidity Zone in Chart
#FTM #Fantom #eth #btc #bitcoin #ethereum #cryptocurrency #crypto #Trade #trading #Trader #Signal #forex #Scalp #altcoins #chart #RTM #ICT
FTMUSDT

FTMUSDT - Buy Setup!FTMUSDT (1D Chart) Technical analysis
FTMUSDT (1D Chart) Currently trading at $0.492
Buy level: Above $0.485
Stop loss: Below $0.37
TP1: $0.58
TP2: $0.66
TP3: $0.85
TP4: $1
Max Leverage 2x/Spot Market
Always keep Stop loss
Follow Our Tradingview Account for More Technical Analysis Updates, | Like, Share and Comment Your thoughts

FTM trading inside of a Triangle The price of an asset moves within a narrowing range over time, forming a shape that resembles a triangle. Given the possibility of a breakout in either direction, one trading strategy is to wait for a clear break of the triangle pattern in either direction before entering a position. This could be done by setting up buy and sell orders on both sides of the triangle, with stops and limits placed accordingly to manage risk.
It's worth noting that trading within a triangle pattern can be risky, as there's no guarantee that the breakout will occur in either direction or that it will be sustained. Therefore, traders should use proper risk management techniques and be prepared to adjust their positions quickly if the market conditions change.

✴️ Fantom Has So Much More To Give (260% This Wave)Here is another one that looks pretty good.
We looked at FETUSDT and we see the exact same pattern, the exact same chart but this one is lagging a bit behind, which is good because it means that it will go up next.
What one does, the rest follows.
Here FTMUSDT (Fantom) is set to grow now that the correction is over, notice the Doji last week.
All the signals are 100% bullish.
✔️ The current candle trades above EMA100.
✔️ The MACD is bullish with plenty of room available for additional growth.
✔️ The RSI is really strong.
We can see 260% happen on this current wave but there can be more of course, long-term.
This is all only the beginning.
The Cryptocurrency market will grow for years to come. Higher highs and higher lows.
Namaste.

FTM/USDT🐇FTM
🪄 2 Scenarios for FTM Midterm Long
- If Break 0.55 First
- or Around 0.25
+ TP Around 0.9
#Fantom #FTM #FTMusdt #FTMUSD #eth #btc #bitcoin #ethereum #cryptocurrency #blockchain #crypto #coinbase #bitcoins #trading #money #investing #forex #cryptocurrencies #altcoins #bitcoinnews #investor #altcoin #hodl #binance

FTM/usdtLAST CHANCE BRO DONT BE A DONKEY THINK ONES 14 march cpi will send a market to the moon ppi also will be good down over for btc look at my last idea

At the beginning of a flight, but wait, we haven't refueled yetGet ready to fly, but don't rush, don't refuel yet. We have a resistance zone ahead. After 6%, if the resistance is broken, we will have a good entry
Follow us and ask us questions, we will be happy

FTM Forming Inverse Head and Shouldersyou can buy FTM once we see 4h close above 0.471
targets 0.53 - 0.65

ftm/usdt buy trigger???in 4h time frame trend has middle white dynamic s&r as support and adx line as support i guess its good trigger for buy!! what do u think????

$FTM - Odin Zone$FTM - Odin Zone.
So the first thing I want us to notice here is the FSS doing pretty good on this timeframe. Even the second buy signal during the drop yielded 13% upside.
In a previous iteration of this chart, the .618 zone barely gave any resistance to the drop. It led me to believe, that we might have had a full run here (12345). After adjusting the fibs, we see that the golden pocket held much better, with just a small few wicks under the pocket. As a result, I moved my original Odin zone to favor a lower entry at the new .786 point.
The waves are ever evolving as we chart them. As Elliottists, we must be constantly updating what we see to reflect the new price action. But in general FTM always makes great looking, textbook waves, which is why it is one of my favourite coins to look at on a consistent basis.

FTM/USDTpersonal opinion:
Undoubtedly, one of the best shopping opportunities has been achieved in Fantom. There is no need to explain more because everything is clear in the picture.
The goals and extent of the damage have been specified.
ps: DYOR

FTM longSeems like #FTMUSDT found its support on 200 ema on D TF + 100 ema crossing with 200 ema which means a bullish sign

FTM (D) longFantom is in buy-zone on daily time frame. This is a potential 70% trade. You probably can use the 200 MA as a back up support level where it's likely that FTM bounce if it's fall further down. If the altcoins start running this could be a great play. The BTC-dominance is falling right now. I even see this FTM price level (0.38-0.4) as a potential DCA zone for long term hold.

FTMUSDT 4HFTM has also broken the 88 line and trend 2 in Fibonacci
Be ready to hit the 1 Fibonacci line and move up to the 13 Fibo

FTM SHORT trade IDEA Hello, due to a lack of volume in the market I haven't been posting as many updates in coins although we are still looking for opportunities everyday.
Analysis: In our previous LONG trade, we long from 0.35 to 0.53 netting a 51.93% profit. Our target was the #3 possible breakout on the white resistance line. However, we have been struggling to break past the resistance and are looking likely for a due correction to 0.38-0.41 level (green box).
Target: 0.39-0.41
Stop loss: 0.47 (break above )
Timeframe: 1D

FTMUSDTPhantom is testing the support level for the third time. Of course, this is in the 4-hour time frame, but as a daily trader, I think that this time it will break down and on the next support it can go back up again. I will take a long position and if it maintains the support and goes up, I will take a short position at high resistance. But now? Nothing, I just look

FTM/USDTBasically we have an ascending channel which is a bearish pattern, but inside of it we have a nice clear bull flag pattern which is ready to pump!
You can sell into the resistance of the channel, this is a great trade!

FTMUSDT 4HFTM has broken its descending channel and completed a pullback to it.
More growth is coming.

FTMUSDTHello Crypto Lovers,
Mars Signals team wishes you high profits.
This is a 4-hour-time frame analysis for FTMUSDT
As we analyzed on March 14, we expected a rise to happen and here we see a noticeable rise after a little decline which means our expectation took place correctly. Here we have R1 and R2 as the resistance areas that express the price was not able to rise at different points. And S1 and S2 are our support areas in this chart containing the support of price even since the past. Thus, we have the price fluctuating over S1 area after being rejected at R1 and we expect it to make two scenarios available here. By having some rising signs and more fixation, we would wait for an increase up to R2. So if we receive some confirmation candles to rise, an increase would take place for the price to break R1 upward and even move rise toward R2 area would happen in case the price is supported at R1. It is also probable that if the price is capable of breaking R2 upward, the possibility of rising to its last peak is so high. But if the price is not supported, more fall is predicted there for it to touch lower amounts. Then surely if the price falls below S1, more decline will happen to it. We suggest you to put your stop-loss point below our first support area for not losing more profits and experiencing more logical trades. Please do not forget to wait for some signs such as confirmation candles in order to make sure of what will be your next movement and then act wisely.
Warning: This is just a suggestion and we do not guarantee profits. We advise you to analyze the chart before opening any positions.
Wish you luck

#FTM #crypto #Signal15 min time frame to identify the breakout of resistance and divergence.
Note: Always trade with proper risk management and a solid trading plan. The white, red, and green lines can serve as potential signals for entry, stop loss, and take profit, respectively, based on your analysis. Monitor the price action closely and adjust your trade accordingly.

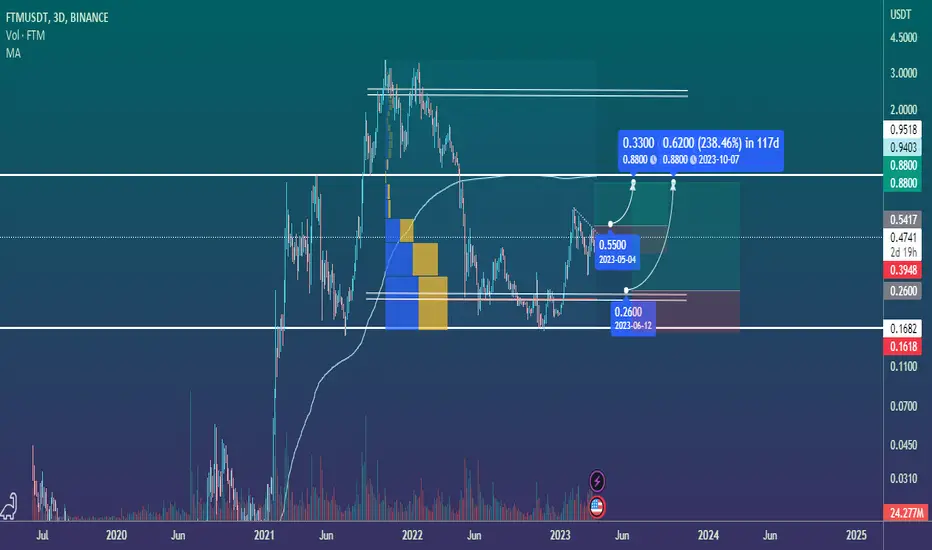
SasanSeifi 💁♂️FTM/USDT 3D UPDATE✅ 55%😍🔥🔥HI TRADERS✌ As I expected. In the long term, after the correction, the price faced buying pressure from the 0.30 range and was able to grow more than 50%. 😍🔥🔥✅
Currently, the price is trading in the range of 0.45.
If the candle closes above the 0.44 range in the 3-day time frame, the possibility of price growth up to the 0.52 / 0.57 / 0.66 range can be considered.
We have to see how the price will react...
Maintaining the 0.30/0.33 range is important to continue the positive trend.
❎ (DYOR)...⚠⚜
WHAT DO YOU THINK ABOUT THIS ANALYSIS? I will be glad to know your idea 🙂✌
IF you like my analysis please LIKE and comment 🙏✌

FTM ROADMAPHi, dear traders. how are you ? Today we have a viewpoint to BUY/SELL the FTM symbol.
For risk management, please don't forget stop loss and capital management
When we reach the first target, save some profit and then change the stop to entry
Comment if you have any questions
Thank You
