FTM/USDTThe foundation of this digital currency is good.
His recent explosive moves have been very attractive!
Like Bitcoin, it has entered a triangle
But the triangle is expanding!
FTMUSDT

FTM (D) Spot Trade Long (30% potential)As soon as the pull back is over I think Fantom will quickly recover and go back to previous high 0.66-067. It's a 30% trade!

What's stopping FTM from 1$?simply FTM giving us 20% stop loss for 200% profit
Perfect Ratio TBH on the long term.

good potential long FTMsince ftm broke resisctanse ist a matter of time before it explodes.
my FINAl targer would wel 1.08. but in between i will take some profits.

FTM Sell Limit 🤓🚩🤓🚩🤓Hi dear traders
FTM has formed bearish flag 🚩.
Now we can open short position and take some profit 📈.
All targets specified.
Let's see what happens
This is not financial advice ( DYOR )
Good luck

$FTM - could give us a SHORT opportunityHello my Fellow TraderZ,
$FTM in a recent uptrend literally ripped up the Shorters. But here could be an opportunity ONLY if we lose the Support of Line & the EMA 50 on 4 HTF.
Will see some strong retracement in downward around 15-20%. It could retrace more up to $0.32-$0.35, but will see that if #BTC starts behaving like a Bad Boy.
Get ready, observe the conditions, wait for Lower Low and just Hammer in CAPO style.
CHEERS!!!

FTM amazing profits after my call ! What next?FTM / USDT
FTM was one of strongest coins in this bullish wave
In less than 1 month it made more than 180%(spot) after my call in 8th January last month
See my previous idea here : ⬇️
WHAT NEXT ?
I recommend secure some of your profits As you can see in my chart we approaching strong resistance between 0.75$ and 1.10$
Big rejection can happen here however if it could break it the next will be the previous ATH or even more
Appropriate your support by likes and comment for more ideas like this one

FTM strong bounce !FTM / USDT
FTM is bouncing hard from massive support and breaking out the local resistance
Seems good for midterm

FTMAfter exiting the triangle, daily phantom time moved to the left side of its weekly resistance and reached its specified area. If the weekly candle closes, there is a possibility of correction to the specified areas. Good luck

FTMftm placed in the daily channel and has completed its harmonic pattern, it is likely that it will return to the bottom of the channel

$FTM Technical Analysis - R Fair Value Gap Turned Support *SMC**SMC* = Smart Money Concepts. See related Ideas for tutorials
In Smart Money, there are specific candle formation that will lead to a lot of clues to price action results. Yesterday FTM was the product child of those clues. Currently, the price has hit the top od the daily / weekly fair value gap. I just closed my long position because I expect it to retrace to thebottom of the weekly fair value gap, which in turn is also a breaker. These will act as support so once price reaches $0.548 we should see that support start working it's magic
Current chart label (1) Lower time frame
(2) It could retrace to the bottom of the order block which would balance the chart on a weekly level and then would also turn bullish at$0.51885 - See chart two higher time frame
1
2
We shall see good luck and happy trading

FTM ~ Approaching the resistanceTime to fade this BMR aka bear market rally around 0.64$.
For Bull to take control, price need to take support at mid level around 0.35-0.38C.
If fails, 0.10~0.13C would be good levels for investment.

FTm bull penn playing outWe are almost to the target but i wanted to point out this textbook breakout and retest of the bull pennant

$FTMUSDT UPDATE!!!Hi Snipers,
Please refer to the recording for the next price levels and scenarios.
Thanks
MS

FANTOM'S ADVANCED TECHNICAL ANALYSIS !!!Here we are having an advanced Elliott based analysis on one of the best featured DeFi projects, Fantom .
As the chart illustrates, the expected deep correction is done, by completing the wave (b) and reaching the daily order block and also, changing the main structure by crossing the last major pivot. It might have an appropriate possibility for investment and buy some Fantom on 0.32$ and hold for long (at least 2 yaers).
And let's look at the last impulsive wave from the Fantom:
We might see something like this! It's not dramatic, this is the reality!
-Stay tuned for more updates-

$FTM scalp ideaThe Fed decision could trigger this trade with ease. The lower and upper trend lines are part of a larger degree diagonal and we're approaching the final wave down.
Safe trades.

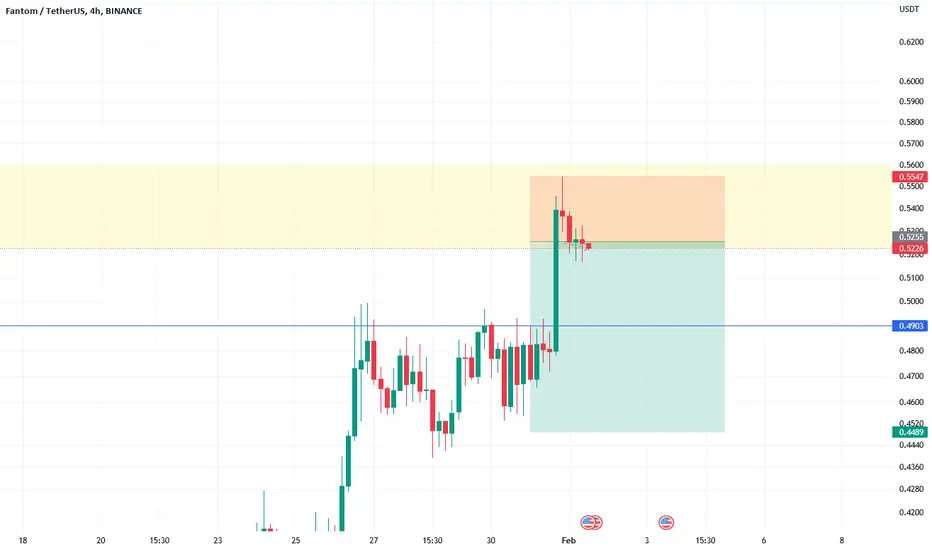
FTM/USDT Short positionFTM/USDT has shown a good reaction to its resistance.we have signal bar and entry bar.
SL:0.5547
TP1:0.4903
TP2:0.4489
FTM to ATH and beyond, question is WHEN?My opnion is that one of the fast performers on this new bull run will be FTM.
It's obvious from my point of view that the whole FTM/USDT graph it is a biiig BULL FLAG.
I've used the trend based fibo time to mark the possible answer to the question WHEN.
WHat do you think?
FTM is the ticker symbol for the cryptocurrency Fantom, which is a distributed ledger technology (DLT) platform designed to enable fast and scalable transactions. These are the key fundamentals and potential reasons for optimism regarding Fantom :
1.Scalability: Fantom aims to solve the scalability issues faced by other blockchain platforms by using its unique directed acyclic graph (DAG) structure, which enables parallel processing and high transaction speeds.
2.Interoperability: Fantom is designed to be interoperable with other blockchain networks, making it possible to integrate existing systems and infrastructure with the platform.
3.Use cases: Fantom is targeting a range of use cases, including digital asset management, supply chain management, and decentralized finance (DeFi) applications.
4.Partnerships and collaborations: Fantom has established partnerships and collaborations with a number of organizations and institutions, which could help to drive adoption and increase its network effect.
5.Research and development: The Fantom team is actively engaged in research and development activities aimed at improving the platform and expanding its capabilities.
This is just my opinion, it's not a financial advise!
Take care of your hard made money guys!
CHEERS!

FTM/USDT ChartHi, I try to post often so if you could follow and like it would mean a lot to me.
Crypto had a great run lately and in the midterm I am still bullish, but for now a small correction will probably happen. BTC is moving sideways and most altcoins don't have enough strength to break their next resistance so we will go back to support and then bounce. In the 4H and in 1D chart FTM is overvalued and looking to drop, so I think I have a nice short set up here. Not financial advice
We can only hope that 2023 is a good year for crypto and the markets in general.
I will probably give an update on APT in the next days, since I believe in a great run for the coin.

FTM , strongest RSI of them ALL!!!!Shall see if this ascending triangle breaks UP after 5 days of consolidation or we get a healthy retracement...
ps. tdespite the nasty corrections on many coins, this hasnt blinked much and strong like an oak... DYOR

Fast trade on FTMFast trade on FTMUSDT. The idea that we will try to brake this flat channel. Will see...

FTM/USDT. BitVero Crypto Academy.
Disclamer:
We are not financial advisors. The content that we share on this website are for educational purposes and are our own personal opinions.

The support of $0.2935 is still the most important supportThe support of $0.2935 is still the most important support. After the price hits the $0.50 resistance, we expect the bullish wave to enter the range at first and then enter the correction.
