FANTOM Bullish Pennant!KUCOIN:FTMUSDT
FTM has had a strong run and possibly breaking out of Bullish Pennant for upside to 0.2733, 0.2910, 0.3128.
Learn to buy support - see the lower horizontal rays to understand how to build edge.
If you liked this idea or if you have your own opinion about it, write in the comments.
The information and publications are not meant to be, and do not constitute, financial, investment, trading, or other types of advice or recommendations.
FTMUSDT

Fast trade on FTM - SHORTFast trade on FTM - SHORT with 1:1 risk\reward value. Point that we on the high level on the up trend channel. And "should" go back to middle of channel

This Logarithmic Chart Shows Fantom at Key IntersectionThe weekly Fantom (FTM) chart exposes a massive logarithmic channel that shows the FTM price at a key intersection between the bottom of the channel and a multi-year support level. An analysis of the FTM price action behavior within the logarithmic channel may reveal its next move.
FTM Logarithmic Channel
Long term, the FTM price remains locked in a logarithmic ascending channel. By connecting the previous peaks and bottoms, we can outline a clear ascending channel that shows potential future directions of FTM price.
In the short-term, FTM is already bouncing off the bottom of the channel. The bottom of the channel also aligns with a multi-year support zone between $0.15 and $0.16, which adds more confluence to this price area.
FTM Bullish/Bearish Cycles
The channel’s middle boundary played a major role in delimiting FTM’s bullish and bearish cycles. When the FTM price broke below the middle of the channel, we entered a bearish cycle.
We can also note an almost perfect symmetry between the length of the bullish cycle and the length of the bearish cycles. On average, FTM price has experienced a 60 week cycle.
If we project the same 60-week cycle into the future, we can expect FTM price to break the middle of the logarithmic channel by mid-2023, which would also be the start of the next bullish cycle.
RSI Oscillator
The Relative Strength Index (RSI) has the tendency to call the breakout of the middle channel in advance. A break above the 50 midpoint can potentially signal that the bottom is set in place.
Looking forward: The first resistance level comes near $0.42 level followed by the $1.0 big psychological level.

$FTMUSDT UPDATE!!!Hi Snipers,
Please refer to the recording for the next price levels and scenarios.
Thanks
MS

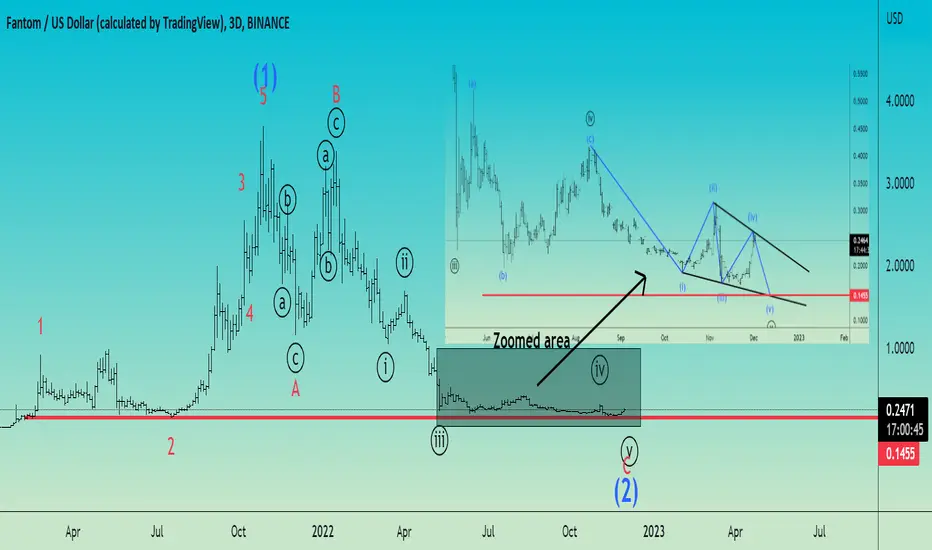
FTM/USDT Elliott Wave count 3D TFFantom may drop soon to end a 5th subwave from a 5th wave of a C wave from an extended flat correction that probably is wave 2.
What I expect next is a downward movement of the price to the 0.1455 zone marked by fib projection 3 vs 4 that you see in the zoomed picture of the last price action moments to complete this 5th wave from an ending diagonal .
I think that soon we will have the end of wave 2 and the Fantom will start the formation of wave 3 from a higher degree.
At this time I expect this wave 3 to start from 0.1455 zone where probably we will have the bottom of the correction.
I will stay short untill this ending diagonal is completed!
I have also a scenario with wave 4th a triangle but I will put it as a comment so as not to clutter the view but the overall things are bearish .
If you like my analysis please hit the like button and subscribe for future elliott wave counts!
Good luck!

FTM time for a small pullbackFTM is at a pivotal point which gives us a great risk reward trade.
i am setting 3 short orders at
0.2425
0.2440
0.2480
I have 3 take profi points as well.
0.2402
0.2385
0.2352
Stop loss if 1h candle closes above 0.2480 so keep an eye on it.
max loss 1%
max profit 4%
LEV x2
( while writing this post,i got in at first entry,but you can set the orders,it is still valid)
FOLLOW FOR MORE

The next resistance levels!FTM has recorded very good growth in the last 24 hours. Its price, which was above the resistance level of $0.20 with increasing demand, continued to move upward yesterday and today. The next resistance levels that we can consider for FTM are in the range of $0.26 and $0.29-0.31. . Fantom is still bearish on the daily time frame, and the resistances it targets could come with a reaction. But in the 4-hour time frame, the trend is upward, and the pullback towards the supports can bring signs of support again for the short term.

Fantom Has More To Give | 70% Potential Short-TermJust two days ago we looked at Fantom vs Tether (FTMUSDT) and would like an update as the chart looks really strong.
Previous trade idea | 28-Nov. Fantom Early Recovery | 100% Easy Potential Mapped
Fantom is already moving but this is only the beginning, more is on the way.
Today we have the 3D chart with an incredibly strong bullish bias.
First, we have the last 3 candles closing green, that's 9 days total where FTMUSDT has been bullish.
We have a strong RSI and prices already trading above EMA10 and EMA21.
The immediate resistance is set at 0.2575.
The main target is set at 0.4078 for a total of 70%, short-term, that is within a month...
We should start seeing things speed up for the cryptocurrency market as a whole.
Namaste.

FTMUSDT Bullish short-term + break-out target.*** ***
For this particular analysis on the Fantom token we are using the FTMUSDT symbol on the OKX exchange .
*** ***
The idea is on the 1D time-frame where FTM has been trading within a Falling Wedge pattern since the May 23 2022 Lower High. Today it broke above the 1D MA50 (blue trend-line) for the first time since November 08 and that alone calls for a bullish extension towards the top (Lower Highs trend-line) of the Falling Wedge.
That would mean hitting the 1D MA200 (orange trend-line), which has been intact since March 03 2022. That would fall nicely on the 0.618 Fibonacci retracement level, which both previous Lower Highs either approached or marginally broke. A break above the 0.786 Fib (above the Falling Wedge) will be a bullish break-out signal for us, targeting the 0.4200 Resistance (August 13 High).
-------------------------------------------------------------------------------
** Please LIKE 👍, SUBSCRIBE ✅, SHARE 🙌 and COMMENT ✍ if you enjoy this idea! Also share your ideas and charts in the comments section below! This is best way to keep it relevant, support me, keep the content here free and allow the idea to reach as many people as possible. **
-------------------------------------------------------------------------------
You may also TELL ME 🙋♀️🙋♂️ in the comments section which symbol you want me to analyze next and on which time-frame. The one with the most posts will be published tomorrow! 👏🎁
-------------------------------------------------------------------------------
💸💸💸💸💸💸
👇 👇 👇 👇 👇 👇

FTMIn order to understand this analysis I must explain The green ABC inside of the circle, the yellow 5 up below the A wave inside the circle. Also The red ABC down and the green B inside the circle. Also the Blue line & the triangle.
1st my HTF analysis is that FTM is inside of a bearish ABC up on the monthly TF. A zig zag on weekly TF will create the waves on the monthly TF . 5 up for wave A inside of the green circle ended in 2021 & started in 2020 closing that TF off and making the highs above $3 last year. Wave A
2nd green B wave inside the circle (currently finishing in 2022) the red ABC down will make the B wave on the monthly TF , 618% green fib level or more likely 786% is a perfect area to find support for a B wave on any TF. Wave B
3rd blue line from bottom of the triangle points directly at the 786% and is measured from height of top TL down to bottom TL of the massive triangle correction. This shows that a big move down is likely.
After we confirm the B wave on HTF monthly chart between .07 to.01c we can plot wave C on the HTF which is not visible in my chart. But if I had to project or forecast this future PA I would say C wave can easily do a 1 to 1 fib extension from the top of the green A wave on the HTF , down to green B wave HTF & we get a target around $30-$34 into 2024.
Also this chart is Log scale as per my preference with EW..

Time to short FantomBased on my technical analysis aka "casino crypto" 50/50 =D it looks like Fantom has to bow back to at least 1.8

FTM short limitsHello trader!
Welcome back to another episode with Analyst Aadil1000x and we are back with a new way of trading.
This is a trade of FTMusdt and in this trade, we will take Sell at a psychological round number.
The main reason to Sell FTM is that it's below the 200 D1 moving average indicator which shows its trending bearish and we will only take short entries from psychological round numbers in FTM.
The first Short entry is near 0.2190 and In case if the market moves upside then we will short again with 50% more size than entry 1.
To learn more you can view the education post on this strategy and you can ask questions related to this.
Don't forget to hit the like button and follow to stay connected

Fantom (FTM) - November 29Hello?
Traders, welcome.
If you "Follow", you can always get new information quickly.
Please also click "Boost".
Have a good day.
-------------------------------------
(FTMBTC 1W chart)
It must rise above 0.0000 1374 to gain the strength of the rise.
--------------------------------------
(FTMUSDT 1W chart)
The key question is whether the price can sustain the move above 0.3339.
(1D chart)
The key is whether the price can sustain above 0.2280 to break out of the downtrend line.
If not, you should check for support around 0.1799.
-------------------------------------------------- -------------------------------------------
** All descriptions are for reference only and do not guarantee profit or loss in investment.
** If this chart is shared, you can use the indicators normally.
** The MRHAB-T indicator includes indicators that indicate points of support and resistance.
** HA SRRC indicators are displayed as StochRSI (line), RSI (columns), and CCI (bgcolor).
** The CCI indicator is displayed in the overbought section (CCI > +100) and oversold section (CCI < -100).
(Short-term Stop Loss can be said to be a point where profit or loss can be preserved or additional entry can be made by split trading. This is a short-term investment perspective.)
---------------------------------

FTM / USDT 1D Interval We will now check the situation on FTM to USDT, first we will mark the downtrend channel in which the price has been moving for a long time, while locally we can mark the uptrend lines with yellow color.
As we can see we have a strong support zone from the seventeen cents to fifteen cents level which must hold the price to prevent it from deepening the channel, however if we go lower we can see the price around thirteen cents.
Looking the other way, we see that the first resistance is at twenty-one cents, the second at twenty-three cents, the third at twenty-four cents, and the fourth at twenty-seven cents. Only overcoming these resistances and leaving the channel upwards can open the way for greater increases.
Nevertheless, we can see that the energy is strongly charged and the makdi indicates an uptrend, and the volume is on the side of the buyers, if BTC maintains its level or starts to grow, we can see an increase in the FTM price.

FTM has held its key support!FTM has held its key support in the $0.17-$0.19 range for the past few weeks and has moved back towards the $0.20 target as a positive divergence has formed in line with last week's formation. In the 4-hour period, the price trend is still in the range, and the resistance that we can consider is in the range of $0.193 to $0.200. Several negative reactions to this resistance have caused the trend to range.
If you look closely at the chart, the midline of the drawn descending channel has also overlapped with this range, which shows the strength of this range in the lower time frames. If this resistance is broken, support from buyers is needed to bring the price back above the $0.210 level. Otherwise, there is a possibility of fake breaking the resistance of $0.20 and returning to the main supports. But if the resistances are broken, and we see price consolidation, Phantom will find the potential for the price to rise to the top of the descending channel in the $0.25 range.

FTM/USDT4H Timeframe shows us a classic bearish divergence => For taking a short position I wanna see an extended bearish divergence, it's because we can see it more often while spotting the trend reverse ( wave 3 and wave 4 make classic bearish divergence, BUT then the wave 5 making a higher high and taking the stop loss liquidity of the waves 3 and 4, after that we can see an extended divergence)
! In between the waves 3,4 and the wave 5 usually there is a hidden bullish divergence!
On our FTM USDT chart we could notice a bearish divergence but it didn't go well, because MACD histogram did lower low while the chart was making higher high in the up trend, so it's a very nice bullish signal for taking a BUY position. If you missed it, no worries, just wait for the extended bearish divergence and go short!

Fantom Early Recovery | 100 Easy Potential MappedThe inverse H&S or 3 drops pattern that I just mentioned on the Bitcoin chart has shown here on FTMUSDT.
After the 6-9 Nov. Drop, we have two more drops and then we see Fantom starting to recover.
The last drop happened earlier today and we already see this pair moving above EMA10 and EMA21.
The 100% mapped on this chart is just the easy target, there is room long-term for so much more.
Enjoy.
Namaste.

FANTOM technical analysisPrice is currently ranging in an ascending channel respecting the support line. I am waiting for price to break below this support to liquidate it and move down towards the 5h demand around $0.17 where we would be then looking to long from.

FTM is Long 👑Hello TradingView community 🚀 and my followers, please if you like the ideas, don't forget to support them with likes and comments, thank you very much and here we go.
Today I want to talk to you about the FTM chart.
At the moment price break the structure.
Then, I think FTM breaks continue to move up to my goal.
My target is located at charts level.
I expect this scenario.
This is my opinion, I really hope it will be useful for you.

Fantom (FTM) formed bullish Shark for upto 11% pumpHi dear friends, hope you are well and welcome to the new trade setup of the Fantom ( FTM ) coin with BTC pair.
Previously I shared a long-term trade setup of FTM , which is still in play as below:
This time on a 4-hr time frame, FTM has formed a bullish Shark pattern. At the moment, after the completion of final leg the priceline has slightly moved up, therefore, we can wait for some correction to buy it from the buying zone.
Note: Above idea is for educational purpose only. It is advised to diversify and strictly follow the stop loss, and don't get stuck with trade

FTM / USDT 4H Interval - Targets and ResistanceHello everyone, let's look at the FTM to USDT chart on a four-hour time frame. As you can see, the price has broken out of the local downtrend line.
Let's start with the support line and as you can see the first support is $0.184, if the support is broken then the next support is $0.178, $0.172 and $0.167.
Now let's go to the resistance line, as you can see the first resistance is $0.193, if you manage to break it, the next resistance will be $0.198, $0.206 and $0.216, reaching the fourth resistance will give the price an increase of fourteen percent from the current price.
Looking at the CHOP indicator, we see that in the four-hour interval we still have a lot of energy for further movement, and the makdi indicator indicates a local uptrend.

i,m bulish on ftm . i think it will go up to the range of 0.23 ci,m bulish on ftm . i think it will go up to the range of 0.23 cents from here
and be sure observe the stop loss in 0.166 cents
